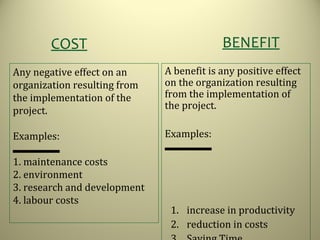
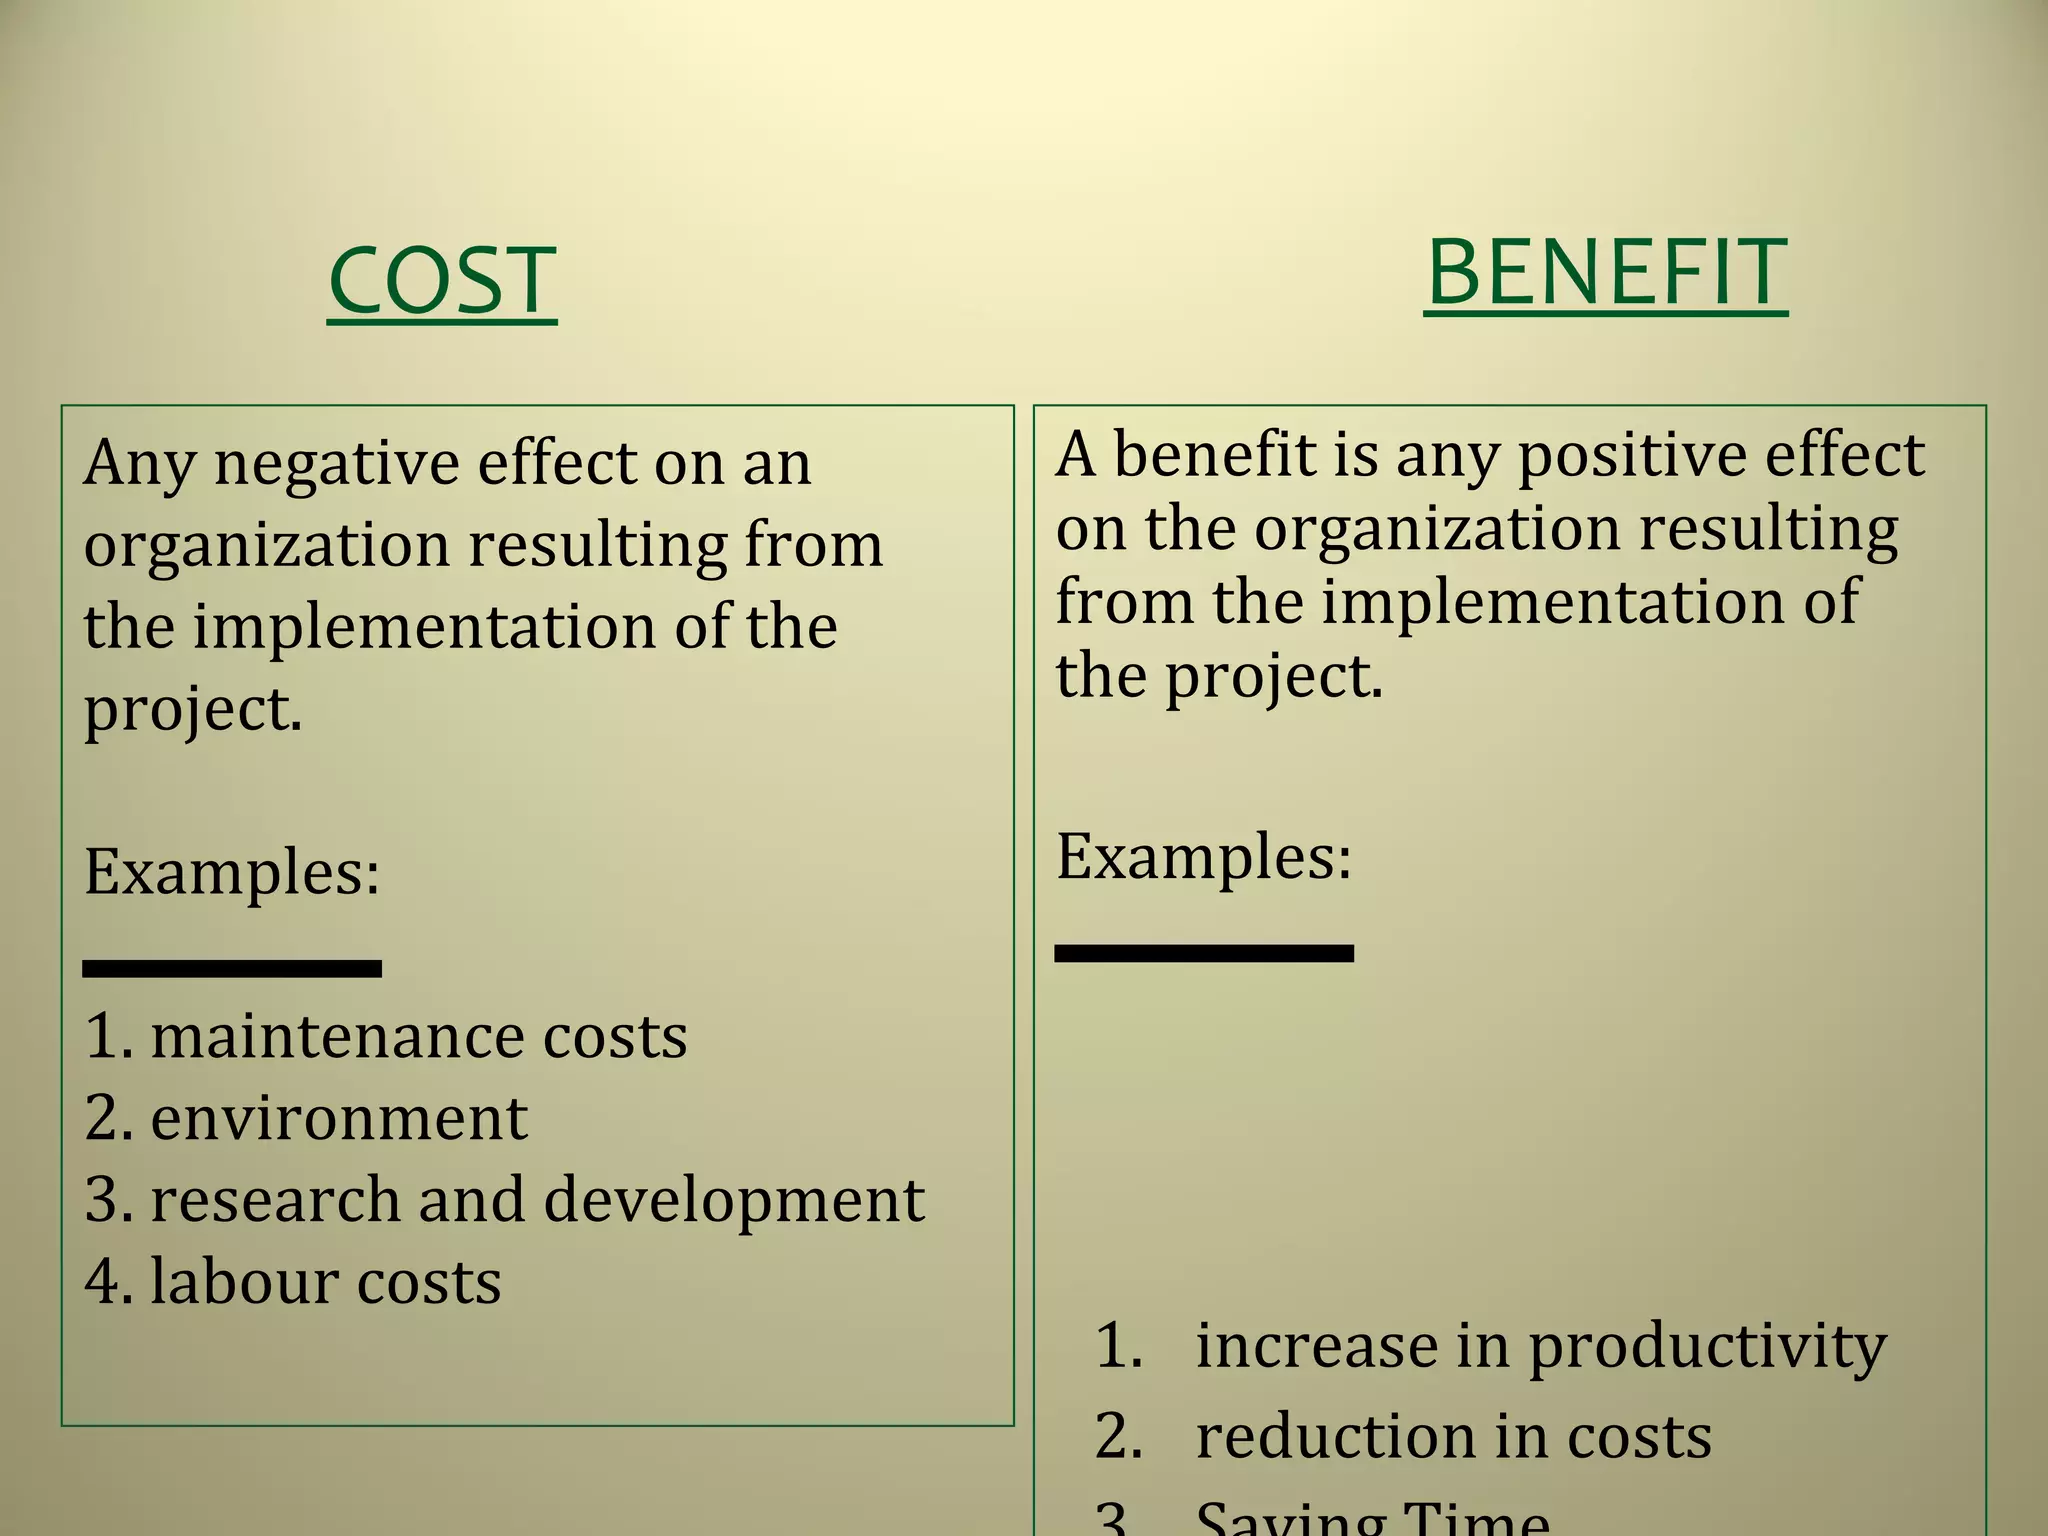
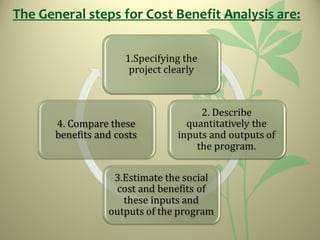
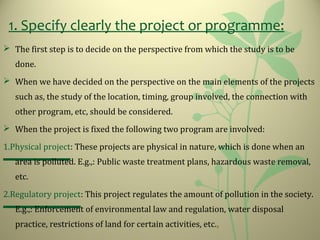
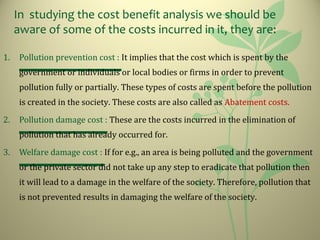
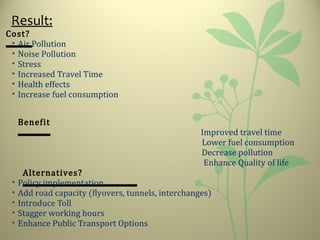
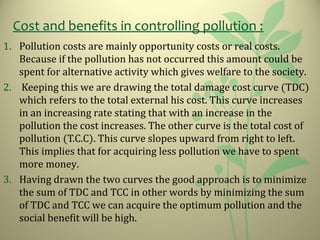
Any negative effect on an
organization resulting from
the implementation of the
project.
Examples:
1. maintenance costs
2. environment
3. research and development
4. labour costs
A benefit is any positive effect
on the organization resulting
from the implementation of
the project.
Examples:
1. increase in productivity
2. reduction in costs
COST BENEFIT
Concept of Cost – Benefit Analysis:
 Cost benefit is a tool which modern financial analysts adopt
before undertaking any financial operation or commercial
activity.
 The ultimate aim of a business organization is to make
profits.
 Therefore, any system in the organization must produce more
benefits as compared to its costs for the organization to
survive & prosper.
BENEFITS > COSTS
What is Cost Benefit Analysis..???
 A cost benefit analysis is done to determine how well, or how poorly, a planned
action will turn out.
 The analysis relies on the addition of positive factors and the subtraction of
negative ones to determine a net result.
 CBA has been established primarily as a tool for use by governments in
making their social and economic decisions.
 CBA measures costs and benefits to the community of adopting a
particular course of action e.g. Constructing a dam, by-pass etc.
 When investment made commensurates with the benefit derived, it can be said
that operation is positive and viable; but when benefits derived do not
compensate financial investments made, it can be said that it is financially non-
viable and negative.
ost Benefit Analysis can be traced back to the
19th
century by a French engineer & economist
Jules Dupuit.
n 1936, it is a simple way of weighing up project costs and
benefits, to determine whether to go ahead with a project or
not.
History :
Why Cost Benefit Analysis.???
ost Benefit Analysis is used to determine:
hether a solution/project is economically feasible
hich of two or more projects provides the best return on investment
ther issues :
Is the project worthwhile financially?
Costs & Benefits of Information Systems:
COSTS BENEFITS
Hardware Tangible
Telecommunications Increased Productivity
Software Low Operating Costs
Personnel Reduced Workforce
Lower Computer Costs
Accessories : Lower Outside Vendor Costs
Computer ink/ribbon Reduced Facility Costs
UPS Intangible
Improved Organizational
Services : Increased Organizational
Flexibility
Insurance Improved Decision making
Physical Facilities : Enhanced Employee
Morale
Building Increased Job Satisfaction
Furniture Higher Customer
Satisfaction
Improved Organizational
Image
The General steps for Cost Benefit Analysis are:
1. Specify clearly the project or programme:
 The first step is to decide on the perspective from which the study is to be
done.
 When we have decided on the perspective on the main elements of the projects
such as, the study of the location, timing, group involved, the connection with
other program, etc, should be considered.
 When the project is fixed the following two program are involved:
1.Physical project: These projects are physical in nature, which is done when an
area is polluted. E.g.,: Public waste treatment plans, hazardous waste removal,
etc.
2.Regulatory project: This project regulates the amount of pollution in the society.
E.g.,: Enforcement of environmental law and regulation, water disposal
practice, restrictions of land for certain activities, etc.,
2.Describe quantitatively the inputs and outputs of
the programme:
 For some projects it is easy to identify the input and output.
 For eg.,if we are planning a waste water treatment project, the staffs
of that program will be able to provide a full physical specification
of the plant, together with the inputs required to build it and keep it
running.
 However, it is harder to predict the externalities caused by the
disposition of nuclear waste.
 Because a restriction on development in a particular area can be
expected to detect development elsewhere into the surrounding
areas.
3. Estimate the social cost and benefit of these
inputs and outputs :
he next step is to put values on input and output flows.
(i.e) to measure costs and benefits.
e could do this in any units but in many cases we will be dealing with
effects, especially on the benefit side that are not directly registered
on market.
4.Compare these benefits and cost :
ext step is to make comparison between cost incurred and benefit
derived from the project.
ne of them is to subtract the total cost from the total benefit to get
net benefit.
(Total cost – Total benefit = Net benefit).
f the net benefit is positive then the cost benefit is positive and if the
net benefit is negative then the cost benefit is negative.
In studying the cost benefit analysis we should be
aware of some of the costs incurred in it, they are:
1. Pollution prevention cost : It implies that the cost which is spent by the
government or individuals or local bodies or firms in order to prevent
pollution fully or partially. These types of costs are spent before the pollution
is created in the society. These costs are also called as Abatement costs.
2. Pollution damage cost : These are the costs incurred in the elimination of
pollution that has already occurred for.
3. Welfare damage cost : If for e.g., an area is being polluted and the government
or the private sector did not take up any step to eradicate that pollution then
it will lead to a damage in the welfare of the society. Therefore, pollution that
is not prevented results in damaging the welfare of the society.
Result:
Cost?
• Air Pollution
• Noise Pollution
• Stress
• Increased Travel Time
• Health effects
• Increase fuel consumption
Benefit
Improved travel time
Lower fuel consumption
Decrease pollution
Enhance Quality of life
Alternatives?
• Policy implementation
• Add road capacity (flyovers, tunnels, interchanges)
• Introduce Toll
• Stagger working hours
• Enhance Public Transport Options
Cost to the society due
to pollution:
X axis = Level of pollution
Y axis = cost in rupees
Rightward ‘X’ axis =
Pollution increases and
towards left less pollution.
At origin “O” pollution is nil.
Similarly ‘Y’ axis if we go up,
the cost incurred is high and
lower the cost is less.
Cost and benefits in controlling pollution :
1. Pollution costs are mainly opportunity costs or real costs.
Because if the pollution has not occurred this amount could be
spent for alternative activity which gives welfare to the society.
2. Keeping this we are drawing the total damage cost curve (TDC)
which refers to the total external his cost. This curve increases
in an increasing rate stating that with an increase in the
pollution the cost increases. The other curve is the total cost of
pollution (T.C.C). This curve slopes upward from right to left.
This implies that for acquiring less pollution we have to spent
more money.
3. Having drawn the two curves the good approach is to minimize
the sum of TDC and TCC in other words by minimizing the sum
of TDC and TCC we can acquire the optimum pollution and the
social benefit will be high.
Cost Benefit Analysis:
1. The CBC analysis may be
applicable for both the new as
well as old projects.
2. It is based of accepted social
principle that is on individual
preference.
3. This method encourages
development for new techniques
for the evaluation of social
benefits.
1. The government is not
completely aware of all the cost
and benefits associated with the
program.
2. This approach does not clearly
states that who should bear the
population control cost.
MERITS DEMERITS
Conclusion :
 It gives planners a method to try and “put all relevant costs
and benefits on a common temporal footing” in order to help
people make informed decisions.
 It provides people with an understanding as to the economic
costs of decisions, and allows arguments to be made for or
against a change based upon economic considerations.
 It is a decision-making process that forces the decision maker
to compare all direct and indirect positive and negative
effects of the proposed decision on an objective basis.

Cost-benefit analysis

  • 1.
    Any negative effecton an organization resulting from the implementation of the project. Examples: 1. maintenance costs 2. environment 3. research and development 4. labour costs A benefit is any positive effect on the organization resulting from the implementation of the project. Examples: 1. increase in productivity 2. reduction in costs COST BENEFIT
  • 2.
    Concept of Cost– Benefit Analysis:  Cost benefit is a tool which modern financial analysts adopt before undertaking any financial operation or commercial activity.  The ultimate aim of a business organization is to make profits.  Therefore, any system in the organization must produce more benefits as compared to its costs for the organization to survive & prosper. BENEFITS > COSTS
  • 3.
    What is CostBenefit Analysis..???  A cost benefit analysis is done to determine how well, or how poorly, a planned action will turn out.  The analysis relies on the addition of positive factors and the subtraction of negative ones to determine a net result.  CBA has been established primarily as a tool for use by governments in making their social and economic decisions.  CBA measures costs and benefits to the community of adopting a particular course of action e.g. Constructing a dam, by-pass etc.  When investment made commensurates with the benefit derived, it can be said that operation is positive and viable; but when benefits derived do not compensate financial investments made, it can be said that it is financially non- viable and negative.
  • 4.
    ost Benefit Analysiscan be traced back to the 19th century by a French engineer & economist Jules Dupuit. n 1936, it is a simple way of weighing up project costs and benefits, to determine whether to go ahead with a project or not. History :
  • 5.
    Why Cost BenefitAnalysis.??? ost Benefit Analysis is used to determine: hether a solution/project is economically feasible hich of two or more projects provides the best return on investment ther issues : Is the project worthwhile financially?
  • 6.
    Costs & Benefitsof Information Systems: COSTS BENEFITS Hardware Tangible Telecommunications Increased Productivity Software Low Operating Costs Personnel Reduced Workforce Lower Computer Costs Accessories : Lower Outside Vendor Costs Computer ink/ribbon Reduced Facility Costs UPS Intangible Improved Organizational
  • 7.
    Services : IncreasedOrganizational Flexibility Insurance Improved Decision making Physical Facilities : Enhanced Employee Morale Building Increased Job Satisfaction Furniture Higher Customer Satisfaction Improved Organizational Image
  • 8.
    The General stepsfor Cost Benefit Analysis are:
  • 9.
    1. Specify clearlythe project or programme:  The first step is to decide on the perspective from which the study is to be done.  When we have decided on the perspective on the main elements of the projects such as, the study of the location, timing, group involved, the connection with other program, etc, should be considered.  When the project is fixed the following two program are involved: 1.Physical project: These projects are physical in nature, which is done when an area is polluted. E.g.,: Public waste treatment plans, hazardous waste removal, etc. 2.Regulatory project: This project regulates the amount of pollution in the society. E.g.,: Enforcement of environmental law and regulation, water disposal practice, restrictions of land for certain activities, etc.,
  • 10.
    2.Describe quantitatively theinputs and outputs of the programme:  For some projects it is easy to identify the input and output.  For eg.,if we are planning a waste water treatment project, the staffs of that program will be able to provide a full physical specification of the plant, together with the inputs required to build it and keep it running.  However, it is harder to predict the externalities caused by the disposition of nuclear waste.  Because a restriction on development in a particular area can be expected to detect development elsewhere into the surrounding areas.
  • 11.
    3. Estimate thesocial cost and benefit of these inputs and outputs : he next step is to put values on input and output flows. (i.e) to measure costs and benefits. e could do this in any units but in many cases we will be dealing with effects, especially on the benefit side that are not directly registered on market.
  • 12.
    4.Compare these benefitsand cost : ext step is to make comparison between cost incurred and benefit derived from the project. ne of them is to subtract the total cost from the total benefit to get net benefit. (Total cost – Total benefit = Net benefit). f the net benefit is positive then the cost benefit is positive and if the net benefit is negative then the cost benefit is negative.
  • 13.
    In studying thecost benefit analysis we should be aware of some of the costs incurred in it, they are: 1. Pollution prevention cost : It implies that the cost which is spent by the government or individuals or local bodies or firms in order to prevent pollution fully or partially. These types of costs are spent before the pollution is created in the society. These costs are also called as Abatement costs. 2. Pollution damage cost : These are the costs incurred in the elimination of pollution that has already occurred for. 3. Welfare damage cost : If for e.g., an area is being polluted and the government or the private sector did not take up any step to eradicate that pollution then it will lead to a damage in the welfare of the society. Therefore, pollution that is not prevented results in damaging the welfare of the society.
  • 14.
    Result: Cost? • Air Pollution •Noise Pollution • Stress • Increased Travel Time • Health effects • Increase fuel consumption Benefit Improved travel time Lower fuel consumption Decrease pollution Enhance Quality of life Alternatives? • Policy implementation • Add road capacity (flyovers, tunnels, interchanges) • Introduce Toll • Stagger working hours • Enhance Public Transport Options
  • 15.
    Cost to thesociety due to pollution: X axis = Level of pollution Y axis = cost in rupees Rightward ‘X’ axis = Pollution increases and towards left less pollution. At origin “O” pollution is nil. Similarly ‘Y’ axis if we go up, the cost incurred is high and lower the cost is less.
  • 16.
    Cost and benefitsin controlling pollution : 1. Pollution costs are mainly opportunity costs or real costs. Because if the pollution has not occurred this amount could be spent for alternative activity which gives welfare to the society. 2. Keeping this we are drawing the total damage cost curve (TDC) which refers to the total external his cost. This curve increases in an increasing rate stating that with an increase in the pollution the cost increases. The other curve is the total cost of pollution (T.C.C). This curve slopes upward from right to left. This implies that for acquiring less pollution we have to spent more money. 3. Having drawn the two curves the good approach is to minimize the sum of TDC and TCC in other words by minimizing the sum of TDC and TCC we can acquire the optimum pollution and the social benefit will be high.
  • 17.
    Cost Benefit Analysis: 1.The CBC analysis may be applicable for both the new as well as old projects. 2. It is based of accepted social principle that is on individual preference. 3. This method encourages development for new techniques for the evaluation of social benefits. 1. The government is not completely aware of all the cost and benefits associated with the program. 2. This approach does not clearly states that who should bear the population control cost. MERITS DEMERITS
  • 18.
    Conclusion :  Itgives planners a method to try and “put all relevant costs and benefits on a common temporal footing” in order to help people make informed decisions.  It provides people with an understanding as to the economic costs of decisions, and allows arguments to be made for or against a change based upon economic considerations.  It is a decision-making process that forces the decision maker to compare all direct and indirect positive and negative effects of the proposed decision on an objective basis.