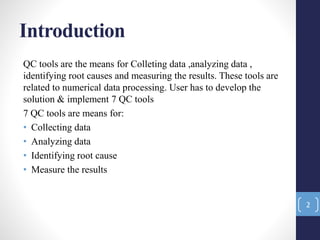
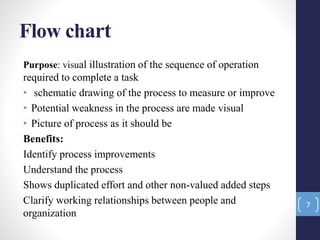
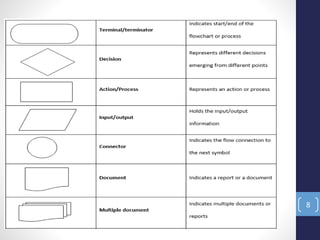
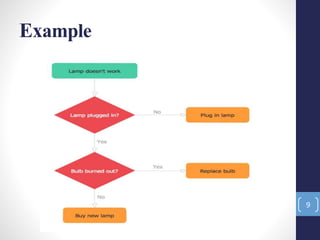
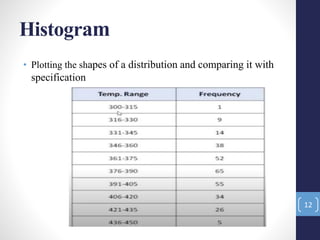
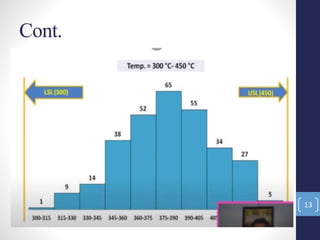
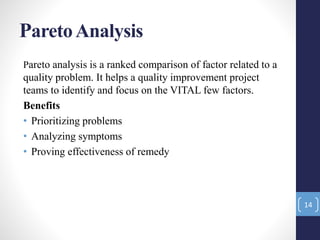
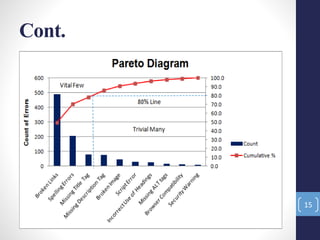
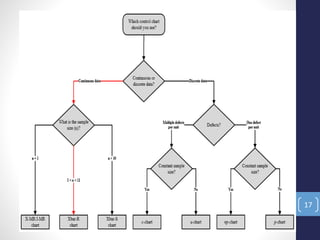
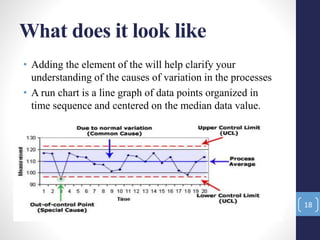
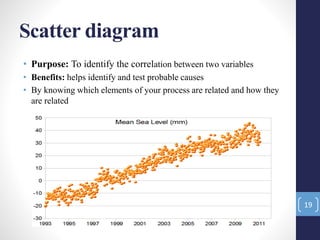
Seven Quality
Control Tools
1
Introduction
QC tools are the means for Colleting data ,analyzing data ,
identifying root causes and measuring the results. These tools are
related to numerical data processing. User has to develop the
solution & implement 7 QC tools
7 QC tools are means for:
• Collecting data
• Analyzing data
• Identifying root cause
• Measure the results
2
7 QC Tools
• Cause and effect diagram
• Pareto Analysis
• Flow chart
• Scatter diagram
• Check sheet
• Histogram
• Control chart
3
Cause and effect diagram
• It is also known as ishikawa and fish bone diagram.
Purpose: Graphical representation of potential causes of a
problem
Brainstorming fishbone diagram
4
Benefits
•Breaks problems down into bite size
pieces to find out cause
•Foster team work
•Common understanding of factors
causing problem
•Follows brainstorming relationship
5
Example
6
Flow chart
Purpose: visual illustration of the sequence of operation
required to complete a task
• schematic drawing of the process to measure or improve
• Potential weakness in the process are made visual
• Picture of process as it should be
Benefits:
Identify process improvements
Understand the process
Shows duplicated effort and other non-valued added steps
Clarify working relationships between people and
organization
7
8
Example
9
Check sheet
Purpose: tool for collecting and organizing
measured or counted data
• Data collected can be used as input data for
other tools
Benefits: collect data in a systematic and
organized manner
• To determine source of problem
• To facilitate classification of data (stratification)
10
Cont.
11
Histogram
• Plotting the shapes of a distribution and comparing it with
specification
12
Cont.
13
ParetoAnalysis
14
Pareto analysis is a ranked comparison of factor related to a
quality problem. It helps a quality improvement project
teams to identify and focus on the VITAL few factors.
Benefits
• Prioritizing problems
• Analyzing symptoms
• Proving effectiveness of remedy
Cont.
15
Control chart
Purpose: The primary purpose of a control chart
is to predict expected product outcome.
Benefits:
• Predict process out of control and out of
specification limits
• Distinguish between specific, identifiable causes
of variation
• Can be used for Statistical Process Control
(SPC)
16
17
What does it look like
• Adding the element of the will help clarify your
understanding of the causes of variation in the processes
• A run chart is a line graph of data points organized in
time sequence and centered on the median data value.
18
Scatter diagram
• Purpose: To identify the correlation between two variables
• Benefits: helps identify and test probable causes
• By knowing which elements of your process are related and how they
are related
19

7 qc tools

  • 1.
  • 2.
    Introduction QC tools arethe means for Colleting data ,analyzing data , identifying root causes and measuring the results. These tools are related to numerical data processing. User has to develop the solution & implement 7 QC tools 7 QC tools are means for: • Collecting data • Analyzing data • Identifying root cause • Measure the results 2
  • 3.
    7 QC Tools •Cause and effect diagram • Pareto Analysis • Flow chart • Scatter diagram • Check sheet • Histogram • Control chart 3
  • 4.
    Cause and effectdiagram • It is also known as ishikawa and fish bone diagram. Purpose: Graphical representation of potential causes of a problem Brainstorming fishbone diagram 4
  • 5.
    Benefits •Breaks problems downinto bite size pieces to find out cause •Foster team work •Common understanding of factors causing problem •Follows brainstorming relationship 5
  • 6.
  • 7.
    Flow chart Purpose: visualillustration of the sequence of operation required to complete a task • schematic drawing of the process to measure or improve • Potential weakness in the process are made visual • Picture of process as it should be Benefits: Identify process improvements Understand the process Shows duplicated effort and other non-valued added steps Clarify working relationships between people and organization 7
  • 8.
  • 9.
  • 10.
    Check sheet Purpose: toolfor collecting and organizing measured or counted data • Data collected can be used as input data for other tools Benefits: collect data in a systematic and organized manner • To determine source of problem • To facilitate classification of data (stratification) 10
  • 11.
  • 12.
    Histogram • Plotting theshapes of a distribution and comparing it with specification 12
  • 13.
  • 14.
    ParetoAnalysis 14 Pareto analysis isa ranked comparison of factor related to a quality problem. It helps a quality improvement project teams to identify and focus on the VITAL few factors. Benefits • Prioritizing problems • Analyzing symptoms • Proving effectiveness of remedy
  • 15.
  • 16.
    Control chart Purpose: Theprimary purpose of a control chart is to predict expected product outcome. Benefits: • Predict process out of control and out of specification limits • Distinguish between specific, identifiable causes of variation • Can be used for Statistical Process Control (SPC) 16
  • 17.
  • 18.
    What does itlook like • Adding the element of the will help clarify your understanding of the causes of variation in the processes • A run chart is a line graph of data points organized in time sequence and centered on the median data value. 18
  • 19.
    Scatter diagram • Purpose:To identify the correlation between two variables • Benefits: helps identify and test probable causes • By knowing which elements of your process are related and how they are related 19