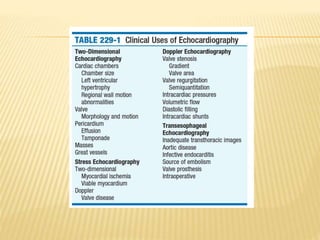
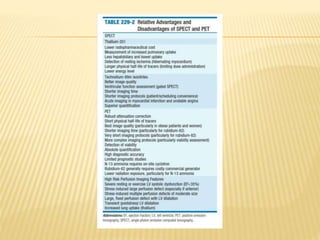
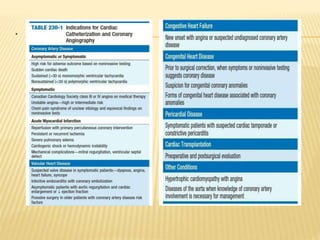
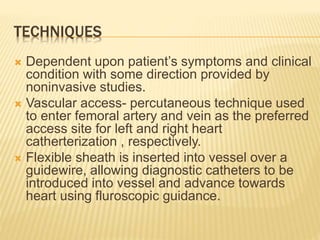
DIAGNOSTIC TOOL
BY
KAPIL MOHAN
7TH BATCH,INTERN
JMCTH
CVS
TYPES
1. Ecg
2. Non invasive cardiac imaging
a. echocardiography
b. nuclear cardiology
c. mri/ct imaging
3. Diagnostic cardiac catheterization &
Coronary angiography
ECG/EKG
Graphical recording of electric potentials
generated by heart, signals detected by means
of metal electrodes attached to extremities and
chest wall.
Clinincal utility:
Immediate, noninvasive, inexpensive, highly
versatile test
ECG LEADS
12 conventional ECG leads are there divided
into two groups : 6 limb leads (extremity) 6
chest leads ( precordial )
Limb leads record potentials transmitted onto
frontal plane and chest leads record potentials
transmitted onto horizontal plane.
 Ecg leads are configured so that
+ive(upright) deflection is recorded if wave of
depolarisation spreads towards postive pole
of lead and –ive deflection is recorded if
wave spreads towards negative pole.
EINTHOVEN TRIANGLE
 The 3 standard limb leads form an equilateral
triangle at centre of heart.
GENESIS OF ECG
 P wave
 QRS complex
 T wave
 U wave
RHYTHM OF HEART
 Normal rhythm is sinus rhythm.
 Cardiac pacemaker: SA node (60-100 bpm)
 Other potenial pacemakers are known as
ectopic or subsidary pacemakers
 atrial/junctional pacemaker- 40-60bpm
 Ventricular pacemaker:20-40bpm
IRREGULARITY
Regeularly irregular- premature beats during
any rhtyhm , bigeminal rhythm
Irregularly irregular – atrial fibrillation( disrete p
waves of sinus rhythm are replaced by
numerous, small fibrillating waves.
Ventricular fibrillation- rapid small deformed
deflections
R-R INTERVAL- HEART RATE
 Heart rate- number of heart beats / min.
 In ECG- number of cardiac cycles occuring
during a 60 sec continuos recording of ecg.
 Method: 300/ no. of large squares between
two R waves.
P WAVE
 Produced by atrial depolarisation
 Normally upright in most of ecg leads except
avR ( dirction of atrial activation is away from
this lead )
 Height : < 0. 25 mv
 width : < 0.10 sec
ABNORMALITIES OF P WAVE
 Absent
atrial fibrillation
atrial flutter( saw toothed apperance of
baseline)
venticular tacycardia
Hyperkalemia
 Broad p wave
left atrial enlargement >0.10 sec
 Inverted p wave
junctional rhythm
by pass tract
 Tall p wave
right atrial enlagement
p pulmonale (pulmonary hypertension)
p congenitale ( congenital heart disease )
QRS COMPLEX
 Produced by ventricular depolarisation, r
wave is positive while q and s waves are
negative
 Q wave – seen in L1, aVL, V5, V6
(physiological)
width:<0.04sec, depth <25%of R wave
pathological q wave due to necrosis of heart
muscle or MI and criteria is ≥0.04 sec , >1/4
of R wave, +nt in other leads than in those
with
 R wave : almost all the leads except aVR.
Gradually increases as we move from V1 to
V6(V1 ≤0.4 mV ; V6 ≤2.5 mV)
Abnormalities : tall R wave
In V1 lead: rvh, rbbb, wpw syndrome, true
posterior wall infarction
In V6: lvh, lbbb
S WAVE
 Negative deflection that follows R wave.
 Normally greater than R wave in V1: smaller
than R wave in V6
ABNORMAL QRS COMPLEX
 Normal width : 0.04 sec to 0.08 sec
 >0.08 sec
 Bundle branch block: rbbb, lbbb
 Intraventricular conduction defect:
antiarrhythmic drugs eg amiodarone,
electroltye imbalance eg hyperkalemia,
myocardial disease eg myocarditis
 Ventricular preexcitation : wpw syndrome, lgl
syndrome
 Wide QRS arrhythmias :atrial fibrillation with
VT
T WAVE
Produced by ventricular depolarisation
Normally upright in most leads . Inverted in
aVR along with inversion of P wave and QRS
complex
Also in lead V1, V2, V3, L3
Amplitude : ≤5mm in limb leads; ≤ 10mm in
precordial leads.
 Abnormalities of T wave
 Inverted T wave :
physiological- heavy metals, smoking, anxiety,
tachycardia, hyperventilation
extracardiac causes- systemic ( shock,
haemorrhage), cranial (CVA) , abdominal
(pancreatitis, cholecystitis), respi ( pulmonary
embolism ), endocrine ( hypothyroidism)
 Specific causes-
 1º abnormality- pharmacological
(digitalis),metabolic(cardiomyopathy),
pericardial( pericarditis, pericardial effusion ),
ischaemic ( infarction, coronary insufficiency)
 2º abnormality- venticular hypertrophy, bbb,
wpw syndrome
THE INTERVALS
 P-R interval
 Q-T interval
P-R INTERVAL
 From onset of P wave to beginning of QRS
complex.
 Normal PR interval – 0.12 – 0.20 sec
ABNORMALITIES OF PR INTERVAL
 Prolonged PR interval >0.20 sec
Indicates increased AV nodal conduction
delay
or 1st degree AV block.
Causes- vagal domination in athelets, ARF,
CAD,
drugs acting on av node eg digitalis, CCBs
 Reduced PR interval
 Causes- AV nodal or junctional rhthym, wpw
syndrome with pre-excitation
 Variable PR interval
 causes- type 1 , 2nd degree av block,
complete av block, wandering pacemaker
rhtyhm
AXIS DEVIATION
 Right axis deviation
 Left axis deviation
RIGHT VENTRICULAR HYPERTROPY
 Criteria for diagnosis
 R wave in V1 :> 4mm
 R:S in V1:>1
 S wave in V6 >7mm
 R in V1+ S in V6: >10 mm
CAUSES OF RVH
Pulmonitary HTN
Congenital heart disease
Chronic cor pulmonale
Pulmonary valve stenosis
Isolated congenital PS
PS of TOF
LEFT VENTRICULAR HYPERTROPHY
 Voltage criteria
 S in V1 or V2+ R in V5 or V6 >35 mm
(sokolow)
 R in V5+V6>25 mm; R in aVL >11 mm
(framingham)
 S in V3+ R in aVL >28 mm (men ), >20mm
(women ) (cornell)
CAUSES OF LEFT VENTRICULAR HYPERTROPHY
 Systolic LV overload- systemic HTN, AS
(valvular, subvalvular), coarction of aorta,
HOCM
 Diastolic LV overload –AR, MR,VSD,PDA
NON INVASIVE CARDIAC IMAGING
 Echocardiography
 Nuclear cardiology
 MRI/CT imaging
ECHOCARDIOGRAPHY
 Types
 2D
 Doppler
 Stress
 Transesophageal
2D ECHOCARDIOGRAPHY
 Principle-ultrasound reflection off cardiac
structures to produce images of heart.
 For TTE (transthoracic ) echocardiogram,
imaging is performed with a handheld
transducer placed directly on chest wall
 Advantage – instantaneous images of
cardiac structures is obtained for
interpretation
 Ideal for cardiac emergencies.
 Useful in
 LV hypertrophy
 Hypertropic cardiomyopathy
 Valve abnormalities – gold standard . ex- MS
 Pericardial disease – modality of choice for
pericardial effusion.
 Intracardiac masses. Appear as echo dense
strutures.
DOPPLER ECHOCARDIOGRAPHY
 Principle:uses ultrasound reflecting off
moving rbc to measure the velocity of blood
flow across valves, with cardiac chambers
and through great vessels.
 Different color indicates different direction of
blood flow
 Red towards and blue away from transducer
with green superimposed when there is
turbulent flow.
 Modified Bernoulli equation:
 Pressure change=4 times (velocity)²
 High velocity of blood flow directed along the
line of doppler beam is measured such as in
valve stenosis, valve regurgitation, or
intracardiac shunts.
 These high velocities are used to determine
intracardiac pressure gradients
STRESS ECHOCARDIOGRAM
 2D and Doppler are usually performed with
patient in resting state. Further information
can be obtained by reimaging during either
exercise or pharmacologic stress.
 Indications – confirm suspicion of IHD and
determine extent of ischaemia.
 Exercise testing done using either upright
treadmill or bicycle, pharmacologic testing by
infusion of dobutamine.
TRANSESOPHAGEAL ECHOCARDIOGRAM
 Used when limited information is obtained
from TTE, TEE is useful.
 Used for
 Diseases of aorta- aortic dissection
 Atrial thrombi
 Patent foramen ovale
 Presence of vegetations in infective
endocarditis
NUCLEAR CARDIOLOGY
 Nuclear (or radionuclide ) imaging requires iv
administration of radiopharmaceuticals (
isotopes or tracers )
 Once injected , isotope traces physiologic
process and undergoes uptake in specific
organs. Radiation is emitted in form of
photons, generally gamma rays.
 Special camera detects these photons and
creates images via computer interface
 Most commonly used technologies are
 1. SPECT (single photon emission computed
tomography )
 2. PET ( positron emission tomography )
 Both differ in intrumentation, acquisition,
resolution and nuclides used.
MRI IMAGING
 Principle- based on magnetic properties of
hydrogen nuclei.
 Larger vessels can be visualised on mri
without contrast agents, gadolinium is
frequently employed as contrast agent to
produce magnetic resonance angiograms.
 Both static and cine images can usually be
obtained using electrocardiographic
triggering, often within short breadth holds of
10-15secs.
 MRI is of great value in defining anatomic
relationships in patients with complex
congenital heart disease and
cardiomyopathies
CT SCAN
 Fast simple, noninvasive technique that provide
images of myocardium and great vessels with
excellent spatial resolution and good soft tissue
contrast.
 Important clinical applications
 Pericardial calcification
 Cardiac masses, particularly those containing
fat or calcium.
 Suspected arrhythmogenic right ventricular
dysplasia
 Suspected pulmonary embolism –
examination of choice.
 Aortic dissetion
INVASIVE CARDIAC IMAGING
 Types:
 Cardiac catheterization
 Coronary angiography
 Both are indicated to evaluate the extent and
severity of cardiac disease in symptomatic
patients and to determine if medical, surgical,
or catheter based interventions are
warranted
.
TECHNIQUES
 Dependent upon patient’s symptoms and clinical
condition with some direction provided by
noninvasive studies.
 Vascular access- percutaneous technique used
to enter femoral artery and vein as the preferred
access site for left and right heart
catherterization , respectively.
 Flexible sheath is inserted into vessel over a
guidewire, allowing diagnostic catheters to be
introduced into vessel and advance towards
heart using fluroscopic guidance.
 Other blood vessels being used are-
 Brachial or radial artery-
 (normal allen’s test confirming dual blood
supply to hand from radial and ulnar arteries
is prerequisite to access this site.
 Hemodynamics –shape and magnitude of
pressure wave forms provides important
diagnostic information.
 In absence of valvular heart disease, atria
and ventricles are “one chamber” during
diastole when tricuspid and mitral valves are
open while in systole when pulmonary and
aortic valves are open, ventricles and their
respective outflow tracts are considered “one
chamber”.
 When aortic stenosis is present , there is
systolic pressure gradient between left
ventricle and aorta.
THANK YOU !!!

cardiovascular system-diagnostic tools

  • 1.
    DIAGNOSTIC TOOL BY KAPIL MOHAN 7THBATCH,INTERN JMCTH CVS
  • 2.
    TYPES 1. Ecg 2. Noninvasive cardiac imaging a. echocardiography b. nuclear cardiology c. mri/ct imaging 3. Diagnostic cardiac catheterization & Coronary angiography
  • 3.
    ECG/EKG Graphical recording ofelectric potentials generated by heart, signals detected by means of metal electrodes attached to extremities and chest wall. Clinincal utility: Immediate, noninvasive, inexpensive, highly versatile test
  • 4.
    ECG LEADS 12 conventionalECG leads are there divided into two groups : 6 limb leads (extremity) 6 chest leads ( precordial ) Limb leads record potentials transmitted onto frontal plane and chest leads record potentials transmitted onto horizontal plane.
  • 7.
     Ecg leadsare configured so that +ive(upright) deflection is recorded if wave of depolarisation spreads towards postive pole of lead and –ive deflection is recorded if wave spreads towards negative pole.
  • 8.
    EINTHOVEN TRIANGLE  The3 standard limb leads form an equilateral triangle at centre of heart.
  • 9.
    GENESIS OF ECG P wave  QRS complex  T wave  U wave
  • 12.
    RHYTHM OF HEART Normal rhythm is sinus rhythm.  Cardiac pacemaker: SA node (60-100 bpm)  Other potenial pacemakers are known as ectopic or subsidary pacemakers  atrial/junctional pacemaker- 40-60bpm  Ventricular pacemaker:20-40bpm
  • 13.
    IRREGULARITY Regeularly irregular- prematurebeats during any rhtyhm , bigeminal rhythm Irregularly irregular – atrial fibrillation( disrete p waves of sinus rhythm are replaced by numerous, small fibrillating waves. Ventricular fibrillation- rapid small deformed deflections
  • 14.
    R-R INTERVAL- HEARTRATE  Heart rate- number of heart beats / min.  In ECG- number of cardiac cycles occuring during a 60 sec continuos recording of ecg.  Method: 300/ no. of large squares between two R waves.
  • 15.
    P WAVE  Producedby atrial depolarisation  Normally upright in most of ecg leads except avR ( dirction of atrial activation is away from this lead )  Height : < 0. 25 mv  width : < 0.10 sec
  • 16.
    ABNORMALITIES OF PWAVE  Absent atrial fibrillation atrial flutter( saw toothed apperance of baseline) venticular tacycardia Hyperkalemia  Broad p wave left atrial enlargement >0.10 sec
  • 17.
     Inverted pwave junctional rhythm by pass tract  Tall p wave right atrial enlagement p pulmonale (pulmonary hypertension) p congenitale ( congenital heart disease )
  • 18.
    QRS COMPLEX  Producedby ventricular depolarisation, r wave is positive while q and s waves are negative  Q wave – seen in L1, aVL, V5, V6 (physiological) width:<0.04sec, depth <25%of R wave pathological q wave due to necrosis of heart muscle or MI and criteria is ≥0.04 sec , >1/4 of R wave, +nt in other leads than in those with
  • 19.
     R wave: almost all the leads except aVR. Gradually increases as we move from V1 to V6(V1 ≤0.4 mV ; V6 ≤2.5 mV) Abnormalities : tall R wave In V1 lead: rvh, rbbb, wpw syndrome, true posterior wall infarction In V6: lvh, lbbb
  • 20.
    S WAVE  Negativedeflection that follows R wave.  Normally greater than R wave in V1: smaller than R wave in V6
  • 21.
    ABNORMAL QRS COMPLEX Normal width : 0.04 sec to 0.08 sec  >0.08 sec  Bundle branch block: rbbb, lbbb  Intraventricular conduction defect: antiarrhythmic drugs eg amiodarone, electroltye imbalance eg hyperkalemia, myocardial disease eg myocarditis
  • 22.
     Ventricular preexcitation: wpw syndrome, lgl syndrome  Wide QRS arrhythmias :atrial fibrillation with VT
  • 23.
    T WAVE Produced byventricular depolarisation Normally upright in most leads . Inverted in aVR along with inversion of P wave and QRS complex Also in lead V1, V2, V3, L3 Amplitude : ≤5mm in limb leads; ≤ 10mm in precordial leads.
  • 24.
     Abnormalities ofT wave  Inverted T wave : physiological- heavy metals, smoking, anxiety, tachycardia, hyperventilation extracardiac causes- systemic ( shock, haemorrhage), cranial (CVA) , abdominal (pancreatitis, cholecystitis), respi ( pulmonary embolism ), endocrine ( hypothyroidism)
  • 25.
     Specific causes- 1º abnormality- pharmacological (digitalis),metabolic(cardiomyopathy), pericardial( pericarditis, pericardial effusion ), ischaemic ( infarction, coronary insufficiency)  2º abnormality- venticular hypertrophy, bbb, wpw syndrome
  • 26.
    THE INTERVALS  P-Rinterval  Q-T interval
  • 27.
    P-R INTERVAL  Fromonset of P wave to beginning of QRS complex.  Normal PR interval – 0.12 – 0.20 sec
  • 28.
    ABNORMALITIES OF PRINTERVAL  Prolonged PR interval >0.20 sec Indicates increased AV nodal conduction delay or 1st degree AV block. Causes- vagal domination in athelets, ARF, CAD, drugs acting on av node eg digitalis, CCBs
  • 29.
     Reduced PRinterval  Causes- AV nodal or junctional rhthym, wpw syndrome with pre-excitation  Variable PR interval  causes- type 1 , 2nd degree av block, complete av block, wandering pacemaker rhtyhm
  • 30.
    AXIS DEVIATION  Rightaxis deviation  Left axis deviation
  • 31.
    RIGHT VENTRICULAR HYPERTROPY Criteria for diagnosis  R wave in V1 :> 4mm  R:S in V1:>1  S wave in V6 >7mm  R in V1+ S in V6: >10 mm
  • 32.
    CAUSES OF RVH PulmonitaryHTN Congenital heart disease Chronic cor pulmonale Pulmonary valve stenosis Isolated congenital PS PS of TOF
  • 33.
    LEFT VENTRICULAR HYPERTROPHY Voltage criteria  S in V1 or V2+ R in V5 or V6 >35 mm (sokolow)  R in V5+V6>25 mm; R in aVL >11 mm (framingham)  S in V3+ R in aVL >28 mm (men ), >20mm (women ) (cornell)
  • 34.
    CAUSES OF LEFTVENTRICULAR HYPERTROPHY  Systolic LV overload- systemic HTN, AS (valvular, subvalvular), coarction of aorta, HOCM  Diastolic LV overload –AR, MR,VSD,PDA
  • 35.
    NON INVASIVE CARDIACIMAGING  Echocardiography  Nuclear cardiology  MRI/CT imaging
  • 36.
    ECHOCARDIOGRAPHY  Types  2D Doppler  Stress  Transesophageal
  • 38.
    2D ECHOCARDIOGRAPHY  Principle-ultrasoundreflection off cardiac structures to produce images of heart.  For TTE (transthoracic ) echocardiogram, imaging is performed with a handheld transducer placed directly on chest wall  Advantage – instantaneous images of cardiac structures is obtained for interpretation  Ideal for cardiac emergencies.
  • 40.
     Useful in LV hypertrophy  Hypertropic cardiomyopathy  Valve abnormalities – gold standard . ex- MS  Pericardial disease – modality of choice for pericardial effusion.  Intracardiac masses. Appear as echo dense strutures.
  • 41.
    DOPPLER ECHOCARDIOGRAPHY  Principle:usesultrasound reflecting off moving rbc to measure the velocity of blood flow across valves, with cardiac chambers and through great vessels.  Different color indicates different direction of blood flow  Red towards and blue away from transducer with green superimposed when there is turbulent flow.
  • 42.
     Modified Bernoulliequation:  Pressure change=4 times (velocity)²  High velocity of blood flow directed along the line of doppler beam is measured such as in valve stenosis, valve regurgitation, or intracardiac shunts.  These high velocities are used to determine intracardiac pressure gradients
  • 44.
    STRESS ECHOCARDIOGRAM  2Dand Doppler are usually performed with patient in resting state. Further information can be obtained by reimaging during either exercise or pharmacologic stress.  Indications – confirm suspicion of IHD and determine extent of ischaemia.  Exercise testing done using either upright treadmill or bicycle, pharmacologic testing by infusion of dobutamine.
  • 46.
    TRANSESOPHAGEAL ECHOCARDIOGRAM  Usedwhen limited information is obtained from TTE, TEE is useful.  Used for  Diseases of aorta- aortic dissection  Atrial thrombi  Patent foramen ovale  Presence of vegetations in infective endocarditis
  • 47.
    NUCLEAR CARDIOLOGY  Nuclear(or radionuclide ) imaging requires iv administration of radiopharmaceuticals ( isotopes or tracers )  Once injected , isotope traces physiologic process and undergoes uptake in specific organs. Radiation is emitted in form of photons, generally gamma rays.  Special camera detects these photons and creates images via computer interface
  • 48.
     Most commonlyused technologies are  1. SPECT (single photon emission computed tomography )  2. PET ( positron emission tomography )  Both differ in intrumentation, acquisition, resolution and nuclides used.
  • 50.
    MRI IMAGING  Principle-based on magnetic properties of hydrogen nuclei.  Larger vessels can be visualised on mri without contrast agents, gadolinium is frequently employed as contrast agent to produce magnetic resonance angiograms.  Both static and cine images can usually be obtained using electrocardiographic triggering, often within short breadth holds of 10-15secs.
  • 51.
     MRI isof great value in defining anatomic relationships in patients with complex congenital heart disease and cardiomyopathies
  • 53.
    CT SCAN  Fastsimple, noninvasive technique that provide images of myocardium and great vessels with excellent spatial resolution and good soft tissue contrast.  Important clinical applications  Pericardial calcification  Cardiac masses, particularly those containing fat or calcium.  Suspected arrhythmogenic right ventricular dysplasia
  • 54.
     Suspected pulmonaryembolism – examination of choice.  Aortic dissetion
  • 56.
    INVASIVE CARDIAC IMAGING Types:  Cardiac catheterization  Coronary angiography  Both are indicated to evaluate the extent and severity of cardiac disease in symptomatic patients and to determine if medical, surgical, or catheter based interventions are warranted
  • 57.
  • 58.
    TECHNIQUES  Dependent uponpatient’s symptoms and clinical condition with some direction provided by noninvasive studies.  Vascular access- percutaneous technique used to enter femoral artery and vein as the preferred access site for left and right heart catherterization , respectively.  Flexible sheath is inserted into vessel over a guidewire, allowing diagnostic catheters to be introduced into vessel and advance towards heart using fluroscopic guidance.
  • 59.
     Other bloodvessels being used are-  Brachial or radial artery-  (normal allen’s test confirming dual blood supply to hand from radial and ulnar arteries is prerequisite to access this site.
  • 60.
     Hemodynamics –shapeand magnitude of pressure wave forms provides important diagnostic information.  In absence of valvular heart disease, atria and ventricles are “one chamber” during diastole when tricuspid and mitral valves are open while in systole when pulmonary and aortic valves are open, ventricles and their respective outflow tracts are considered “one chamber”.
  • 61.
     When aorticstenosis is present , there is systolic pressure gradient between left ventricle and aorta.
  • 64.