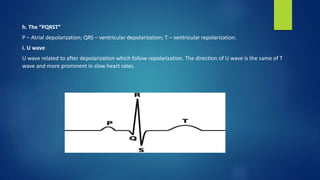
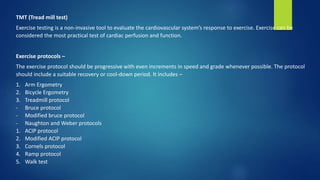
Cardiac diagnostic and laboratory
tests
Dr. Rima Das.
B.A.M.S. (Mum); PGDEMS (Pune); DACLS, DIHM, DDM (Pune);
FPC (M.U.H.S; Nashik).
Consulting Preventive Cardiologist.
1
I. ECG (Electrocardiogram)
The electrocardiogram (ECG) is a representation of the electrical events of the cardiac cycle. Each event has a distinctive
waveform, the study of waveform can lead to greater insight into a patient’s cardiac pathophysiology.
Clinical interpretation of the ECG: The following points should be analysed carefully in every ECG
a. Standardization
Look for the vertical mark and see that the mark exactly covers two big squares (10 mm or 1mV) on the graph. Standard
calibration is 25 mm/s.
b. Rhythm
Rhythm strip should be evaluated for regular or irregular rhythm, presence of P wave before every QRS complex and for
any abnormal beats.
c. Heart rate
The heart rate should be calculated by counting the number of ‘big boxes’ between two QRS complexes, and dividing
them with 300 for regular rhythm. For irregular rhythms, count the number of beats present on the ECG during 10
seconds and them multiply by 6.
d. PR interval
The normal PR interval should be 0.12 to 0.20 (3-5 small squares). The PR interval shortens in case of Wolff-Parkinson-
White syndrome and increases in first degree AV block.
e. QRS interval
Normal QRS duration is 110-120 msec. Intrinsic impairment of conduction in either the right or the left bundle system
leads to prolongation of the QRS interval. With complete bundle branch blocks, the QRS interval exceeds 120 msec in
duration.
f. QT interval
The QT interval is measured in lead aVL as this lead does not have prominent U waves. It includes the total duration of
ventricular activation and recovery. The upper normal limit be set at 450 – 460 msec. QT interval is prolonged during
sleep, hypocalcaemia, acute myocarditis, acute myocardial injury, etc; and is shortened due to digitalis effect,
hypercalcaemia, hyperthermia and vagal stimulation.
g. QRS Axis
The QRS axis represents overall direction of the heart’s electrical activity. Abnormalities hint at ventricular enlargement
and conduction blocks.
h. The “PQRST”
P – Atrial depolarization; QRS – ventricular depolarization; T – ventricular repolarization.
i. U wave
U wave related to after depolarization which follow repolarization. The direction of U wave is the same of T
wave and more prominent in slow heart rates.
TMT (Tread mill test)
Exercise testing is a non-invasive tool to evaluate the cardiovascular system’s response to exercise. Exercise can be
considered the most practical test of cardiac perfusion and function.
Exercise protocols –
The exercise protocol should be progressive with even increments in speed and grade whenever possible. The protocol
should include a suitable recovery or cool-down period. It includes –
1. Arm Ergometry
2. Bicycle Ergometry
3. Treadmill protocol
- Bruce protocol
- Modified bruce protocol
- Naughton and Weber protocols
1. ACIP protocol
2. Modified ACIP protocol
3. Cornels protocol
4. Ramp protocol
5. Walk test
Absolute contraindications to exercise testing –
- Acute myocardial infarction
- High-risk unstable angina
- Decompensated heart failure
- Advanced AV block
- Severe symptomatic aortic stenosis
- Severe hypertrophic obstructive cardiomyopathy
- Uncontrolled hypertension
- Acute systemic illness
Interpreting TMT
1. ECG interpretation
a. ST segment displacement – Exercise induced ST segment elevation is relatively specific for the territory of
myocardial ischemia and the coronary artery involved.
b. Upsloping ST segment – The importance of this finding is in asymptomatic individuals or those with a low CAD
prevalence.
c. ST segment elevation – Without pathological Q waves, exercise induced ST segment elevation usually indicates
either significant proximal coronary stenosis or epicardial coronary spasm and with pathological Q waves,
exercise induced ST segment elevation usually indicative of a left ventricular aneurysm or significant wall motion
changes.
d. T wave changes – This finding may be a marker for myocardial ischemia in a patient with documented CAD.
e. Arrythmias – Exercise testing induced supraventricular arrhythmias are relatively rare and appear to be benign
except for their association with the development of AF in the future.
2. Non electrographic observations
a. Blood pressure – A significant change in diastolic blood pressure, failure to increase systolic blood pressure
beyond 120 mmHg or fall in systolic blood pressure below standing resting values during progressive exercise
then it reflects inadequate elevation of cardiac output because of left ventricular systolic pump dysfunction or
an excessive reduction in systemic vascular resistance.
b. Heart rate response – An inappropriate increase in heart rate may occur in patients who are in atrial fibrillation,
physically deconditioned, hypovolemic or anaemic. When the heart rate fails to increase appropriately with
exercise, it is associated with an adverse prognosis, it reflects the inability to use up all the heart rate reserve.
c. Chest discomfort – Chest discomfort may be the only signal that obstructive CAD is present.
III. Echocardiography
- Echocardiography (echo or echocardiogram) is a type of ultrasound test that uses high pitched sound waves
to produce an image of the heart.
- The sound waves are sent through a device called a transducer and are reflected off the various structures of
the heart. These echoes are converted into pictures of the heart that can be seen on a video monitor. There
is no special preparation for the test.
- Ultrasound gel is applied to the transducer to allow transmission of the sound waves from the transducer to
the skin
- The transducer transforms the echo (mechanical energy) into an electrical signal which is processed and
displayed as an image on the screen.
- The conversion of sound to electrical energy is called the piezoelectric effect.
Indications –
- Pericardial effusion
- RVH/ LVH or wall motion abnormality or thrombi
- Stenosis or prolapse of valves
- Aortic dissection
- Congenital and traumatic heart diseases
- Hypertension, suspected IHD, murmurs, pulmonary disease
- Arrythmias, palpitations, syncope or neurological disease
Types –
Transthoracic – left parasternal, apical, subcostal, suprasternal
Transoesophageal
Intracardiac
Different views of echocardiogram:
a. Parasternal long-axis view (PLAX)
Most echo studies begin with this view. Structures seen from this view are right ventricle, left ventricle,
ascending aorta, aortic valve, mitral valve, pericardium.
b. Parasternal short-axis view (PSAX)
By tilting transducer on an axis between the left hip and right shoulder the short axis views are obtained.
c. Apical 4-chamber view (AP4CH)
Structures seen from this view are pericardial space, left ventricle, septum, right ventricle, right atrium,
interatrial septum, left atrium.
d. Apical 5-chamber view (AP5CH) – The LVOT can be visualized in this view.
e. Apical 2-chamber view (AP2CH) – This is good for assessment of LV anterior wall and LV inferior
wall.
f. Sub-costal 4 chamber view (SC4CH) – The subject lies supine with head slightly low (no pillow).
With feet on the bed, the knees are slightly elevated. Better images are obtained with the
abdomen relaxed and during inspiration. Structures seen from this view are interatrial septum,
pericardial effusion, descending abdominal aorta.
g. Suprasternal view – The subject lies supine with the neck hyperextended. The head is rotated
slightly towards the left. The arch of aorta is visualized in this view.
The modalities of Echo – The following modalities of echo are used clinically:
1. Conventional echo
- Two-Dimensional echo (2-D echo)
- Motion-mode echo (M-mode echo)
2. Doppler echo
- Continuous wave (CW) doppler
- Pulsed wave (PW) doppler
- Colour flow (CF) doppler
All modalities follow the same principle of ultrasound, differ in how reflected sound waves are
collected and analysed.
Holter monitoring:
• A Holter monitor is a small, wearable device that keeps track of heart rhythm.
• A Holter monitor uses electrodes and a recording device to track heart’s rhythm for 24 to 72 hours.
• Holter monitor testing is also sometimes called ambulatory electrocardiograph.
• Several leads, or wires, are attached to the monitor. The leads connect to electrodes that are placed on
the skin of chest with a glue-like gel.
• The metal electrodes conduct heart’s activity through the wires and into the Holter monitor, where it’s
recorded.
Findings to look –
Heart rate variability
Bradycardia events
Ectopic beat/ narrow complex/ broad complex premature beats/ couplets/ triplets/ VT/ SVT episodes/ pauses
ST-T changes
QTc QT analysis
Rhythm strips
Sleep apnea 24 hours trend.
Cardiac catheterization:
• Cardiac catheterization is one of the invasive procedures used to visualize the heart’s chambers, valves and great
vessels in order to diagnose and treat disease related to abnormalities of the coronary arteries.
• The procedure involves inserting a long, flexible, radiopaque catheter into a peripheral vein peripheral artery and
guiding it under fluoroscopy (x-ray observation) or angiography.
Indications:
• Confirm suspected heart disease, including coronary artery disease, myocardial disease, valvular disease and valvular
dysfunction.
• To determine the location and extent of the disease process
• To asses the following:
- Stable, severe angina unresponsive to medical management
- Uncontrolled heart failure, ventricular dys-arrhymias, or cardiogenic shock associated with acute myocardial
infarction, papillary muscle dysfunction, ventricular aneurysm or septal perforation.
• To determine best therapeutic option (percutaneous transluminal coronary angioplasty, stents, coronary artery
bypass graft, valvulotomy versus valve replacement)
• To evaluate effects of medical or invasive treatment on cardiovascular function, percutaneous transluminal coronary
angioplasty, or coronary artery bypass graft patency.
Cardiac computerized tomography (CT) scan:
Cardiac CT is a noninvasive imaging modality for coronary artery and cardiac structural and functional evaluation.
Indications:
• Exclusion of CAD (Coronary artery disease)
• Suspicion of coronary artery anomalies
• Assessment of anatomy in complex congenital heart disease
• Assessment of CABG (Coronary artery bypass graft)
• Assessment of coronary artery stents
• Evaluation of aortic disease
• Evaluation of PAD (Peripheral artery disease)
• Evaluation of suspected pulmonary embolism
• Pulmonary vein evaluation
• Preoperative coronary assessment
• Complimentary to coronary cath
• Evaluation of chest pain
• Evaluation of cardiac masses and pericardial disease
• Evaluation of cardiac structure and function
• Assessment of TAVI (Transcatheter aortic valve replacement)
Contraindications:
Absolute contraindications –
• Renal insufficiency
• Known history of anaphylactic contrast reactions
• Pregnancy
• Clinical instability
Relative contraindications –
• Contrast allergy
• Uncontrolled hyperthyroidism
• Inability to hold breath for at least 10 seconds
• Morbid obesity
• Severe coronary calcium
• Metallic interference like pacemaker
Cardiac magnetic resonance imaging (MRI):
Cardiovascular magnetic resonance imaging is a medical imaging technology for non-invasive assessment of the
function and structure of the cardiovascular system.
Indications:
• Ischemic heart disease
- Myocardial viability
- Myocardial perfusion
- Bypass graft patency
- Ventricular function/ volume/ mass/ ejection fraction
• Congenital heart disease
• Pericardial diseases
• Cardiomyopathy
• Valvular heart disease
• Cardiac and extra cardiac masses
• Aortic vascular diseases
Advantages:
High soft tissue contrast
Lack of ionizing radiation
Non-invasiveness
Wide range of cardiovascular applications
Anatomic and functional diagnosis
Relative Contraindications:
Permanent pacemakers and automated implantable cardiac defibrillators (AICDs)
Haemodynamic support devices like intra-aortic balloon pumps.
Main limitation of CMRI compared to CT is the evaluation of coronary calcifications.
Lipid panel
Components Values
Total cholesterol Under 200 mg/ dl
HDL Men: 35 to 65 mg/ dl
Women: 35 to 80 mg/ dl
LDL Less than 100 mg/ dl
People with heart disease or diabetes or poorly controlled risk
factors: Less than 70 mg/ dl
Triglycerides Less than 150 mg/ dl
Heart failure:
Thank you!
23

Cardiac diagnostics and laboratory tests

  • 1.
    Cardiac diagnostic andlaboratory tests Dr. Rima Das. B.A.M.S. (Mum); PGDEMS (Pune); DACLS, DIHM, DDM (Pune); FPC (M.U.H.S; Nashik). Consulting Preventive Cardiologist. 1
  • 2.
    I. ECG (Electrocardiogram) Theelectrocardiogram (ECG) is a representation of the electrical events of the cardiac cycle. Each event has a distinctive waveform, the study of waveform can lead to greater insight into a patient’s cardiac pathophysiology. Clinical interpretation of the ECG: The following points should be analysed carefully in every ECG a. Standardization Look for the vertical mark and see that the mark exactly covers two big squares (10 mm or 1mV) on the graph. Standard calibration is 25 mm/s. b. Rhythm Rhythm strip should be evaluated for regular or irregular rhythm, presence of P wave before every QRS complex and for any abnormal beats. c. Heart rate The heart rate should be calculated by counting the number of ‘big boxes’ between two QRS complexes, and dividing them with 300 for regular rhythm. For irregular rhythms, count the number of beats present on the ECG during 10 seconds and them multiply by 6.
  • 3.
    d. PR interval Thenormal PR interval should be 0.12 to 0.20 (3-5 small squares). The PR interval shortens in case of Wolff-Parkinson- White syndrome and increases in first degree AV block. e. QRS interval Normal QRS duration is 110-120 msec. Intrinsic impairment of conduction in either the right or the left bundle system leads to prolongation of the QRS interval. With complete bundle branch blocks, the QRS interval exceeds 120 msec in duration. f. QT interval The QT interval is measured in lead aVL as this lead does not have prominent U waves. It includes the total duration of ventricular activation and recovery. The upper normal limit be set at 450 – 460 msec. QT interval is prolonged during sleep, hypocalcaemia, acute myocarditis, acute myocardial injury, etc; and is shortened due to digitalis effect, hypercalcaemia, hyperthermia and vagal stimulation. g. QRS Axis The QRS axis represents overall direction of the heart’s electrical activity. Abnormalities hint at ventricular enlargement and conduction blocks.
  • 4.
    h. The “PQRST” P– Atrial depolarization; QRS – ventricular depolarization; T – ventricular repolarization. i. U wave U wave related to after depolarization which follow repolarization. The direction of U wave is the same of T wave and more prominent in slow heart rates.
  • 5.
    TMT (Tread milltest) Exercise testing is a non-invasive tool to evaluate the cardiovascular system’s response to exercise. Exercise can be considered the most practical test of cardiac perfusion and function. Exercise protocols – The exercise protocol should be progressive with even increments in speed and grade whenever possible. The protocol should include a suitable recovery or cool-down period. It includes – 1. Arm Ergometry 2. Bicycle Ergometry 3. Treadmill protocol - Bruce protocol - Modified bruce protocol - Naughton and Weber protocols 1. ACIP protocol 2. Modified ACIP protocol 3. Cornels protocol 4. Ramp protocol 5. Walk test
  • 6.
    Absolute contraindications toexercise testing – - Acute myocardial infarction - High-risk unstable angina - Decompensated heart failure - Advanced AV block - Severe symptomatic aortic stenosis - Severe hypertrophic obstructive cardiomyopathy - Uncontrolled hypertension - Acute systemic illness
  • 7.
    Interpreting TMT 1. ECGinterpretation a. ST segment displacement – Exercise induced ST segment elevation is relatively specific for the territory of myocardial ischemia and the coronary artery involved. b. Upsloping ST segment – The importance of this finding is in asymptomatic individuals or those with a low CAD prevalence. c. ST segment elevation – Without pathological Q waves, exercise induced ST segment elevation usually indicates either significant proximal coronary stenosis or epicardial coronary spasm and with pathological Q waves, exercise induced ST segment elevation usually indicative of a left ventricular aneurysm or significant wall motion changes. d. T wave changes – This finding may be a marker for myocardial ischemia in a patient with documented CAD. e. Arrythmias – Exercise testing induced supraventricular arrhythmias are relatively rare and appear to be benign except for their association with the development of AF in the future.
  • 8.
    2. Non electrographicobservations a. Blood pressure – A significant change in diastolic blood pressure, failure to increase systolic blood pressure beyond 120 mmHg or fall in systolic blood pressure below standing resting values during progressive exercise then it reflects inadequate elevation of cardiac output because of left ventricular systolic pump dysfunction or an excessive reduction in systemic vascular resistance. b. Heart rate response – An inappropriate increase in heart rate may occur in patients who are in atrial fibrillation, physically deconditioned, hypovolemic or anaemic. When the heart rate fails to increase appropriately with exercise, it is associated with an adverse prognosis, it reflects the inability to use up all the heart rate reserve. c. Chest discomfort – Chest discomfort may be the only signal that obstructive CAD is present.
  • 9.
    III. Echocardiography - Echocardiography(echo or echocardiogram) is a type of ultrasound test that uses high pitched sound waves to produce an image of the heart. - The sound waves are sent through a device called a transducer and are reflected off the various structures of the heart. These echoes are converted into pictures of the heart that can be seen on a video monitor. There is no special preparation for the test. - Ultrasound gel is applied to the transducer to allow transmission of the sound waves from the transducer to the skin - The transducer transforms the echo (mechanical energy) into an electrical signal which is processed and displayed as an image on the screen. - The conversion of sound to electrical energy is called the piezoelectric effect.
  • 10.
    Indications – - Pericardialeffusion - RVH/ LVH or wall motion abnormality or thrombi - Stenosis or prolapse of valves - Aortic dissection - Congenital and traumatic heart diseases - Hypertension, suspected IHD, murmurs, pulmonary disease - Arrythmias, palpitations, syncope or neurological disease Types – Transthoracic – left parasternal, apical, subcostal, suprasternal Transoesophageal Intracardiac
  • 11.
    Different views ofechocardiogram: a. Parasternal long-axis view (PLAX) Most echo studies begin with this view. Structures seen from this view are right ventricle, left ventricle, ascending aorta, aortic valve, mitral valve, pericardium. b. Parasternal short-axis view (PSAX) By tilting transducer on an axis between the left hip and right shoulder the short axis views are obtained. c. Apical 4-chamber view (AP4CH) Structures seen from this view are pericardial space, left ventricle, septum, right ventricle, right atrium, interatrial septum, left atrium. d. Apical 5-chamber view (AP5CH) – The LVOT can be visualized in this view.
  • 12.
    e. Apical 2-chamberview (AP2CH) – This is good for assessment of LV anterior wall and LV inferior wall. f. Sub-costal 4 chamber view (SC4CH) – The subject lies supine with head slightly low (no pillow). With feet on the bed, the knees are slightly elevated. Better images are obtained with the abdomen relaxed and during inspiration. Structures seen from this view are interatrial septum, pericardial effusion, descending abdominal aorta. g. Suprasternal view – The subject lies supine with the neck hyperextended. The head is rotated slightly towards the left. The arch of aorta is visualized in this view.
  • 13.
    The modalities ofEcho – The following modalities of echo are used clinically: 1. Conventional echo - Two-Dimensional echo (2-D echo) - Motion-mode echo (M-mode echo) 2. Doppler echo - Continuous wave (CW) doppler - Pulsed wave (PW) doppler - Colour flow (CF) doppler All modalities follow the same principle of ultrasound, differ in how reflected sound waves are collected and analysed.
  • 14.
    Holter monitoring: • AHolter monitor is a small, wearable device that keeps track of heart rhythm. • A Holter monitor uses electrodes and a recording device to track heart’s rhythm for 24 to 72 hours. • Holter monitor testing is also sometimes called ambulatory electrocardiograph. • Several leads, or wires, are attached to the monitor. The leads connect to electrodes that are placed on the skin of chest with a glue-like gel. • The metal electrodes conduct heart’s activity through the wires and into the Holter monitor, where it’s recorded. Findings to look – Heart rate variability Bradycardia events Ectopic beat/ narrow complex/ broad complex premature beats/ couplets/ triplets/ VT/ SVT episodes/ pauses ST-T changes QTc QT analysis Rhythm strips Sleep apnea 24 hours trend.
  • 15.
    Cardiac catheterization: • Cardiaccatheterization is one of the invasive procedures used to visualize the heart’s chambers, valves and great vessels in order to diagnose and treat disease related to abnormalities of the coronary arteries. • The procedure involves inserting a long, flexible, radiopaque catheter into a peripheral vein peripheral artery and guiding it under fluoroscopy (x-ray observation) or angiography. Indications: • Confirm suspected heart disease, including coronary artery disease, myocardial disease, valvular disease and valvular dysfunction. • To determine the location and extent of the disease process • To asses the following: - Stable, severe angina unresponsive to medical management - Uncontrolled heart failure, ventricular dys-arrhymias, or cardiogenic shock associated with acute myocardial infarction, papillary muscle dysfunction, ventricular aneurysm or septal perforation. • To determine best therapeutic option (percutaneous transluminal coronary angioplasty, stents, coronary artery bypass graft, valvulotomy versus valve replacement) • To evaluate effects of medical or invasive treatment on cardiovascular function, percutaneous transluminal coronary angioplasty, or coronary artery bypass graft patency.
  • 16.
    Cardiac computerized tomography(CT) scan: Cardiac CT is a noninvasive imaging modality for coronary artery and cardiac structural and functional evaluation. Indications: • Exclusion of CAD (Coronary artery disease) • Suspicion of coronary artery anomalies • Assessment of anatomy in complex congenital heart disease • Assessment of CABG (Coronary artery bypass graft) • Assessment of coronary artery stents • Evaluation of aortic disease • Evaluation of PAD (Peripheral artery disease) • Evaluation of suspected pulmonary embolism • Pulmonary vein evaluation • Preoperative coronary assessment • Complimentary to coronary cath • Evaluation of chest pain • Evaluation of cardiac masses and pericardial disease • Evaluation of cardiac structure and function • Assessment of TAVI (Transcatheter aortic valve replacement)
  • 17.
    Contraindications: Absolute contraindications – •Renal insufficiency • Known history of anaphylactic contrast reactions • Pregnancy • Clinical instability Relative contraindications – • Contrast allergy • Uncontrolled hyperthyroidism • Inability to hold breath for at least 10 seconds • Morbid obesity • Severe coronary calcium • Metallic interference like pacemaker
  • 18.
    Cardiac magnetic resonanceimaging (MRI): Cardiovascular magnetic resonance imaging is a medical imaging technology for non-invasive assessment of the function and structure of the cardiovascular system. Indications: • Ischemic heart disease - Myocardial viability - Myocardial perfusion - Bypass graft patency - Ventricular function/ volume/ mass/ ejection fraction • Congenital heart disease • Pericardial diseases • Cardiomyopathy • Valvular heart disease • Cardiac and extra cardiac masses • Aortic vascular diseases
  • 19.
    Advantages: High soft tissuecontrast Lack of ionizing radiation Non-invasiveness Wide range of cardiovascular applications Anatomic and functional diagnosis Relative Contraindications: Permanent pacemakers and automated implantable cardiac defibrillators (AICDs) Haemodynamic support devices like intra-aortic balloon pumps. Main limitation of CMRI compared to CT is the evaluation of coronary calcifications.
  • 21.
    Lipid panel Components Values Totalcholesterol Under 200 mg/ dl HDL Men: 35 to 65 mg/ dl Women: 35 to 80 mg/ dl LDL Less than 100 mg/ dl People with heart disease or diabetes or poorly controlled risk factors: Less than 70 mg/ dl Triglycerides Less than 150 mg/ dl
  • 22.
  • 23.