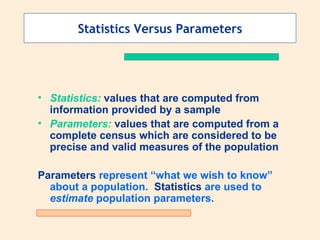
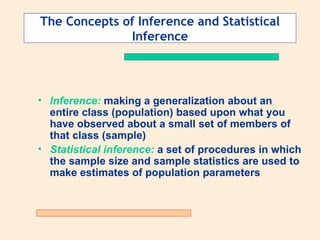
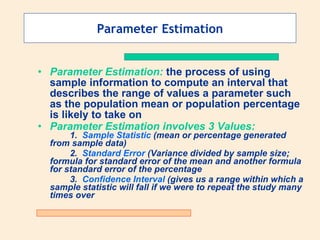
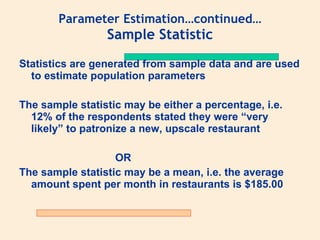
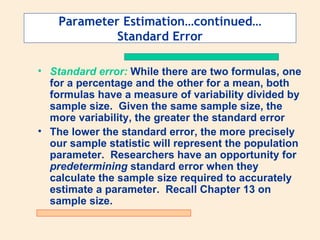
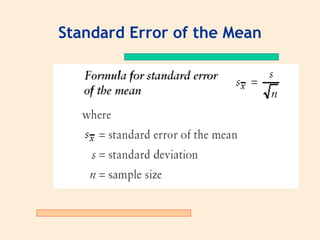
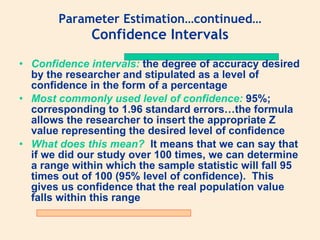
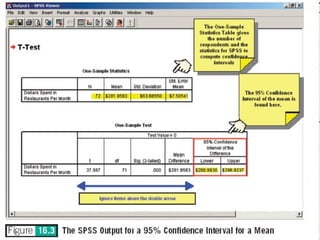
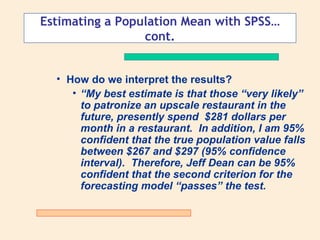
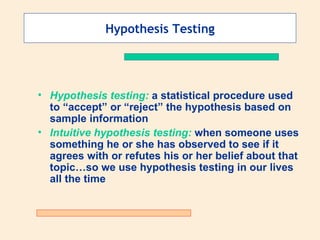
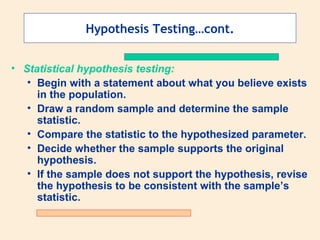
Chapter 16


Generalizing a Sample’s
    Findings to Its
Population and Testing
  Hypotheses About
 Percents and Means
Statistics Versus Parameters


• Statistics: values that are computed from
  information provided by a sample
• Parameters: values that are computed from a
  complete census which are considered to be
  precise and valid measures of the population

Parameters represent “what we wish to know”
  about a population. Statistics are used to
  estimate population parameters.
The Concepts of Inference and Statistical
              Inference


• Inference: making a generalization about an
  entire class (population) based upon what you
  have observed about a small set of members of
  that class (sample)
• Statistical inference: a set of procedures in which
  the sample size and sample statistics are used to
  make estimates of population parameters
Parameter Estimation


• Parameter Estimation: the process of using
  sample information to compute an interval that
  describes the range of values a parameter such
  as the population mean or population percentage
  is likely to take on
• Parameter Estimation involves 3 Values:
       1. Sample Statistic (mean or percentage generated
  from sample data)
       2. Standard Error (Variance divided by sample size;
  formula for standard error of the mean and another formula
  for standard error of the percentage
       3. Confidence Interval (gives us a range within which a
  sample statistic will fall if we were to repeat the study many
  times over
Parameter Estimation…continued…
                 Sample Statistic
Statistics are generated from sample data and are used
  to estimate population parameters

The sample statistic may be either a percentage, i.e.
  12% of the respondents stated they were “very
  likely” to patronize a new, upscale restaurant

                   OR
The sample statistic may be a mean, i.e. the average
  amount spent per month in restaurants is $185.00
Parameter Estimation…continued…
             Standard Error

• Standard error: While there are two formulas, one
  for a percentage and the other for a mean, both
  formulas have a measure of variability divided by
  sample size. Given the same sample size, the
  more variability, the greater the standard error
• The lower the standard error, the more precisely
  our sample statistic will represent the population
  parameter. Researchers have an opportunity for
  predetermining standard error when they
  calculate the sample size required to accurately
  estimate a parameter. Recall Chapter 13 on
  sample size.
Standard Error of the Mean
Standard Error of the Percentage
Parameter Estimation…continued…
              Confidence Intervals
• Confidence intervals: the degree of accuracy desired
  by the researcher and stipulated as a level of
  confidence in the form of a percentage
• Most commonly used level of confidence: 95%;
  corresponding to 1.96 standard errors…the formula
  allows the researcher to insert the appropriate Z
  value representing the desired level of confidence
• What does this mean? It means that we can say that
  if we did our study over 100 times, we can determine
  a range within which the sample statistic will fall 95
  times out of 100 (95% level of confidence). This
  gives us confidence that the real population value
  falls within this range
Parameter Estimation…cont.


• Five steps involved in computing confidence
  intervals for a mean or percentage:
   • Determine the sample statistic.
   • Determine the variability in the sample for that
     statistic.
   • Identify the sample size.
   • Decide on the level of confidence.
   • Perform the computations to determine the
     upper and lower boundaries of the confidence
     interval range.
Estimating a Population Percentage with
                 SPSS


• Suppose we wish to know how accurately the
  sample statistic estimates the percent listening to
  “Rock” music.
   • Our “best estimate” of the population
     percentage parameter is 41.3% prefer “Rock”
     music radio stations (n=400) We run
     FREQUENCIES to learn this
   • But, how accurate is this estimate of the true
     population percentage preferring rock
     stations?
Parameter Estimation Using SPSS:
           Estimating a Percentage
•   Estimating a Percentage: SPSS will not calculate this for a
    percentage. You must run FREQUENCIES to get your sample
    statistic and n size. Then, use   the formula: p + 1.96 Sp
•   AN EXAMPLE: We want to estimate the percentage of the
    population that listens to “rock” radio.
•   Run FREQUENCIES (on RADPROG) and you find that 41.3%
    listen to “Rock” music
•   So, set p=41.3 and then q=58.7, n=400, 95%=1.96, calculate Sp
•   The answer is: 36.5% - 46.1%
•   We are 95% confident that the true % of the population that
    listens to “rock” falls between 36.5% and 46.1% (See p. 468)
Estimating a Population Percentage with
              SPSS…cont.


                 How do we interpret the
                  results?
                  Our best estimate of the
                  population percentage that
                  prefers “rock” radio is 41.3
                  percent, and we are 95
                  percent confident that the
                  true population value is
                  between 36.5 and 46.1
                  percent.
Parameter Estimation Using SPSS:
           Estimating a Mean
• SPSS will calculate a confidence interval around a
  mean sample statistic
• From the Hobbit’s Choice data assume:
We want to know how much those who stated “Very
  Likely” to patronize an upscale restaurant spend in
  restaurants per month. (See page 469)
• We must first use DATA, SELECT CASES to select:
                     LIKELY=5
• Then we run ANALYZE, COMPARE MEANS, ONE
  SAMPLE T TEST
Note: You should only run this test when you have
  interval or ratio data
Estimating a Population Mean with SPSS…
                 cont.


  • How do we interpret the results?
     • “My best estimate is that those “very likely”
       to patronize an upscale restaurant in the
       future, presently spend $281 dollars per
       month in a restaurant. In addition, I am 95%
       confident that the true population value falls
       between $267 and $297 (95% confidence
       interval). Therefore, Jeff Dean can be 95%
       confident that the second criterion for the
       forecasting model “passes” the test.
Hypothesis Testing


• Hypothesis testing: a statistical procedure used
  to “accept” or “reject” the hypothesis based on
  sample information
• Intuitive hypothesis testing: when someone uses
  something he or she has observed to see if it
  agrees with or refutes his or her belief about that
  topic…so we use hypothesis testing in our lives
  all the time
Hypothesis Testing…cont.


• Statistical hypothesis testing:
   • Begin with a statement about what you believe exists
     in the population.
   • Draw a random sample and determine the sample
     statistic.
   • Compare the statistic to the hypothesized parameter.
   • Decide whether the sample supports the original
     hypothesis.
   • If the sample does not support the hypothesis, revise
     the hypothesis to be consistent with the sample’s
     statistic.
Hypothesis Testing…cont.


• Non-Directional hypotheses: hypotheses that do
  not indicate a direction (greater than or less than)
  of a hypothesized value. Rather, non-directional
  hypotheses state that the hypothesized value is
  “equal to X.” “Customers expect an entrée to
  cost $18.”
• Directional hypotheses: hypotheses that indicate
  the direction in which you believe the population
  parameter falls relative to some target mean or
  percentage…”Customers expect an entrée to cost
  more than $18.”
The Logic of Hypothesis Testing:
  For Non-directional hypotheses

• IF we ASSUME that the hypothesized value is indeed the
  population parameter, then
• 95% of all sample means (or %) drawn from a distribution of
  sample means (or %) having the value of the parameter
  will…
• Fall within + or – 1.96 z scores.
• Therefore, if our formula calculates a z score between + or
  – 1.96, it is likely (95%) that our sample statistic was drawn
  from a distribution of sample means (or %) around the
  population parameter we have hypothesized. We accept
  the hypothesis.
Testing a Hypothesis of a Mean


• Example in Text: Rex Reigen hypothesizes
  that college interns make $2,800 in
  commissions. A survey shows $2,750.
  Does the survey sample statistic support or
  fail to support Rex’s hypothesis? (page
  476).
Since 1.43z falls between -1.96z and +1.96 z, we
             ACCEPT the hypothesis
The probability that our sample mean of $2,800 came from a
distribution of means around a population parameter of $2,750
        is 95%. Therefore, we accept Rex’s hypothesis.
How Do We Use SPSS to Test
    Hypotheses About a Percentage?
• SPSS cannot test hypotheses about percentages.
   You must use the formula. See page 474 for an
  example.
How Do We Use SPSS to Test
        Hypotheses About a Mean?
• In the Hobbit’s Choice Case we want to test that
  those stating “Very Likely” to patronize an
  upscale restaurant are willing to pay an average
  of $18 per entrée.
• DATA, SELECT CASES, Likely=5
• ANALYZE, COMPARE MEANS, ONE SAMPLE T
  TEST
• ENTER 18 AS TEST VALUE
• Note: z value is reported as t in SPSS output
What if we had stated the hypothesis as a
           Directional Hypothesis?

• Those stating “Very Likely” to patronize an upscale
  restaurant are willing to pay more than an average of $18
  per entrée.
• Is the sign (- or +) in the hypothesized direction? For “more
  than” hypotheses it should be +, if not, reject
• Since we are working with a direction, we are only
  concerned with one side of the normal distribution.
  Therefore, we need to adjust the critical values. We would
  accept this hypothesis if the z value computed is greater
  than +1.64 (95%).
Burns And Bush Chapter 16

Burns And Bush Chapter 16

  • 1.
    Chapter 16 Generalizing aSample’s Findings to Its Population and Testing Hypotheses About Percents and Means
  • 2.
    Statistics Versus Parameters •Statistics: values that are computed from information provided by a sample • Parameters: values that are computed from a complete census which are considered to be precise and valid measures of the population Parameters represent “what we wish to know” about a population. Statistics are used to estimate population parameters.
  • 3.
    The Concepts ofInference and Statistical Inference • Inference: making a generalization about an entire class (population) based upon what you have observed about a small set of members of that class (sample) • Statistical inference: a set of procedures in which the sample size and sample statistics are used to make estimates of population parameters
  • 4.
    Parameter Estimation • ParameterEstimation: the process of using sample information to compute an interval that describes the range of values a parameter such as the population mean or population percentage is likely to take on • Parameter Estimation involves 3 Values: 1. Sample Statistic (mean or percentage generated from sample data) 2. Standard Error (Variance divided by sample size; formula for standard error of the mean and another formula for standard error of the percentage 3. Confidence Interval (gives us a range within which a sample statistic will fall if we were to repeat the study many times over
  • 5.
    Parameter Estimation…continued… Sample Statistic Statistics are generated from sample data and are used to estimate population parameters The sample statistic may be either a percentage, i.e. 12% of the respondents stated they were “very likely” to patronize a new, upscale restaurant OR The sample statistic may be a mean, i.e. the average amount spent per month in restaurants is $185.00
  • 6.
    Parameter Estimation…continued… Standard Error • Standard error: While there are two formulas, one for a percentage and the other for a mean, both formulas have a measure of variability divided by sample size. Given the same sample size, the more variability, the greater the standard error • The lower the standard error, the more precisely our sample statistic will represent the population parameter. Researchers have an opportunity for predetermining standard error when they calculate the sample size required to accurately estimate a parameter. Recall Chapter 13 on sample size.
  • 7.
  • 8.
    Standard Error ofthe Percentage
  • 9.
    Parameter Estimation…continued… Confidence Intervals • Confidence intervals: the degree of accuracy desired by the researcher and stipulated as a level of confidence in the form of a percentage • Most commonly used level of confidence: 95%; corresponding to 1.96 standard errors…the formula allows the researcher to insert the appropriate Z value representing the desired level of confidence • What does this mean? It means that we can say that if we did our study over 100 times, we can determine a range within which the sample statistic will fall 95 times out of 100 (95% level of confidence). This gives us confidence that the real population value falls within this range
  • 10.
    Parameter Estimation…cont. • Fivesteps involved in computing confidence intervals for a mean or percentage: • Determine the sample statistic. • Determine the variability in the sample for that statistic. • Identify the sample size. • Decide on the level of confidence. • Perform the computations to determine the upper and lower boundaries of the confidence interval range.
  • 11.
    Estimating a PopulationPercentage with SPSS • Suppose we wish to know how accurately the sample statistic estimates the percent listening to “Rock” music. • Our “best estimate” of the population percentage parameter is 41.3% prefer “Rock” music radio stations (n=400) We run FREQUENCIES to learn this • But, how accurate is this estimate of the true population percentage preferring rock stations?
  • 12.
    Parameter Estimation UsingSPSS: Estimating a Percentage • Estimating a Percentage: SPSS will not calculate this for a percentage. You must run FREQUENCIES to get your sample statistic and n size. Then, use the formula: p + 1.96 Sp • AN EXAMPLE: We want to estimate the percentage of the population that listens to “rock” radio. • Run FREQUENCIES (on RADPROG) and you find that 41.3% listen to “Rock” music • So, set p=41.3 and then q=58.7, n=400, 95%=1.96, calculate Sp • The answer is: 36.5% - 46.1% • We are 95% confident that the true % of the population that listens to “rock” falls between 36.5% and 46.1% (See p. 468)
  • 13.
    Estimating a PopulationPercentage with SPSS…cont. How do we interpret the results? Our best estimate of the population percentage that prefers “rock” radio is 41.3 percent, and we are 95 percent confident that the true population value is between 36.5 and 46.1 percent.
  • 14.
    Parameter Estimation UsingSPSS: Estimating a Mean • SPSS will calculate a confidence interval around a mean sample statistic • From the Hobbit’s Choice data assume: We want to know how much those who stated “Very Likely” to patronize an upscale restaurant spend in restaurants per month. (See page 469) • We must first use DATA, SELECT CASES to select: LIKELY=5 • Then we run ANALYZE, COMPARE MEANS, ONE SAMPLE T TEST Note: You should only run this test when you have interval or ratio data
  • 17.
    Estimating a PopulationMean with SPSS… cont. • How do we interpret the results? • “My best estimate is that those “very likely” to patronize an upscale restaurant in the future, presently spend $281 dollars per month in a restaurant. In addition, I am 95% confident that the true population value falls between $267 and $297 (95% confidence interval). Therefore, Jeff Dean can be 95% confident that the second criterion for the forecasting model “passes” the test.
  • 18.
    Hypothesis Testing • Hypothesistesting: a statistical procedure used to “accept” or “reject” the hypothesis based on sample information • Intuitive hypothesis testing: when someone uses something he or she has observed to see if it agrees with or refutes his or her belief about that topic…so we use hypothesis testing in our lives all the time
  • 19.
    Hypothesis Testing…cont. • Statisticalhypothesis testing: • Begin with a statement about what you believe exists in the population. • Draw a random sample and determine the sample statistic. • Compare the statistic to the hypothesized parameter. • Decide whether the sample supports the original hypothesis. • If the sample does not support the hypothesis, revise the hypothesis to be consistent with the sample’s statistic.
  • 20.
    Hypothesis Testing…cont. • Non-Directionalhypotheses: hypotheses that do not indicate a direction (greater than or less than) of a hypothesized value. Rather, non-directional hypotheses state that the hypothesized value is “equal to X.” “Customers expect an entrée to cost $18.” • Directional hypotheses: hypotheses that indicate the direction in which you believe the population parameter falls relative to some target mean or percentage…”Customers expect an entrée to cost more than $18.”
  • 21.
    The Logic ofHypothesis Testing: For Non-directional hypotheses • IF we ASSUME that the hypothesized value is indeed the population parameter, then • 95% of all sample means (or %) drawn from a distribution of sample means (or %) having the value of the parameter will… • Fall within + or – 1.96 z scores. • Therefore, if our formula calculates a z score between + or – 1.96, it is likely (95%) that our sample statistic was drawn from a distribution of sample means (or %) around the population parameter we have hypothesized. We accept the hypothesis.
  • 22.
    Testing a Hypothesisof a Mean • Example in Text: Rex Reigen hypothesizes that college interns make $2,800 in commissions. A survey shows $2,750. Does the survey sample statistic support or fail to support Rex’s hypothesis? (page 476).
  • 23.
    Since 1.43z fallsbetween -1.96z and +1.96 z, we ACCEPT the hypothesis
  • 24.
    The probability thatour sample mean of $2,800 came from a distribution of means around a population parameter of $2,750 is 95%. Therefore, we accept Rex’s hypothesis.
  • 25.
    How Do WeUse SPSS to Test Hypotheses About a Percentage? • SPSS cannot test hypotheses about percentages. You must use the formula. See page 474 for an example.
  • 26.
    How Do WeUse SPSS to Test Hypotheses About a Mean? • In the Hobbit’s Choice Case we want to test that those stating “Very Likely” to patronize an upscale restaurant are willing to pay an average of $18 per entrée. • DATA, SELECT CASES, Likely=5 • ANALYZE, COMPARE MEANS, ONE SAMPLE T TEST • ENTER 18 AS TEST VALUE • Note: z value is reported as t in SPSS output
  • 29.
    What if wehad stated the hypothesis as a Directional Hypothesis? • Those stating “Very Likely” to patronize an upscale restaurant are willing to pay more than an average of $18 per entrée. • Is the sign (- or +) in the hypothesized direction? For “more than” hypotheses it should be +, if not, reject • Since we are working with a direction, we are only concerned with one side of the normal distribution. Therefore, we need to adjust the critical values. We would accept this hypothesis if the z value computed is greater than +1.64 (95%).