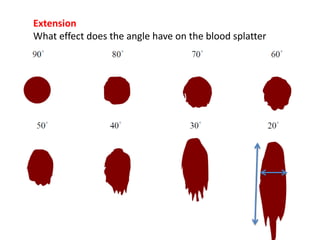
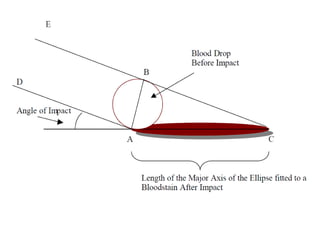
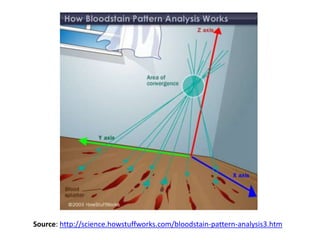
Blood splatter
blood stain pattern analysis
Blood splatter: find the relationship between height
and blood splatter
Context. A victim has been strangled. A few drops of
blood were found on the floor near her. Blood tests show
that the blood is not the victims. There is blood on the
victim’s knuckles. It has been hypothesised that the victim
gave the attacker a bloody nose or lip and that the blood
dripped onto the floor. Is it possible to find the height of the
attacker from the size of the blood drop?
Write up your plan/ method, analysis and conclusions in a
scientific report this must include graphical displays of data
Data may be collected in small groups but the report and
calculation must be done individually.
Outcomes Grade
P criteria M criteria D criteria
1
carry out
mathematical
procedures involving
units, numbers,
areas, volumes,
indices, formulae
and equations in a
practical laboratory
situation
explain how the use
of some operations
can give skewed
information and
how errors may
occur
explain the use of
negative indices in
the stages of
making serial
dilutions
2
plot and interpret
linear and non-linear
graphs from primary
and secondary
experimental data
explain why
different graphs are
used to present
scientific data and
how errors may
occur
evaluate the
usefulness of
graphs in displaying
the results of
scientific
experiments
3
record and display
scientific data
appropriately,
indicating any errors.
justify the levels of
accuracy in the use
of particular types
of data collection
methods in
laboratory
experiments.
evaluate the
appropriateness of
the methods used
to record and
display data.
Extension
What effect does the angle have on the blood splatter
pattern?
Angle (°) Width (mm) Length (mm) Sin-1(W/L)
90
80
70
60
50
…etc.
Source: http://science.howstuffworks.com/bloodstain-pattern-analysis3.htm
Blood  Splatter

Blood Splatter

  • 1.
  • 2.
    Blood splatter: findthe relationship between height and blood splatter Context. A victim has been strangled. A few drops of blood were found on the floor near her. Blood tests show that the blood is not the victims. There is blood on the victim’s knuckles. It has been hypothesised that the victim gave the attacker a bloody nose or lip and that the blood dripped onto the floor. Is it possible to find the height of the attacker from the size of the blood drop? Write up your plan/ method, analysis and conclusions in a scientific report this must include graphical displays of data Data may be collected in small groups but the report and calculation must be done individually.
  • 3.
    Outcomes Grade P criteriaM criteria D criteria 1 carry out mathematical procedures involving units, numbers, areas, volumes, indices, formulae and equations in a practical laboratory situation explain how the use of some operations can give skewed information and how errors may occur explain the use of negative indices in the stages of making serial dilutions 2 plot and interpret linear and non-linear graphs from primary and secondary experimental data explain why different graphs are used to present scientific data and how errors may occur evaluate the usefulness of graphs in displaying the results of scientific experiments 3 record and display scientific data appropriately, indicating any errors. justify the levels of accuracy in the use of particular types of data collection methods in laboratory experiments. evaluate the appropriateness of the methods used to record and display data.
  • 4.
    Extension What effect doesthe angle have on the blood splatter pattern?
  • 7.
    Angle (°) Width(mm) Length (mm) Sin-1(W/L) 90 80 70 60 50 …etc.
  • 9.