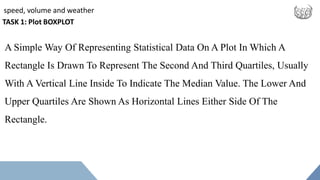
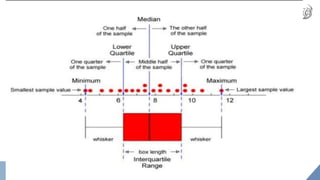
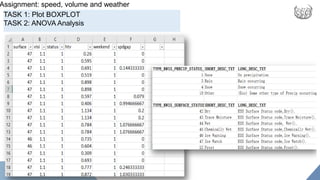
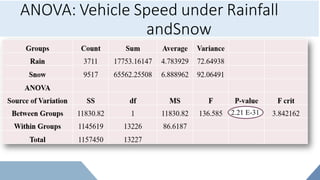
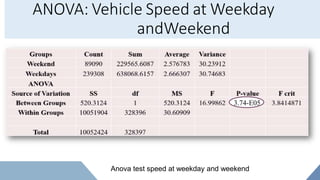
Presentation
on
Data analysis
speed, volume and weather
TASK 1: Plot BOXPLOT
A Simple Way Of Representing Statistical Data On A Plot In Which A
Rectangle Is Drawn To Represent The Second And Third Quartiles, Usually
With A Vertical Line Inside To Indicate The Median Value. The Lower And
Upper Quartiles Are Shown As Horizontal Lines Either Side Of The
Rectangle.
 its simplest form, the boxplot presents five sample statistics - the minimum, the
lower quartile, the median, the upper quartile and the maximum - in a visual display.
 The box of the plot is a rectangle which encloses the middle half of the sample, with
an end at each quartile. The length of the box is thus the interquartile range of the
sample. The other dimension of the box does not represent anything in particular. A
line is drawn across the box at the sample median.
 the box until they reach the sample maximum and minimum.
TASK 2: ANOVA Analysis
Analysis of variance (ANOVA) is a collection of statistical models and their associated estimation
procedures (such as the "variation" among and between groups) used to analyze the differences
among means. ANOVA was developed by the statistician ronald fisher. ANOVA is based on the
law of total variance, where the observed variance in a particular variable is partitioned into
components attributable to different sources of variation. In its simplest form, ANOVA provides a
statistical test of whether two or more population means are equal, and therefore generalizes the t-
test beyond two means.
TASK 1: Plot BOXPLOT
TASK 2: ANOVA Analysis
Assignment: speed, volume and weather
Data set:
Boxplot: Traffic speed Vs Road
surface
Boxplot : Avg speed vs surface condition
Boxplot: Traffic speed Vs
Visibility
Boxplot :Avg speed vs Visibility
2.21 E-31
ANOVA: Vehicle Speed under Rainfall
andSnow
3.74-E05
ANOVA: Vehicle Speed at Weekday
andWeekend
Anova test speed at weekday and weekend
THANK YOU!

data analysis

  • 1.
  • 2.
    speed, volume andweather TASK 1: Plot BOXPLOT A Simple Way Of Representing Statistical Data On A Plot In Which A Rectangle Is Drawn To Represent The Second And Third Quartiles, Usually With A Vertical Line Inside To Indicate The Median Value. The Lower And Upper Quartiles Are Shown As Horizontal Lines Either Side Of The Rectangle.
  • 3.
     its simplestform, the boxplot presents five sample statistics - the minimum, the lower quartile, the median, the upper quartile and the maximum - in a visual display.  The box of the plot is a rectangle which encloses the middle half of the sample, with an end at each quartile. The length of the box is thus the interquartile range of the sample. The other dimension of the box does not represent anything in particular. A line is drawn across the box at the sample median.  the box until they reach the sample maximum and minimum.
  • 5.
    TASK 2: ANOVAAnalysis Analysis of variance (ANOVA) is a collection of statistical models and their associated estimation procedures (such as the "variation" among and between groups) used to analyze the differences among means. ANOVA was developed by the statistician ronald fisher. ANOVA is based on the law of total variance, where the observed variance in a particular variable is partitioned into components attributable to different sources of variation. In its simplest form, ANOVA provides a statistical test of whether two or more population means are equal, and therefore generalizes the t- test beyond two means.
  • 6.
    TASK 1: PlotBOXPLOT TASK 2: ANOVA Analysis Assignment: speed, volume and weather
  • 7.
    Data set: Boxplot: Trafficspeed Vs Road surface
  • 8.
    Boxplot : Avgspeed vs surface condition
  • 9.
  • 10.
    Boxplot :Avg speedvs Visibility
  • 11.
    2.21 E-31 ANOVA: VehicleSpeed under Rainfall andSnow
  • 12.
    3.74-E05 ANOVA: Vehicle Speedat Weekday andWeekend Anova test speed at weekday and weekend
  • 13.