Download as PDF, PPTX
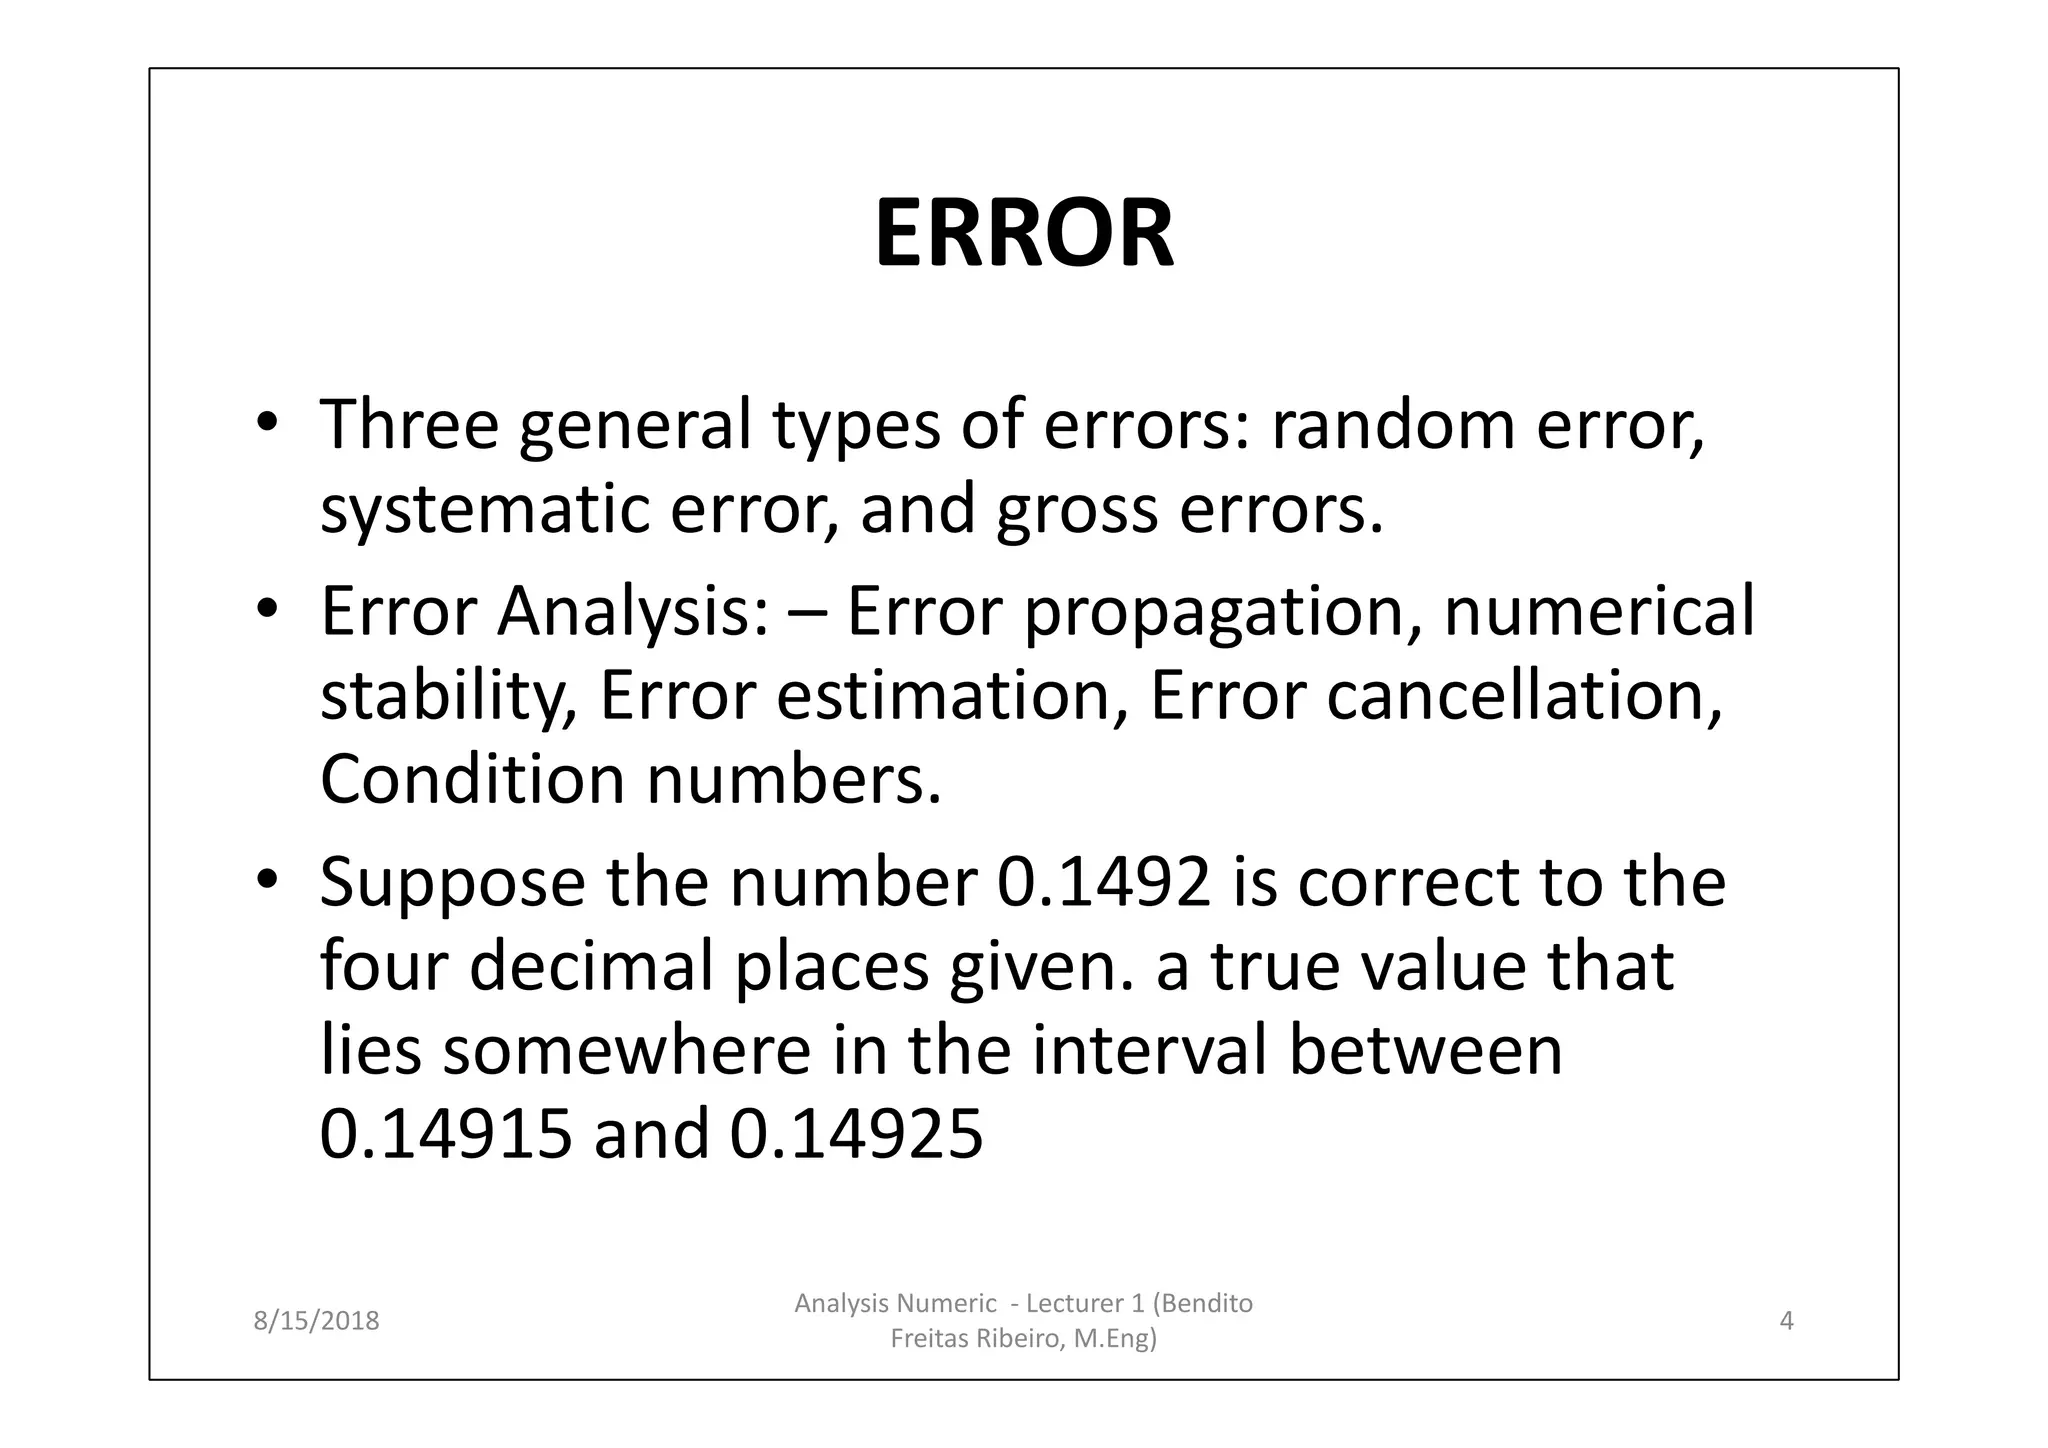
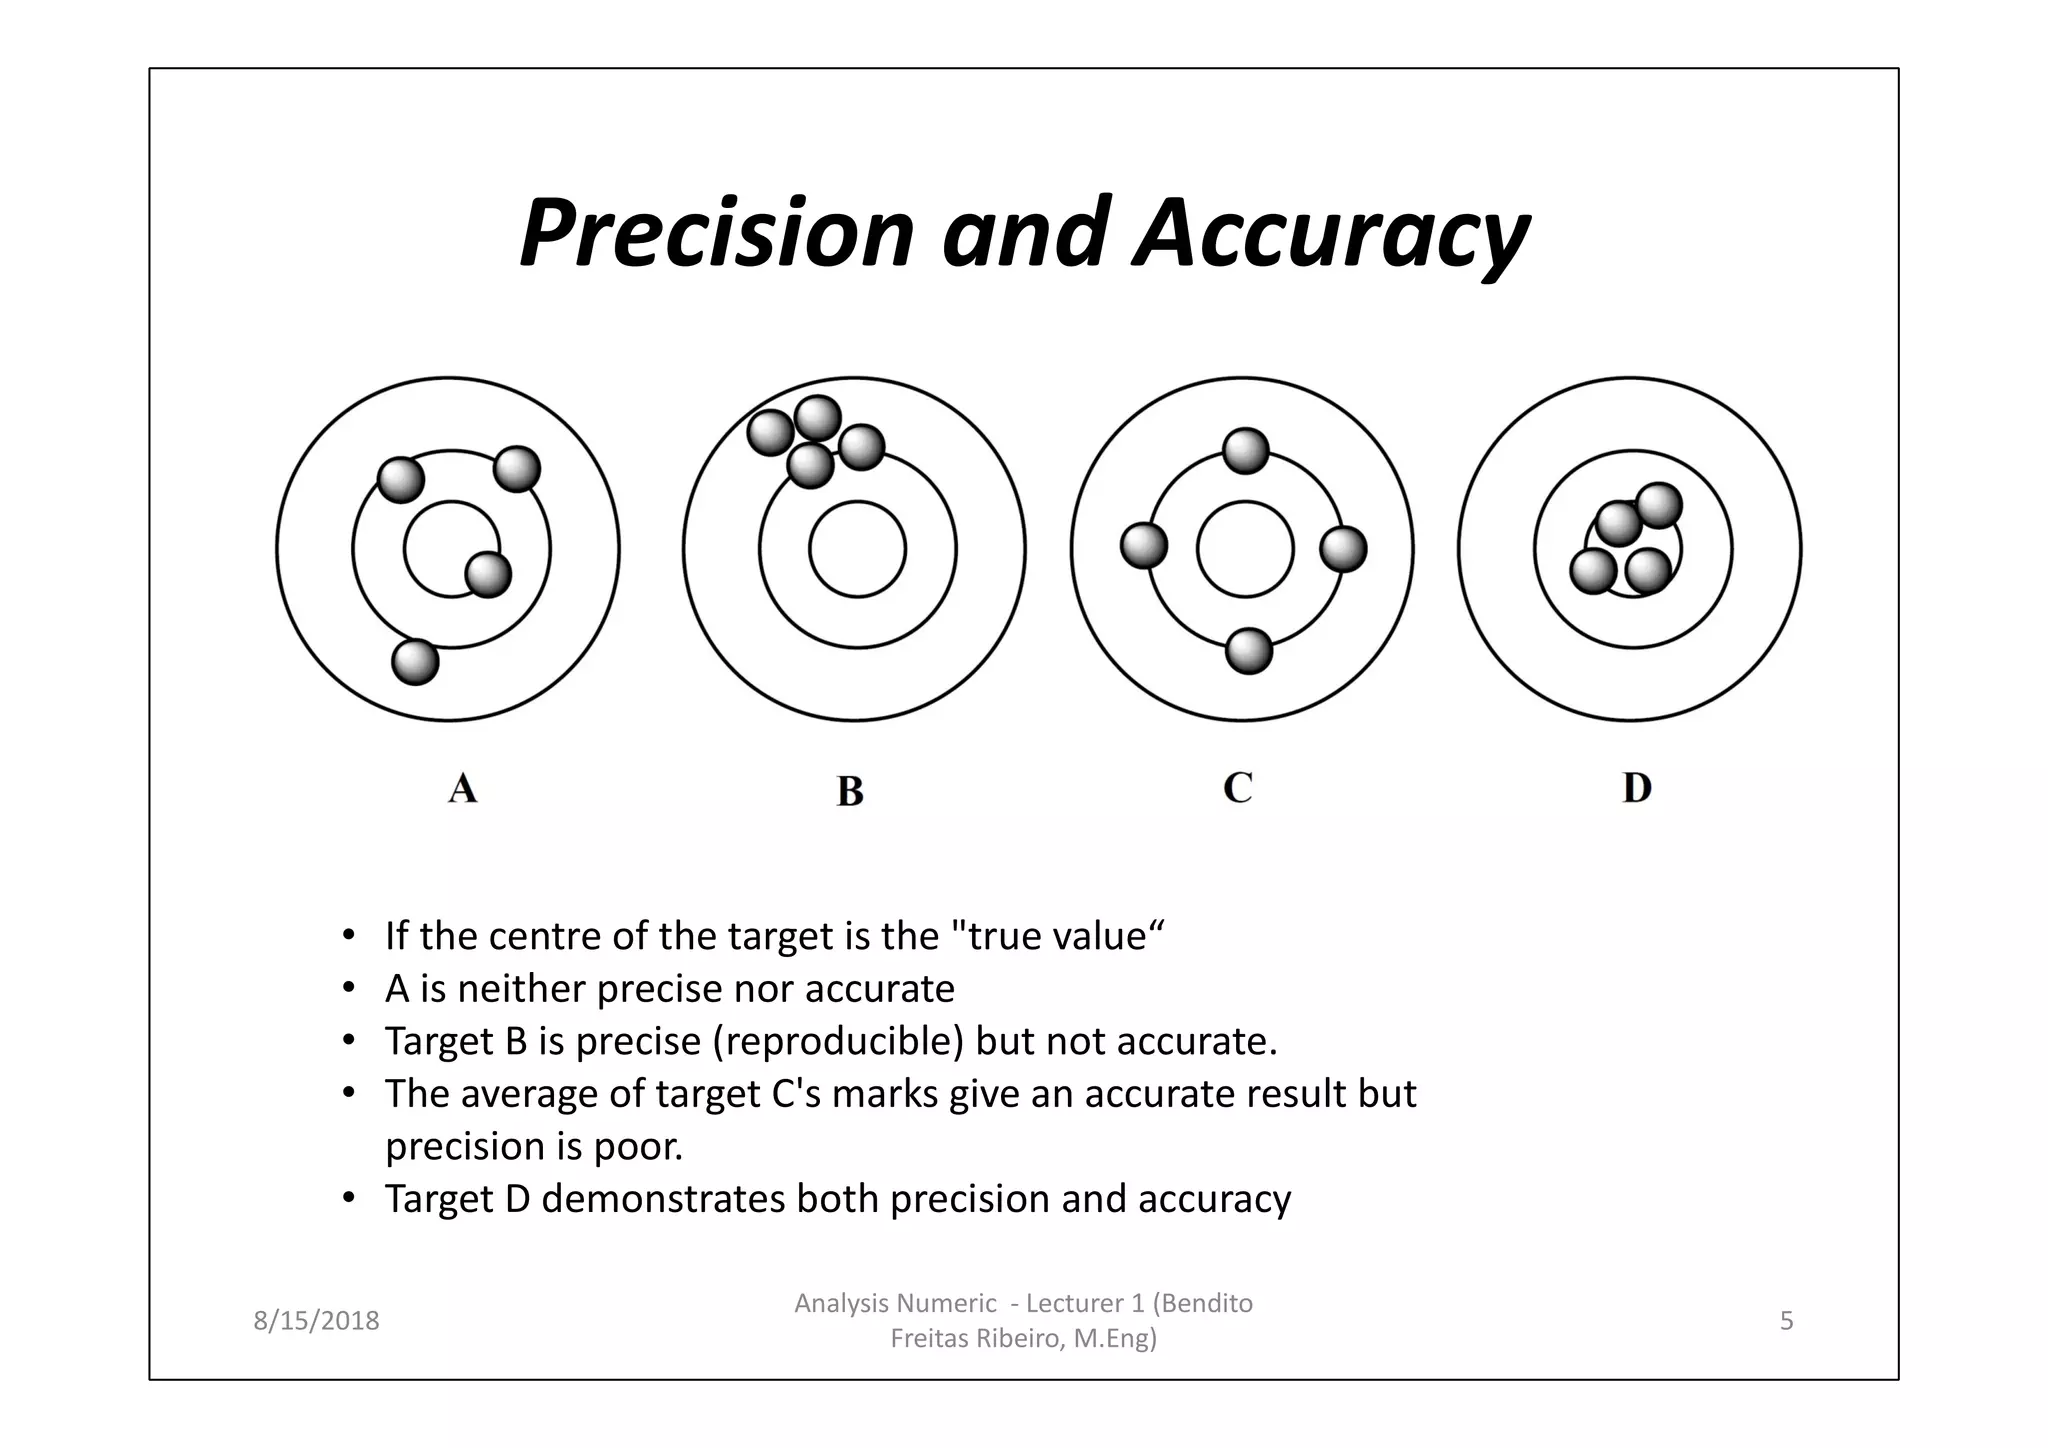
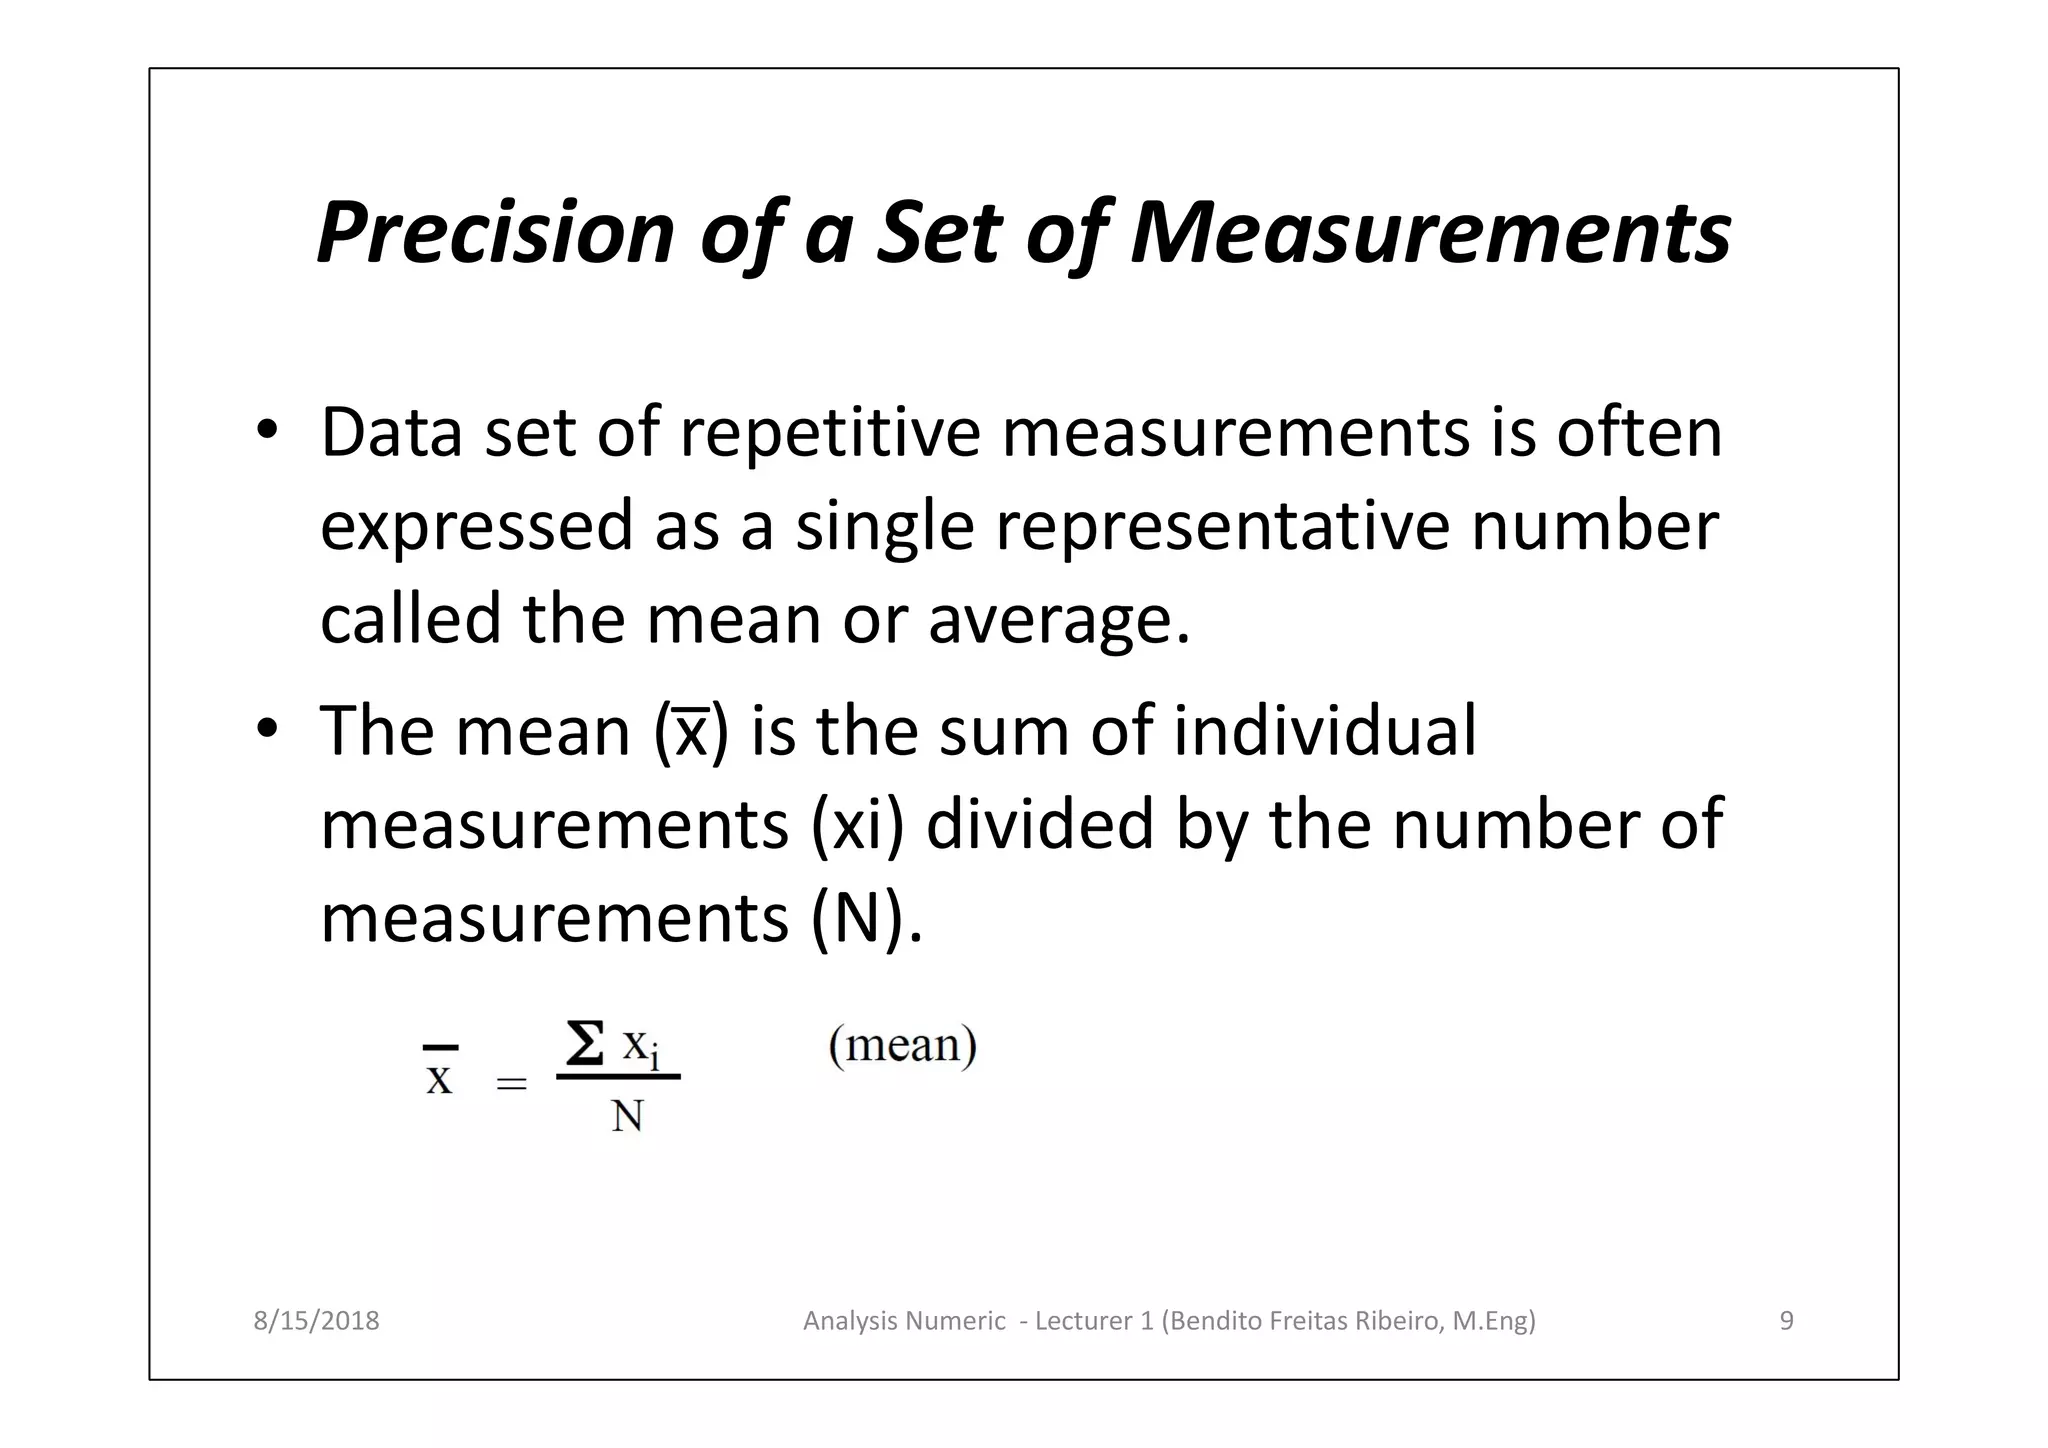
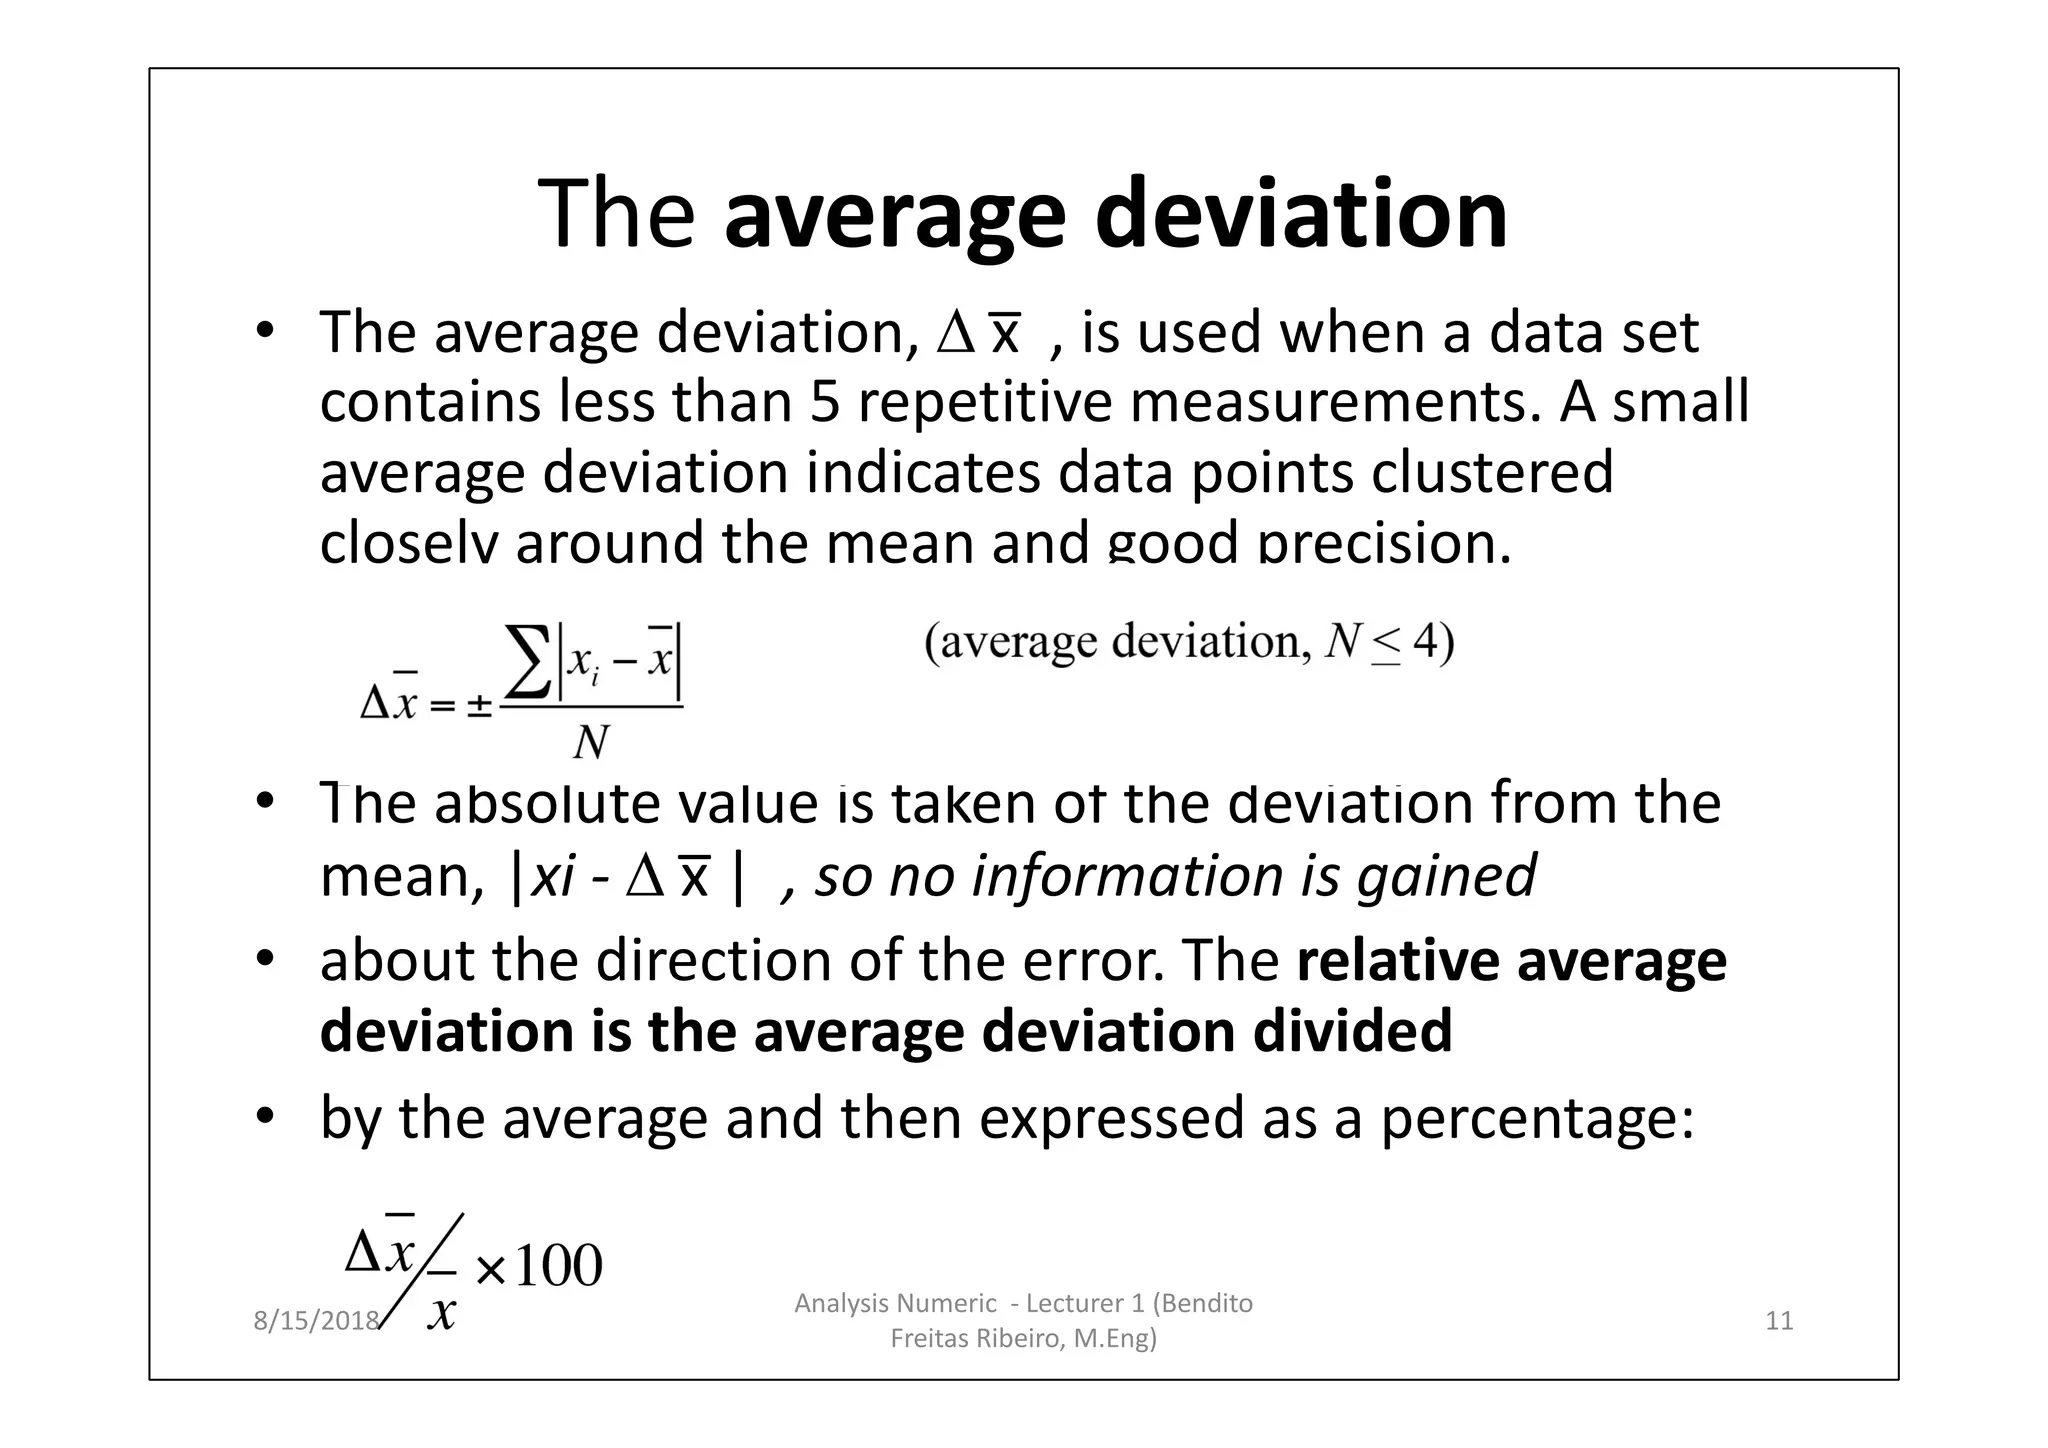
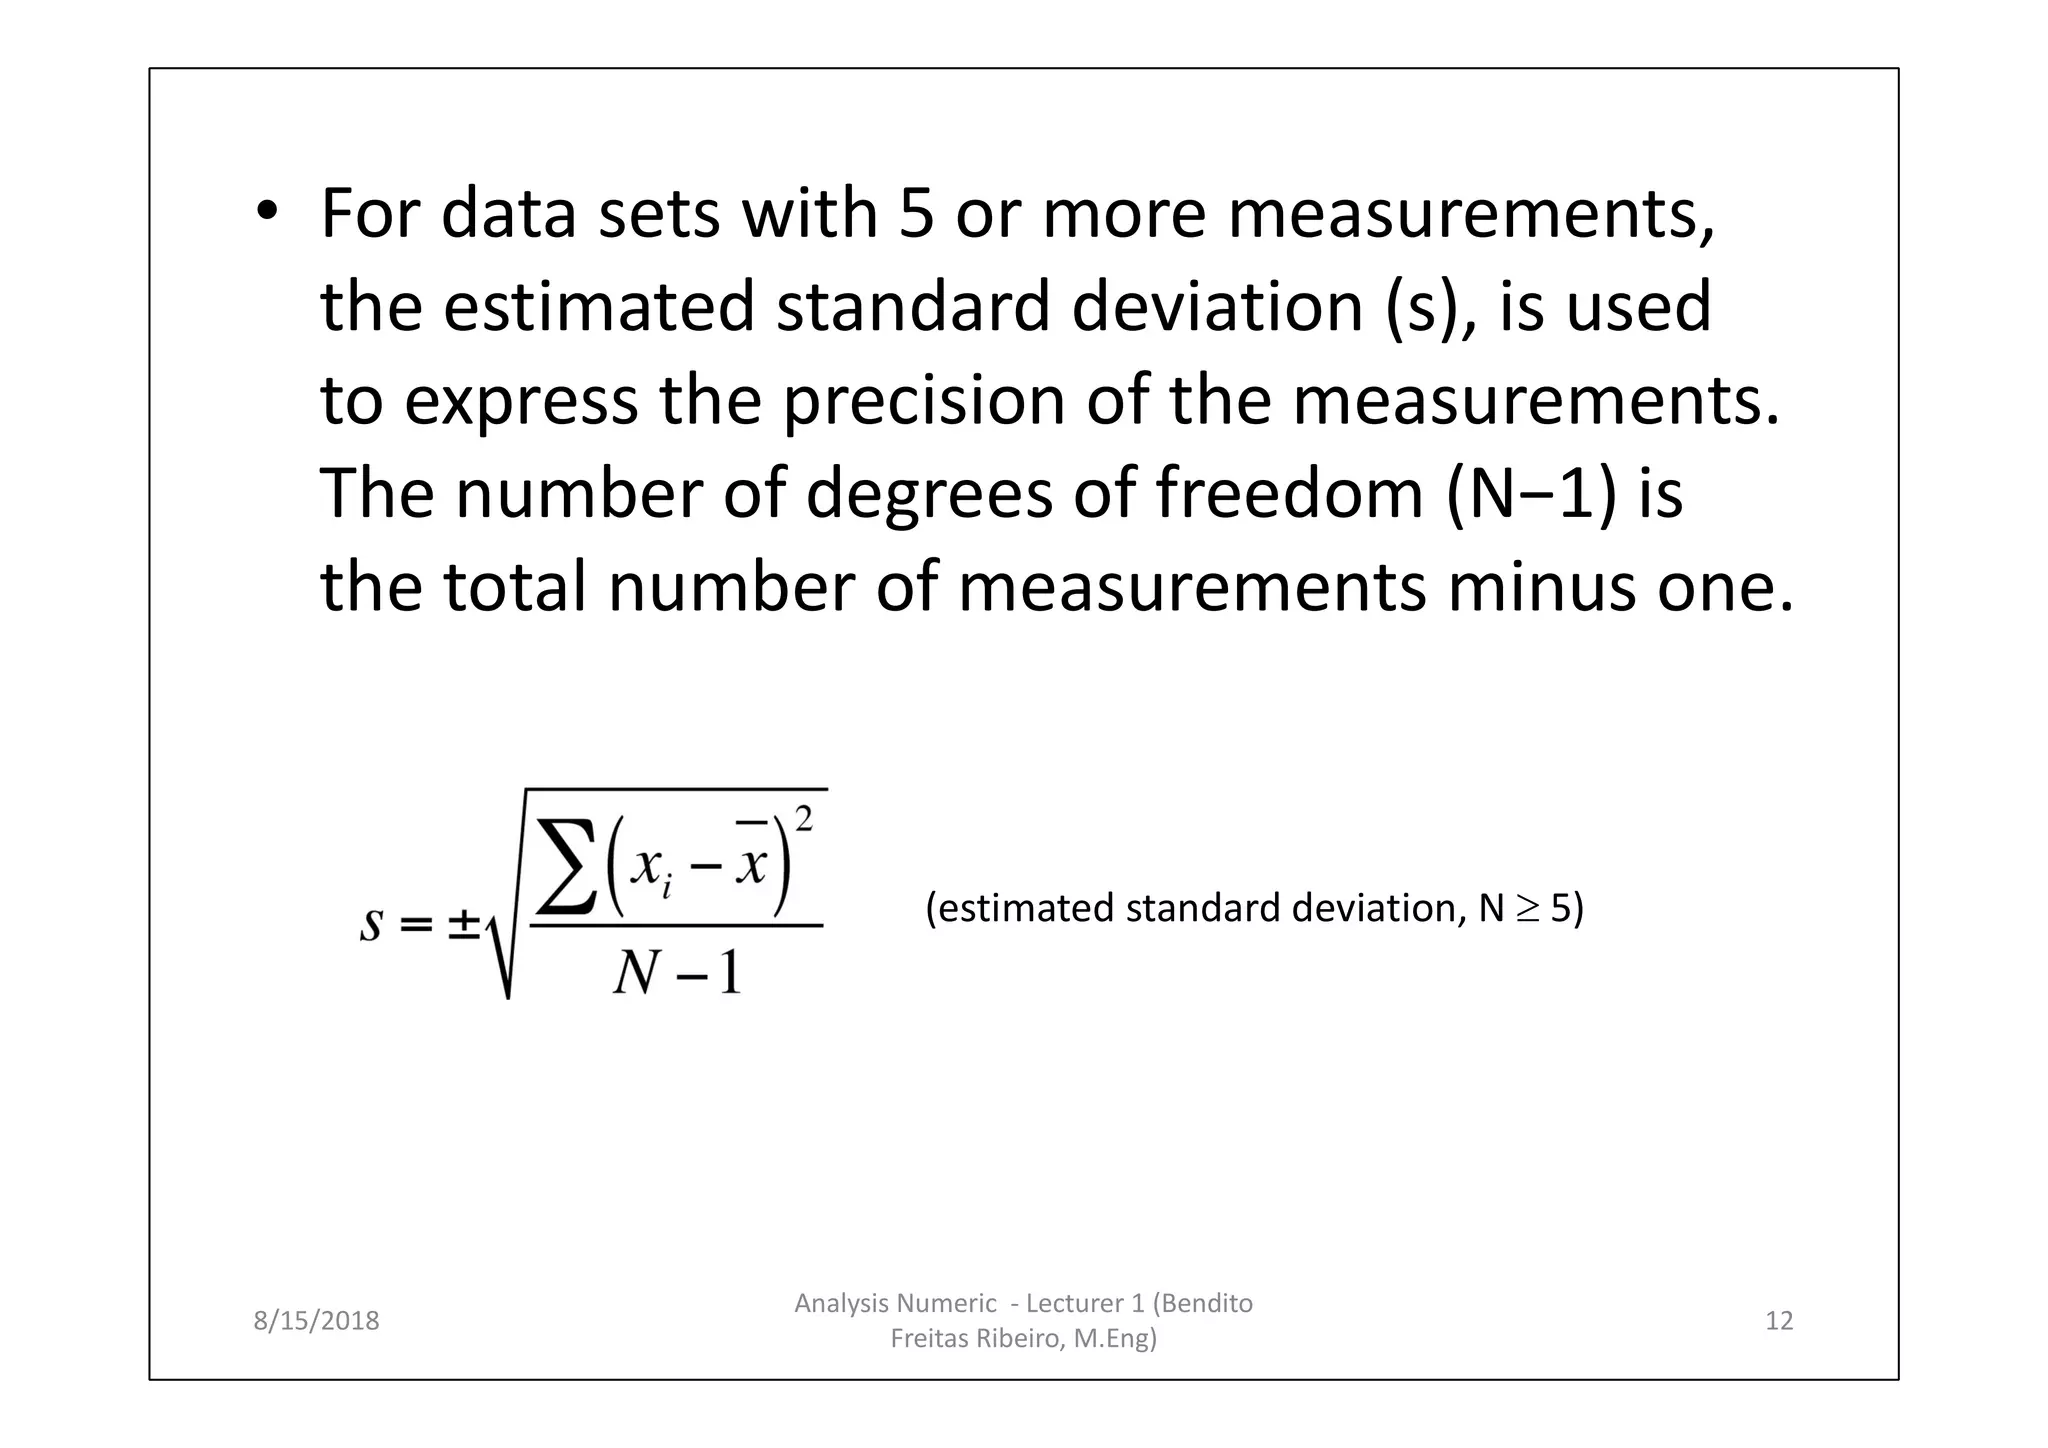
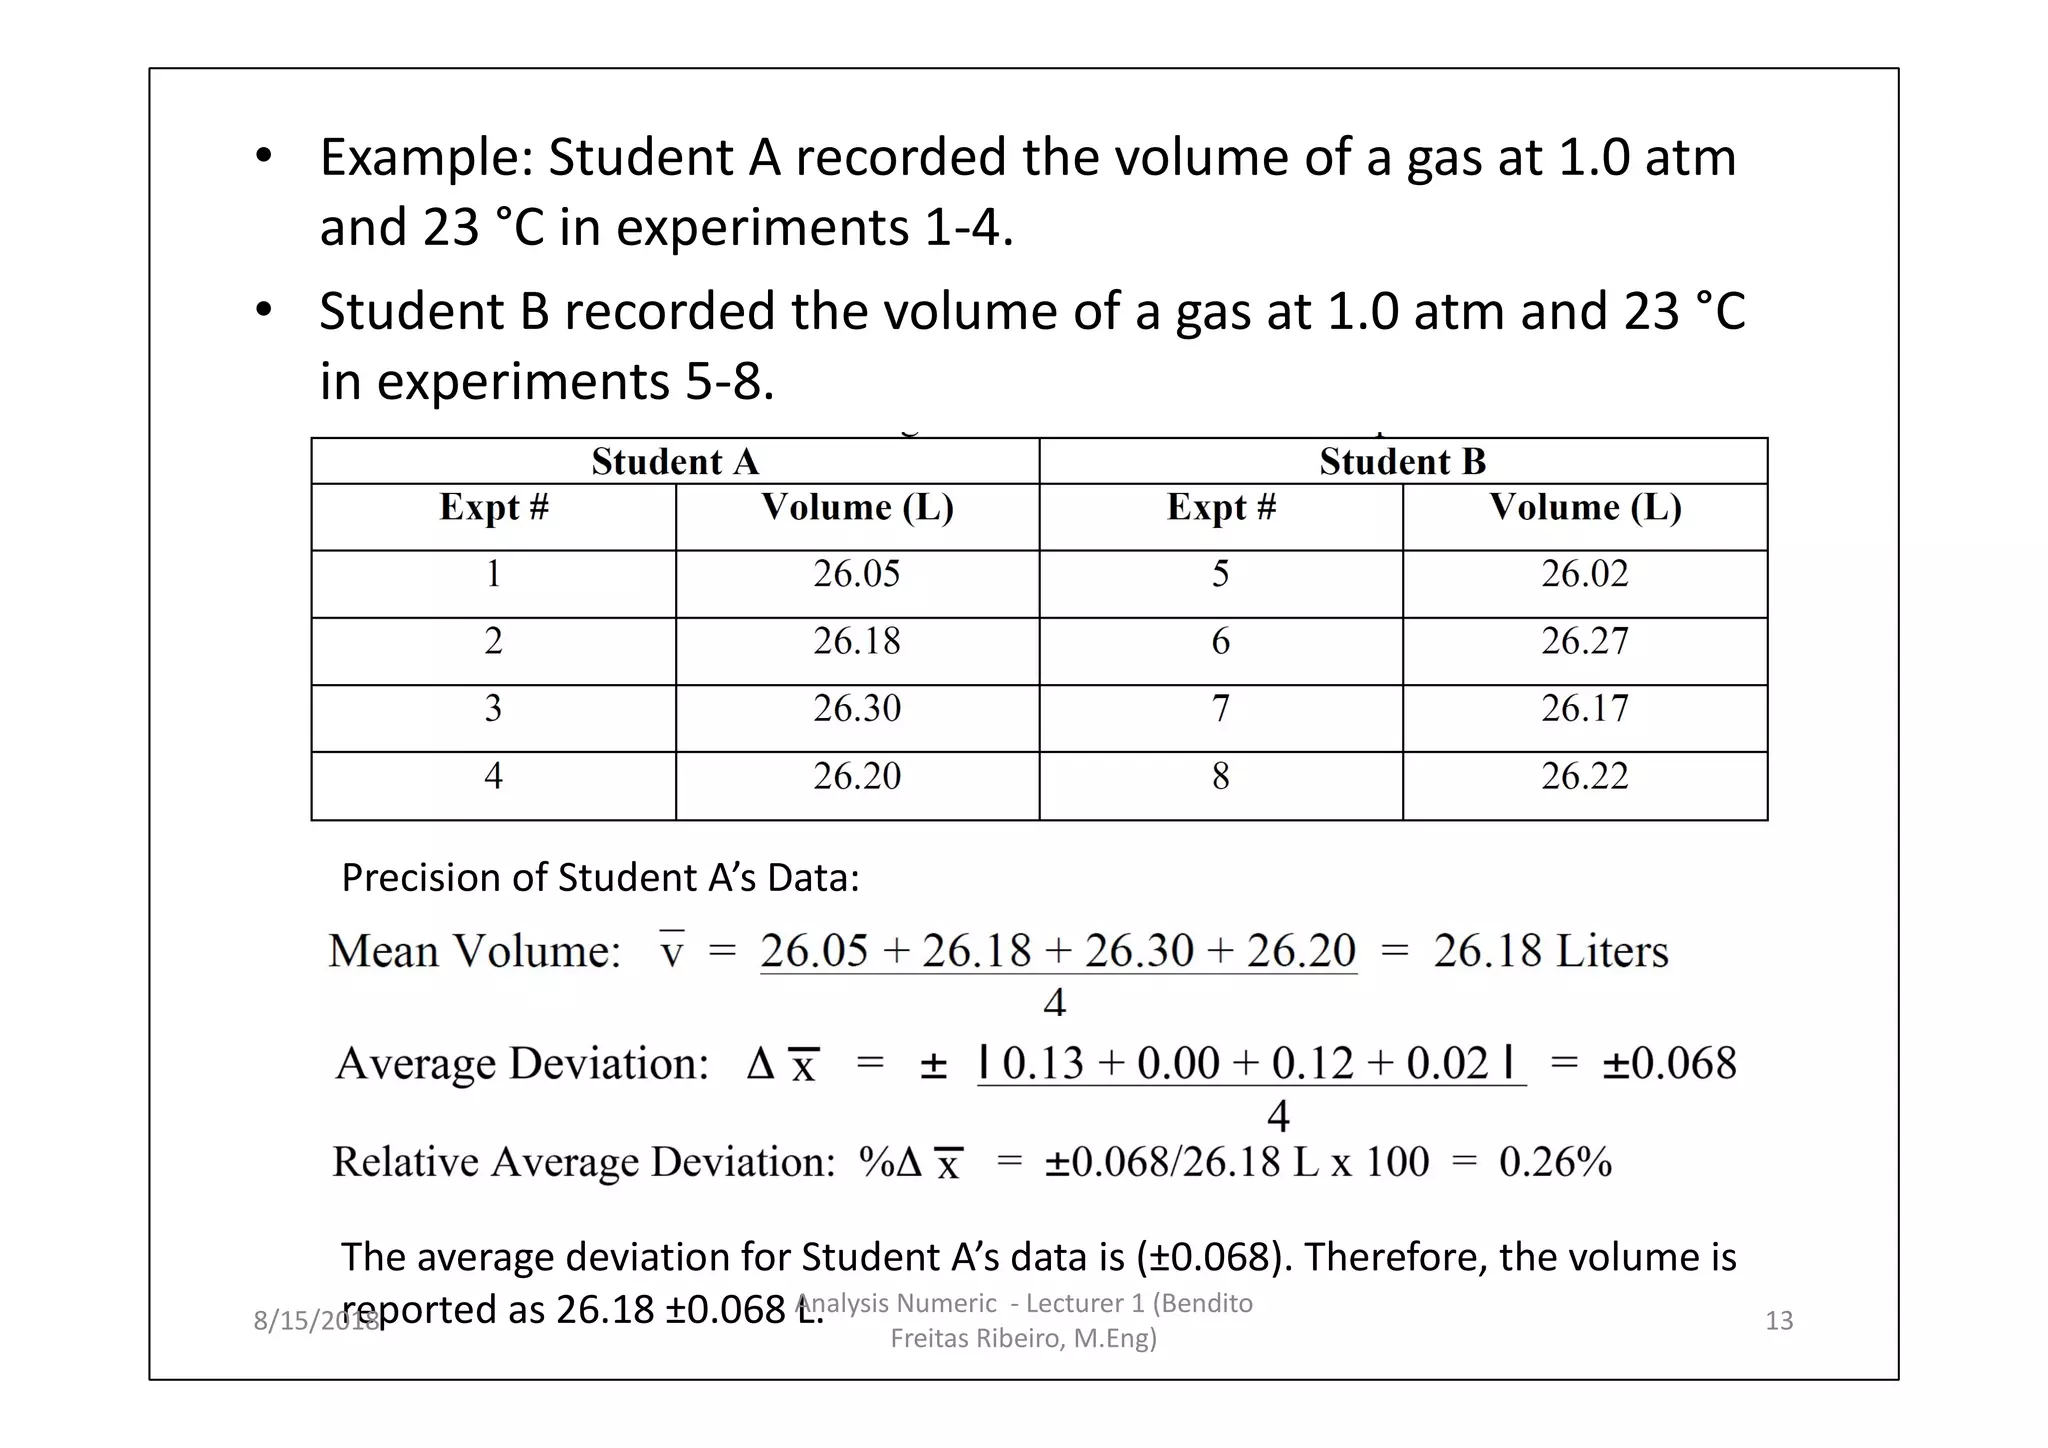
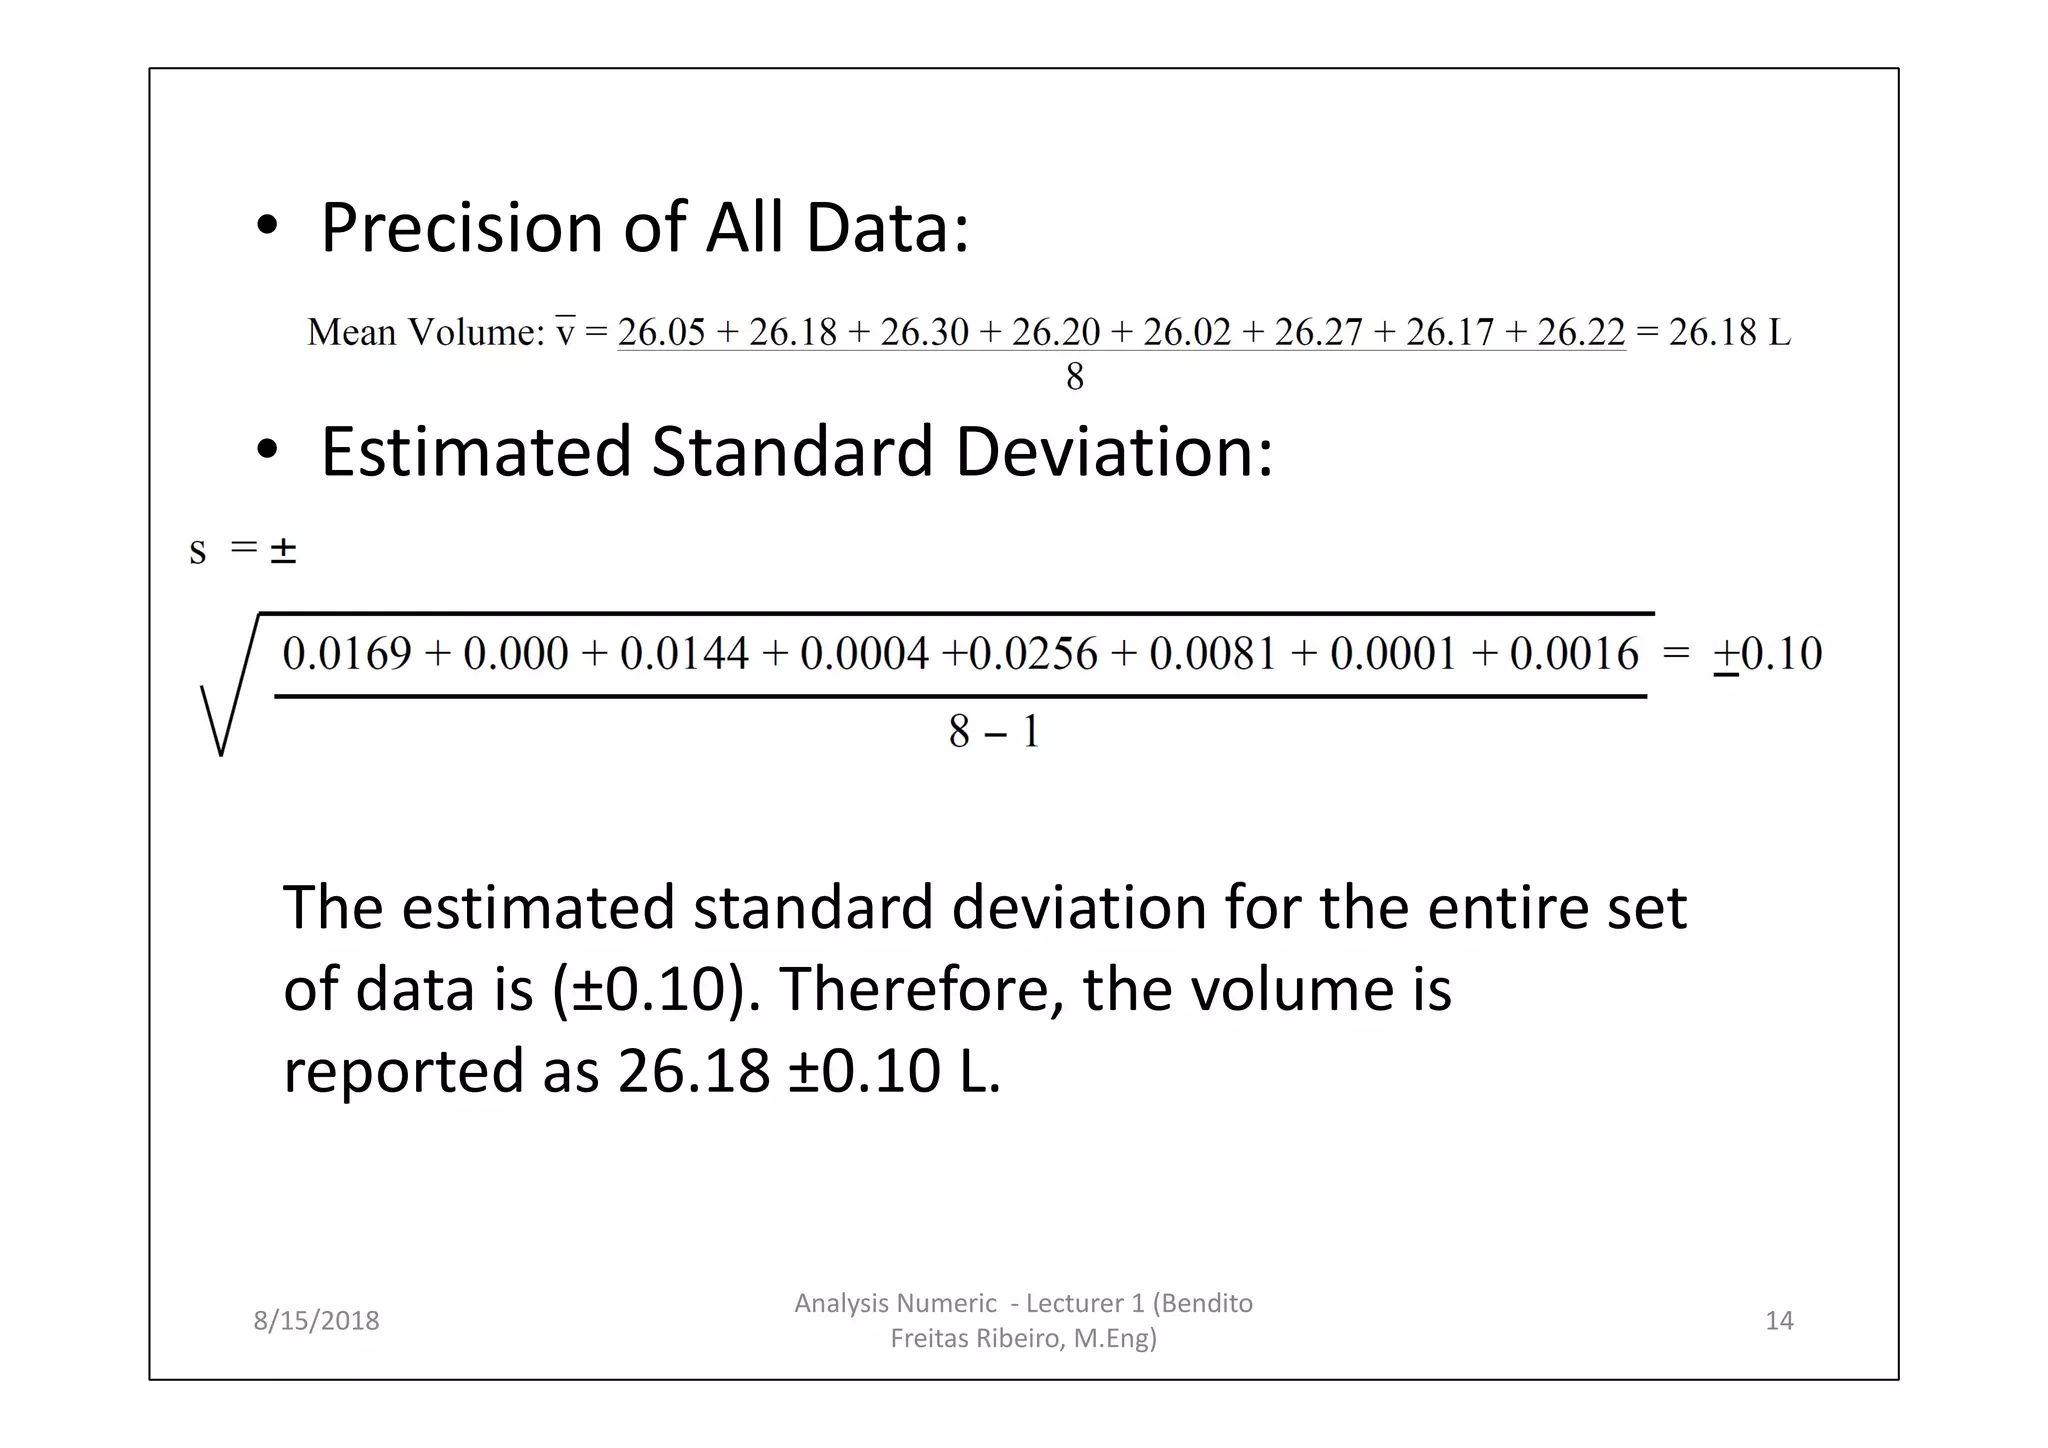
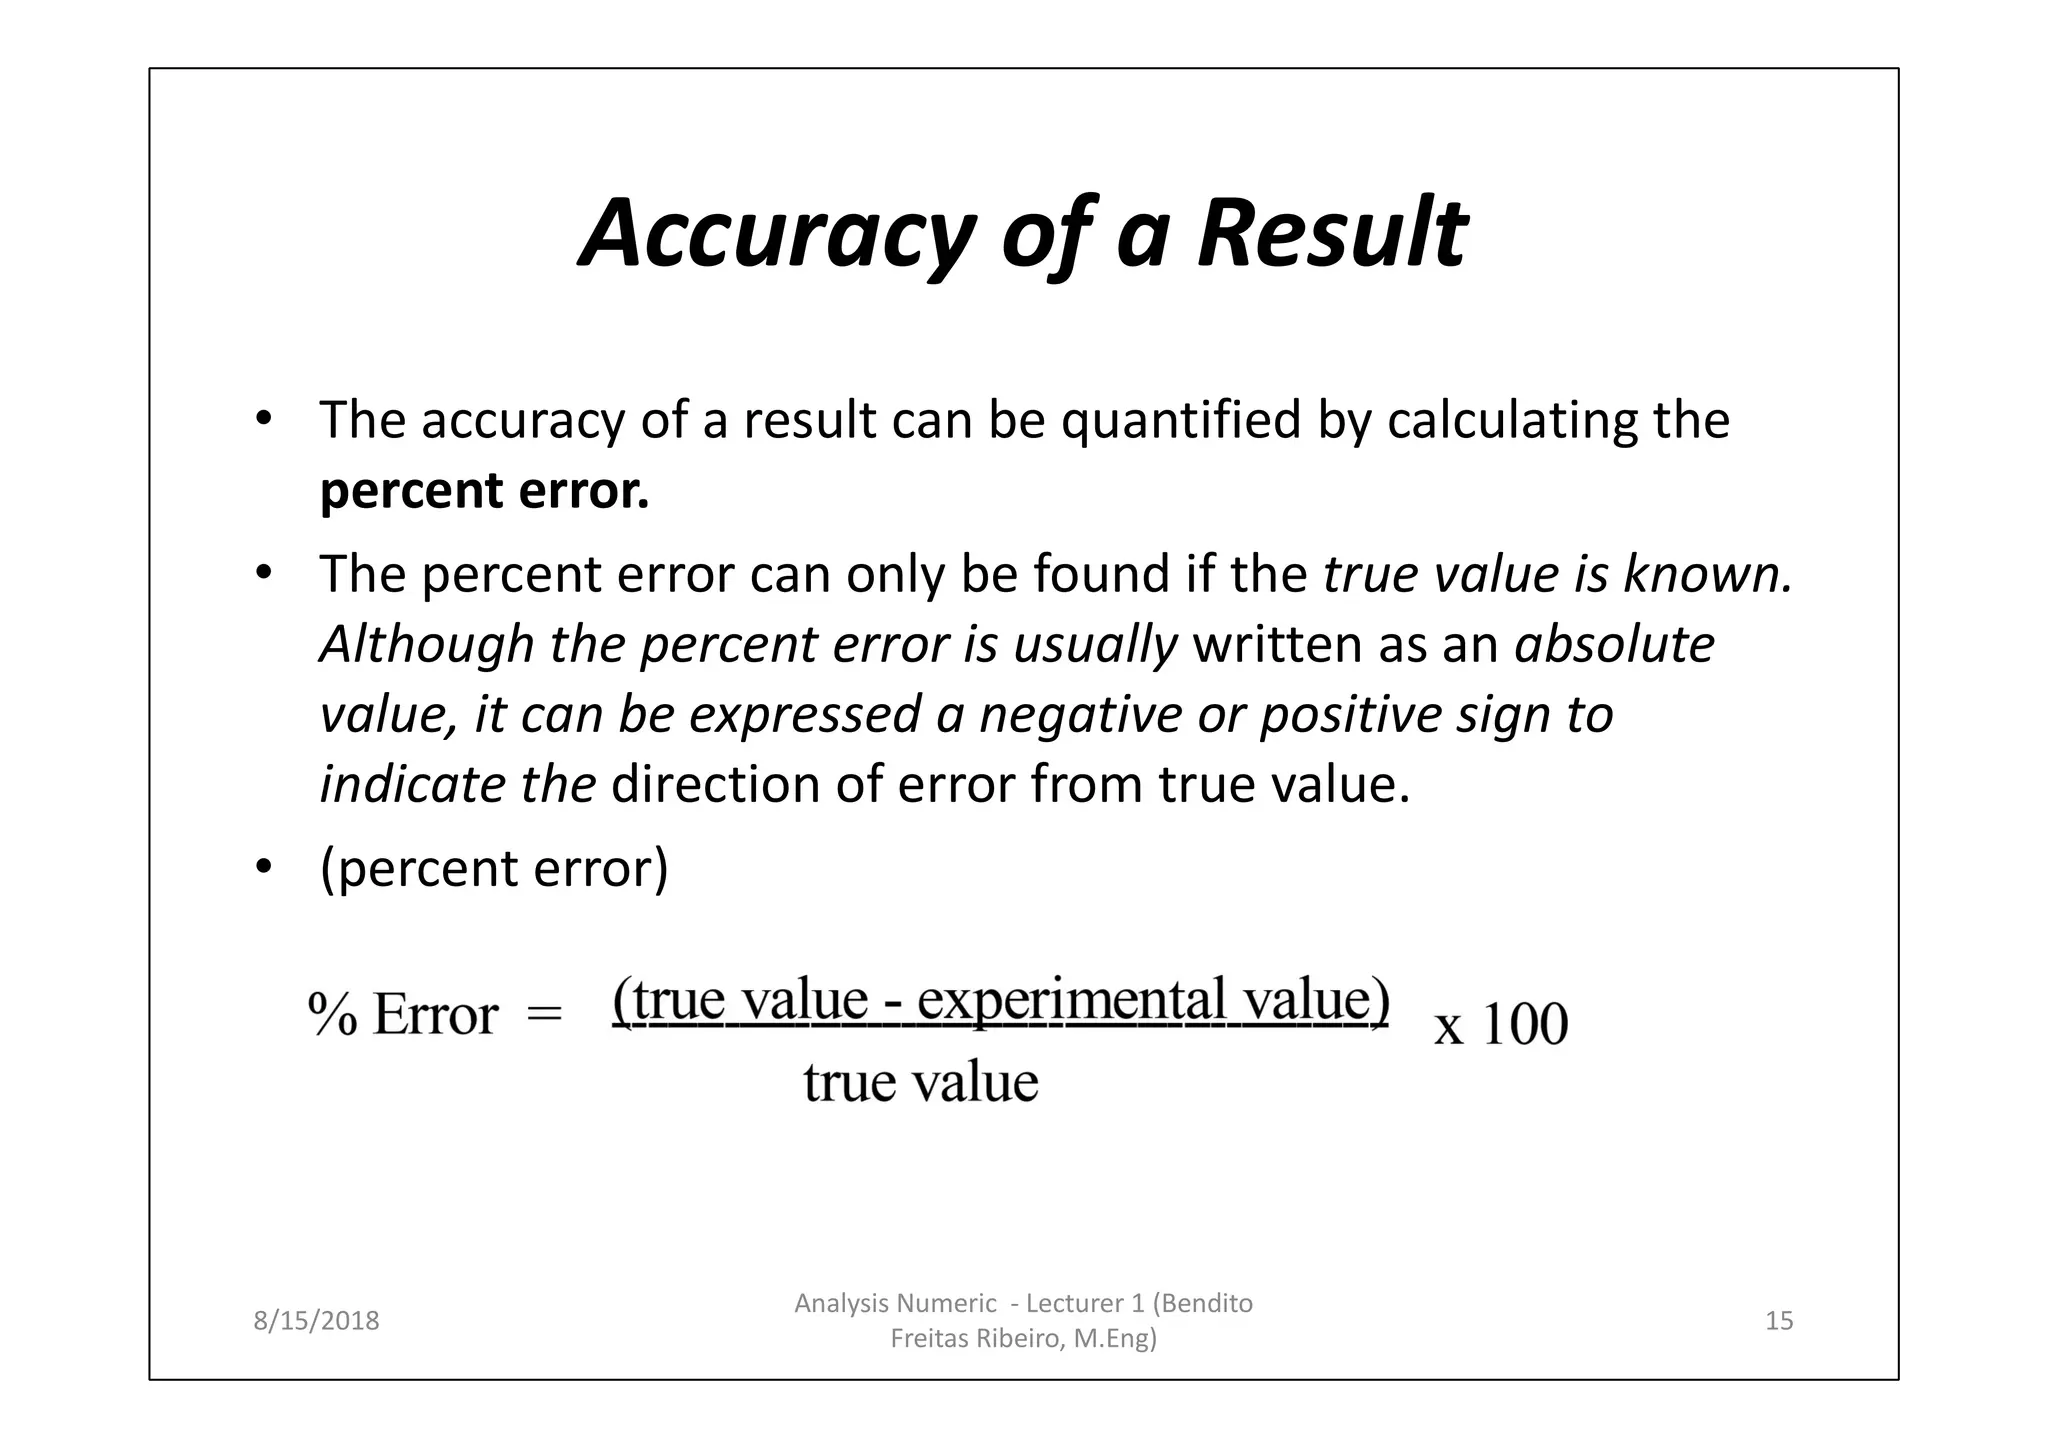
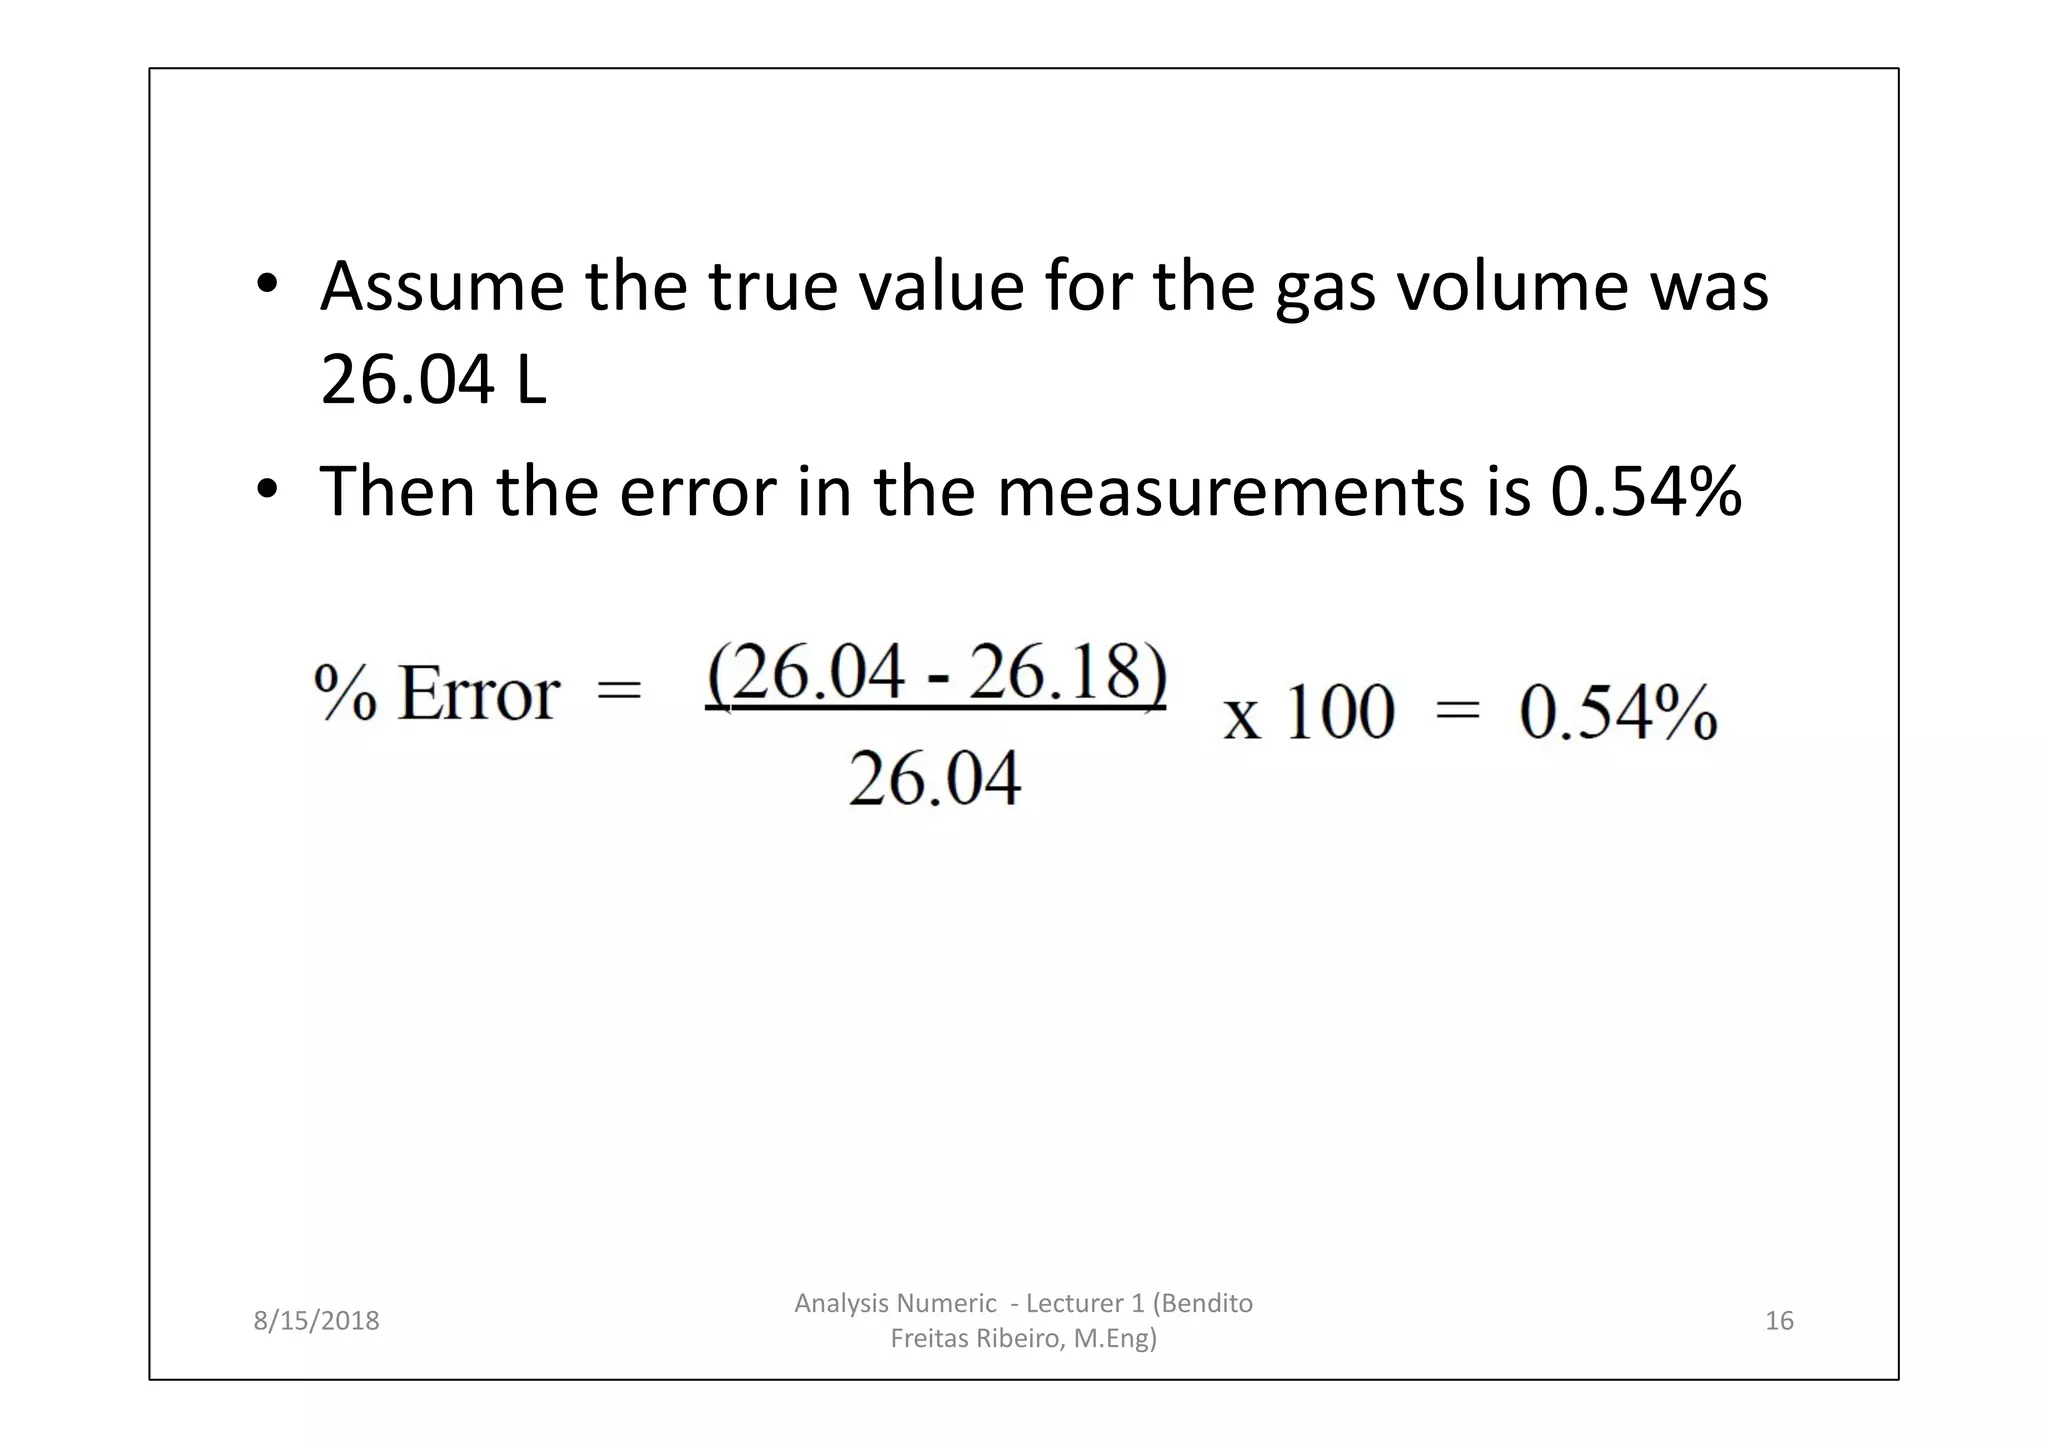
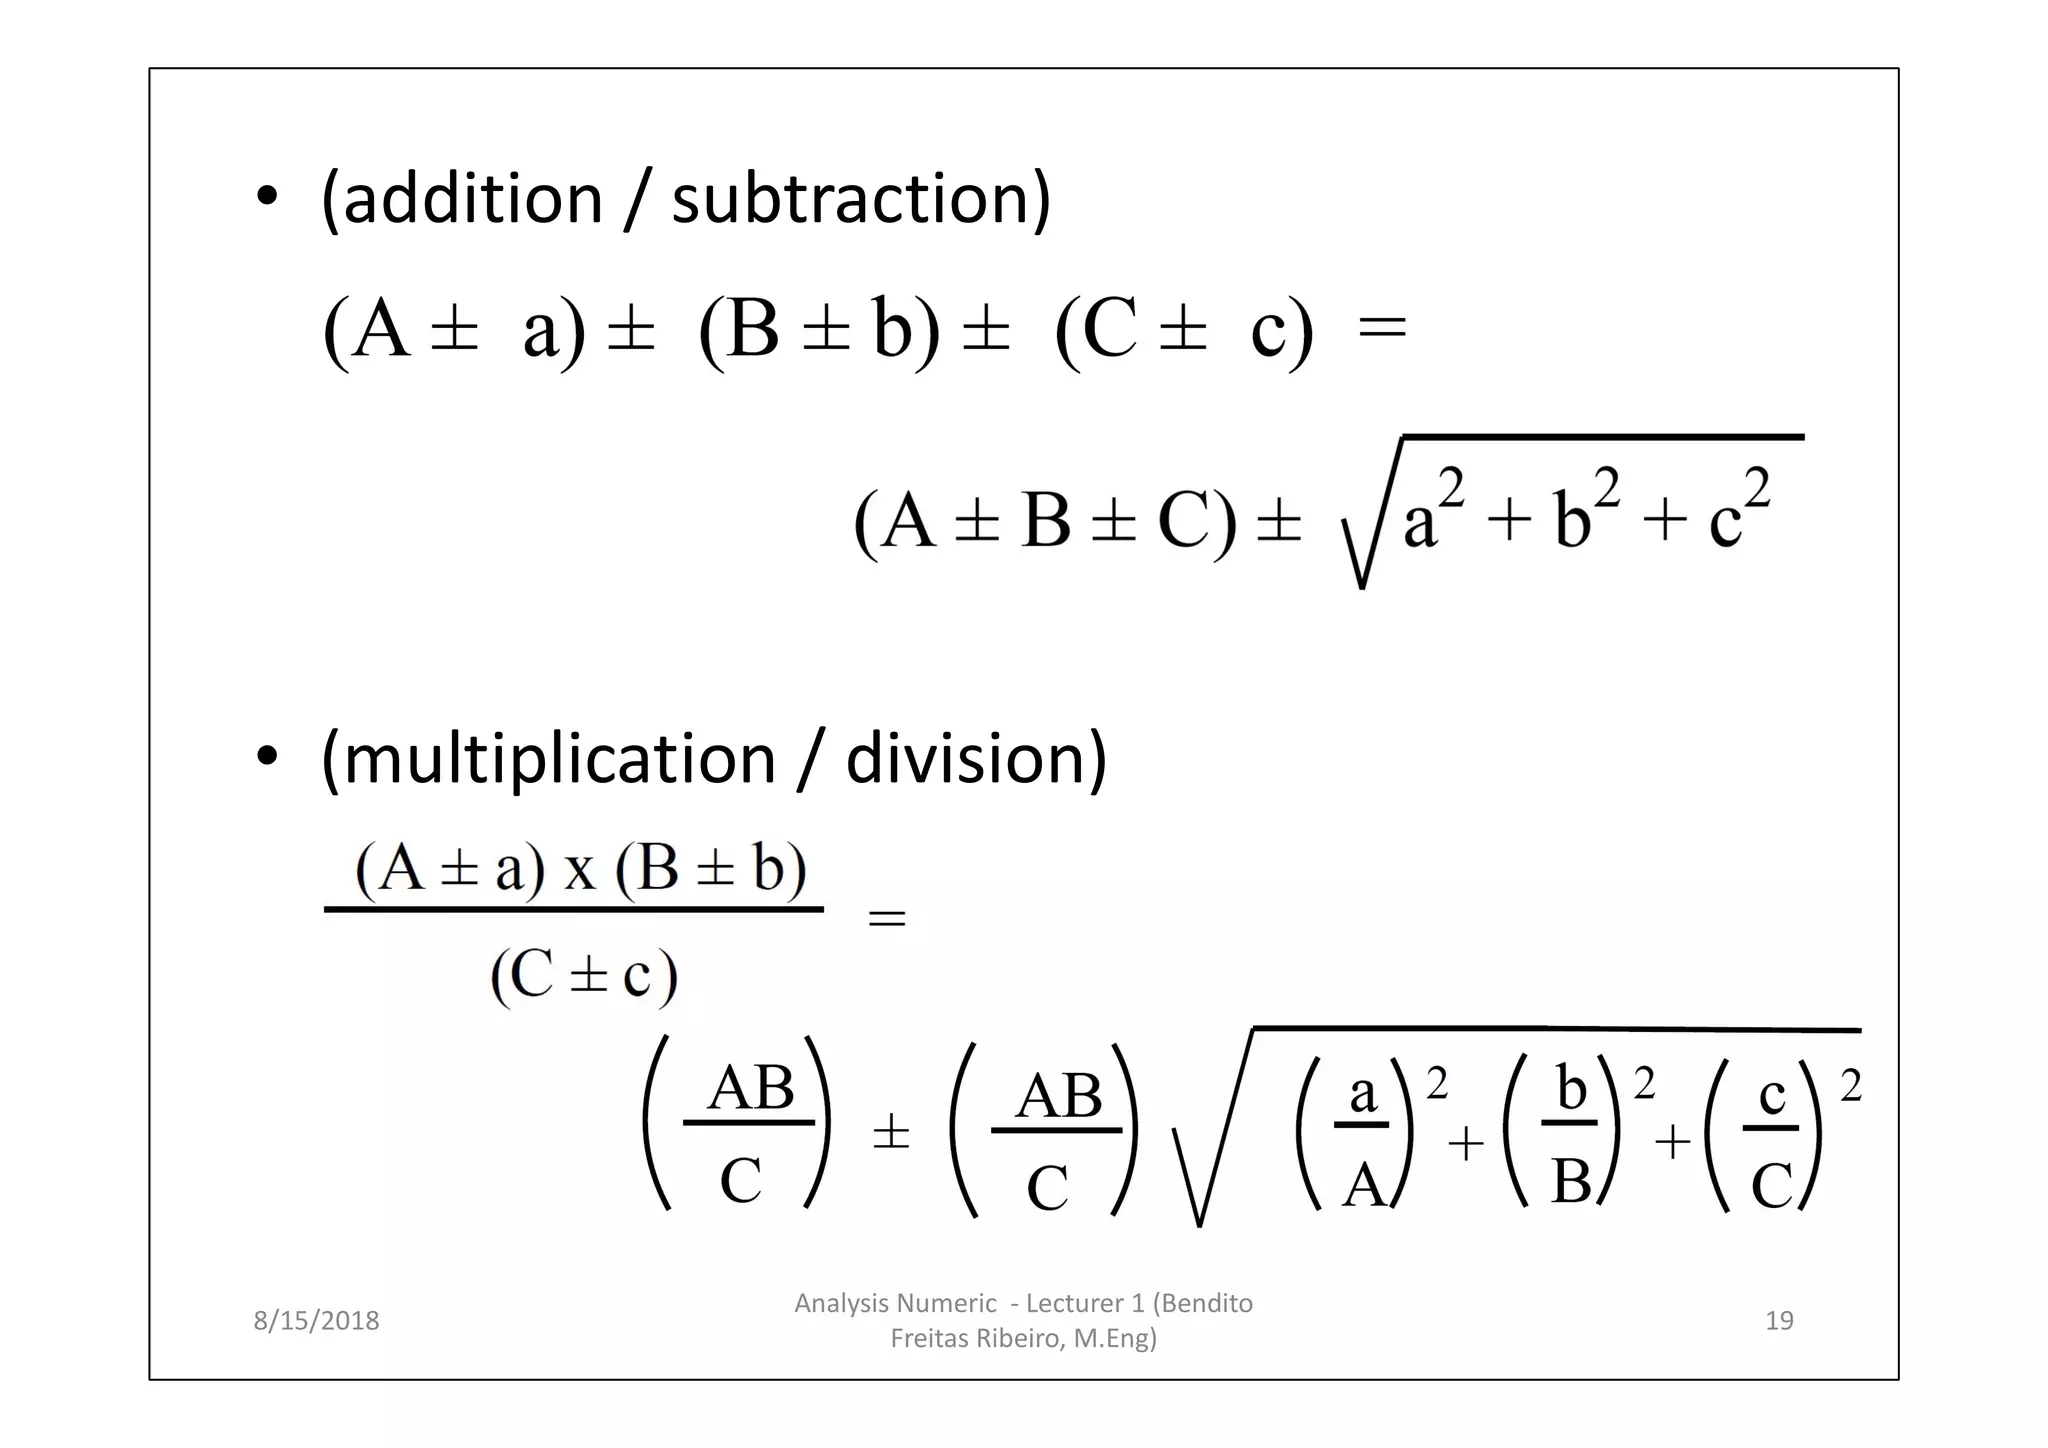
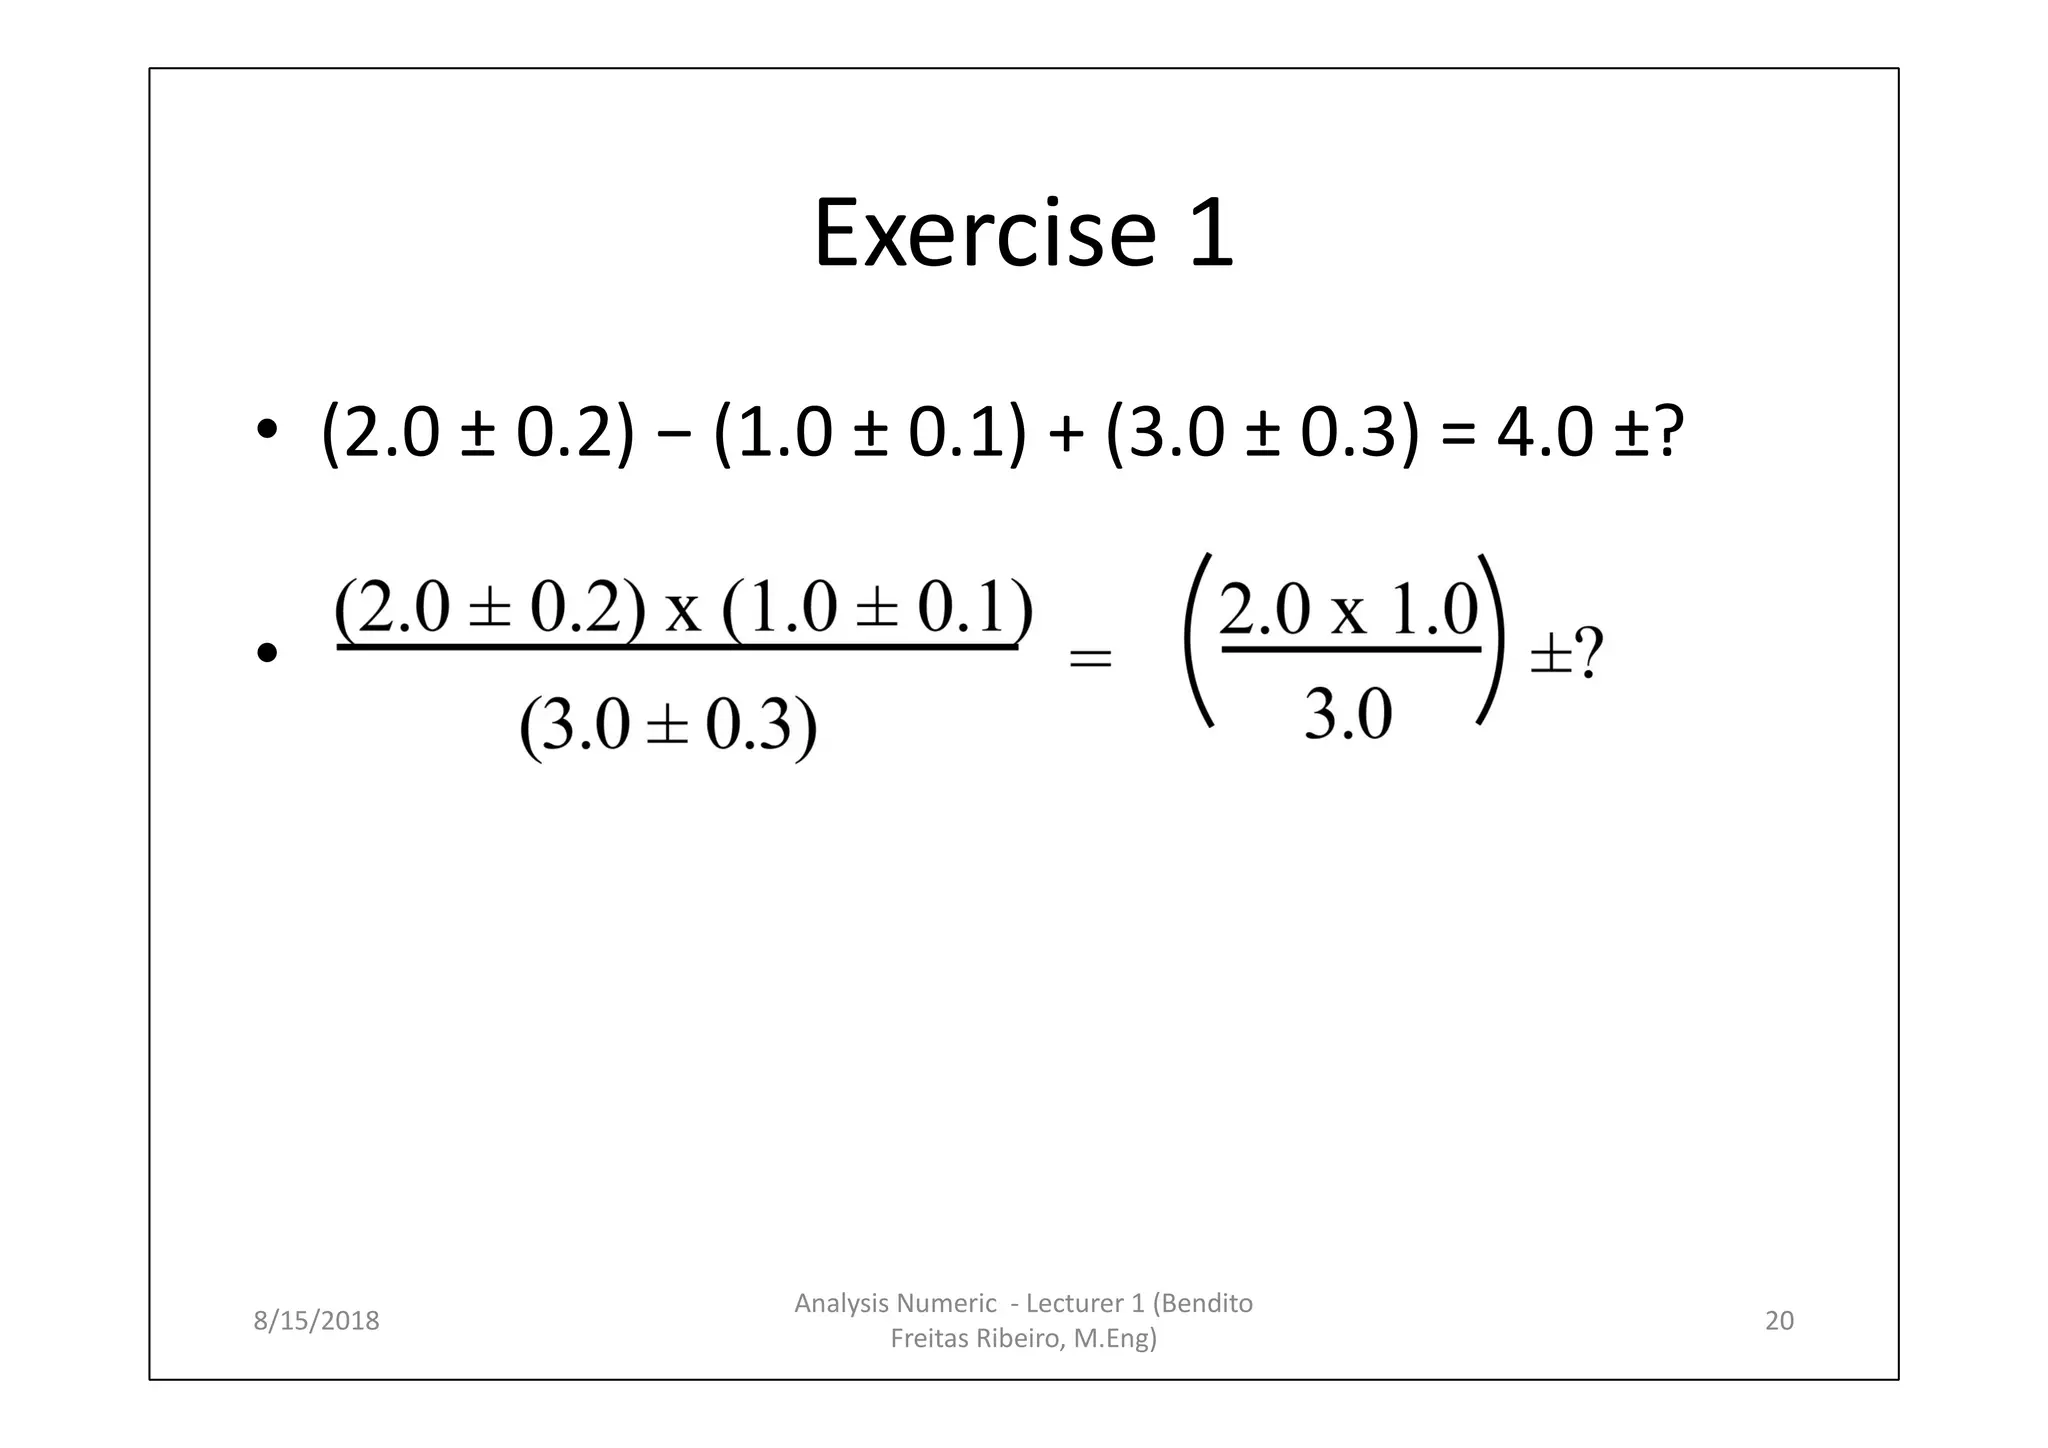
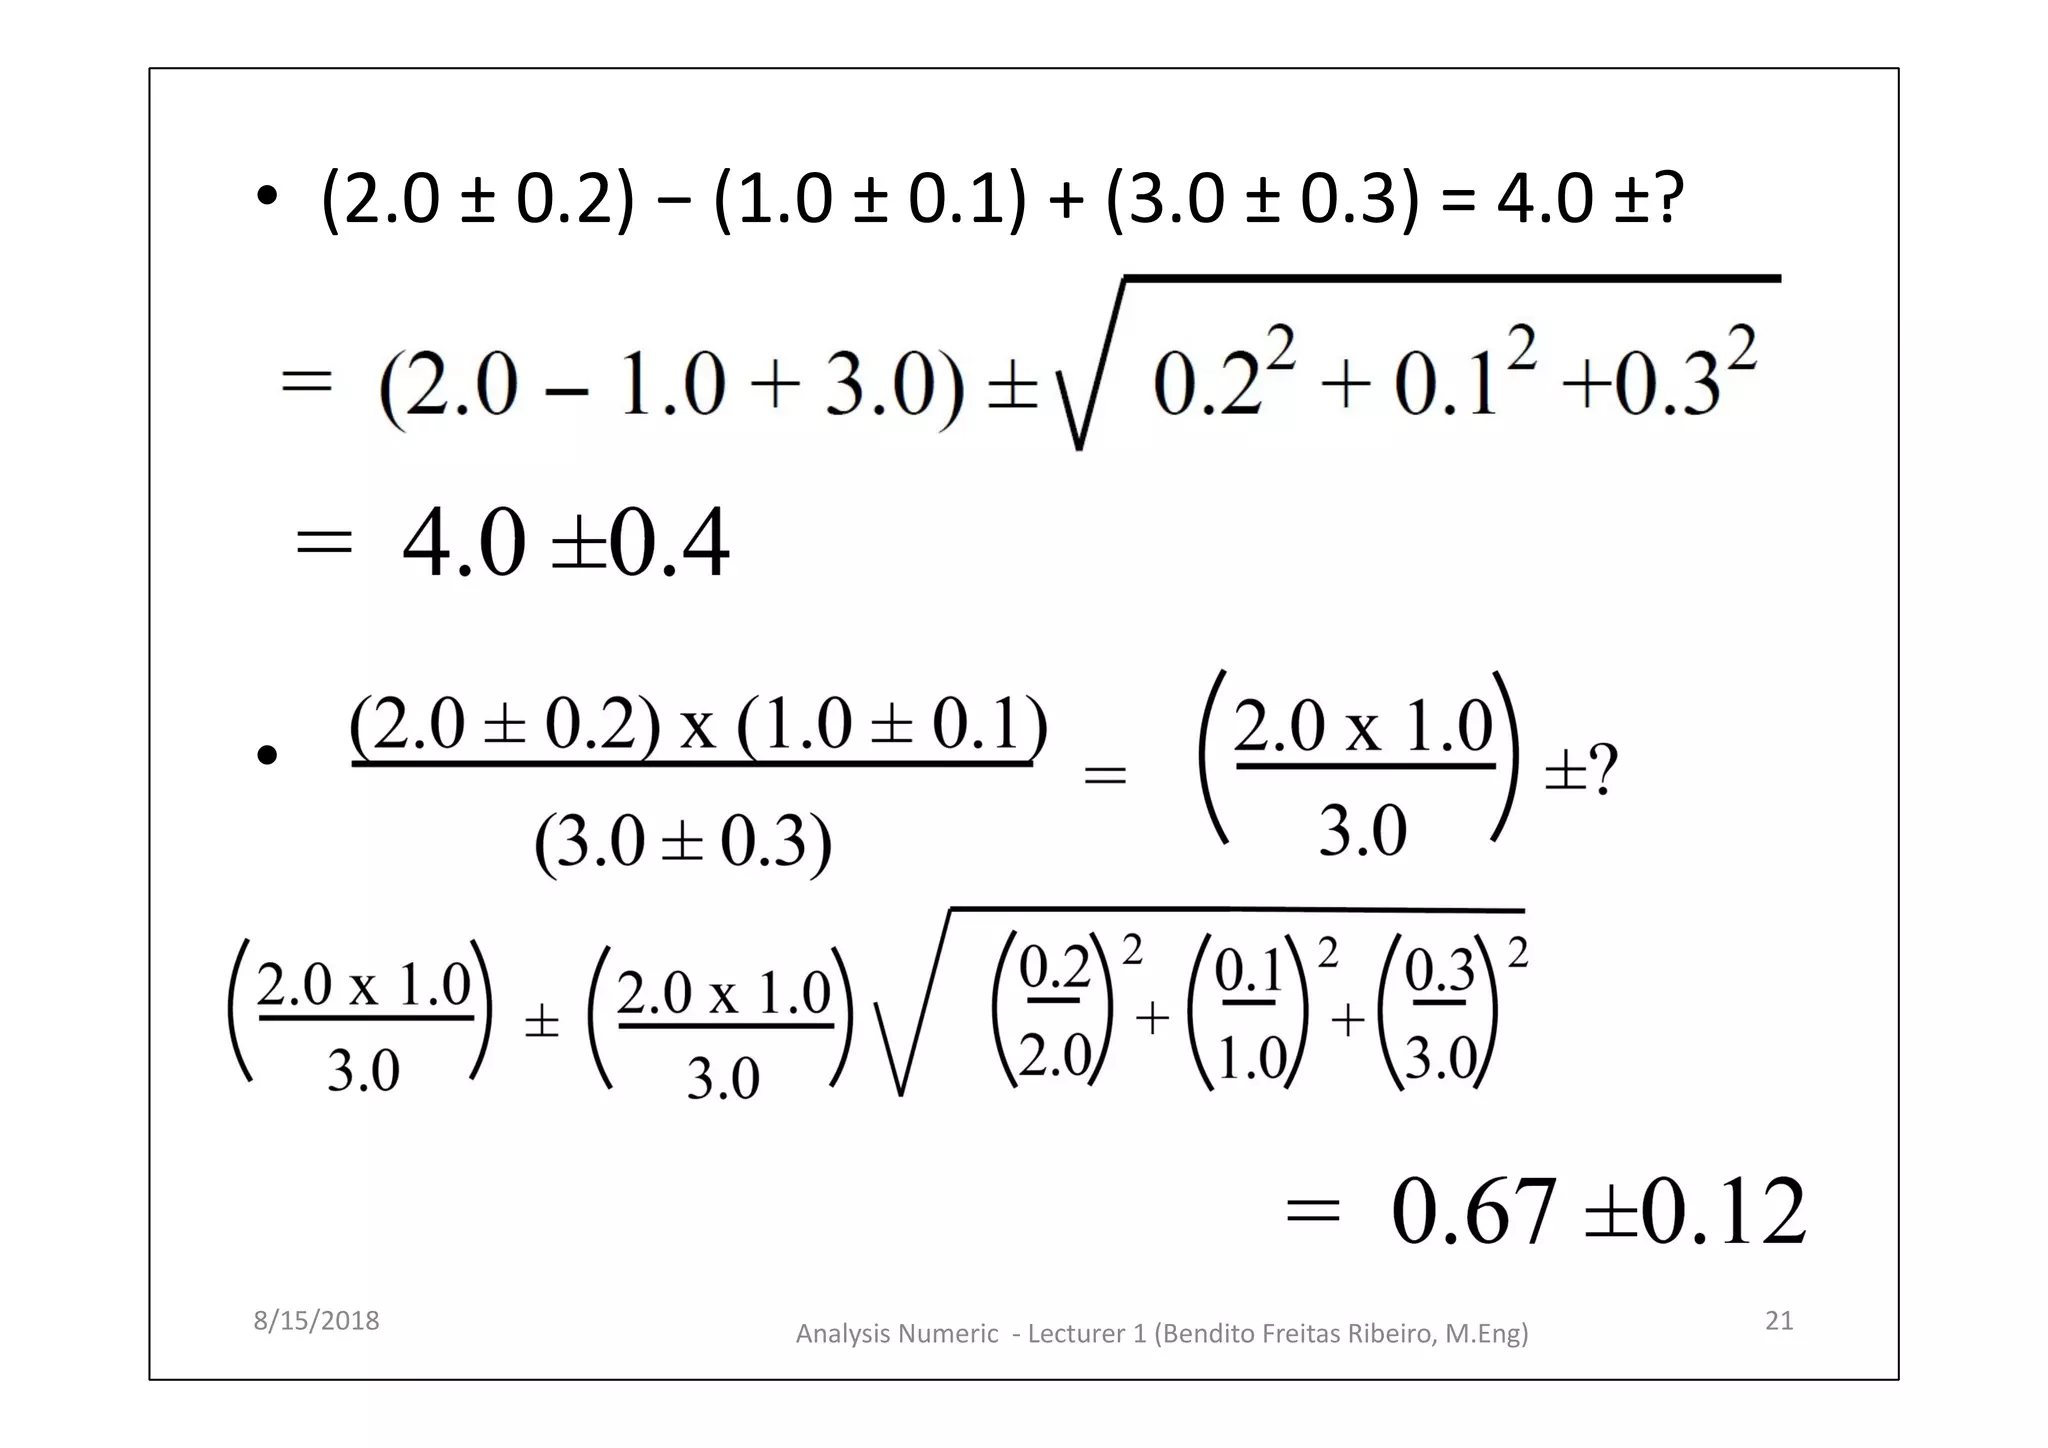

This document summarizes key concepts from a lecture on numerical analysis, including: - Definitions of precision, accuracy, and different types of errors like random, systematic, and gross errors. - How to calculate average deviation, standard deviation, and percent error to quantify precision and accuracy. - Formulas and examples for propagating error in mathematical operations like addition, subtraction, multiplication and division. - An example error propagation exercise calculating the standard deviation of a sum of measurements.


