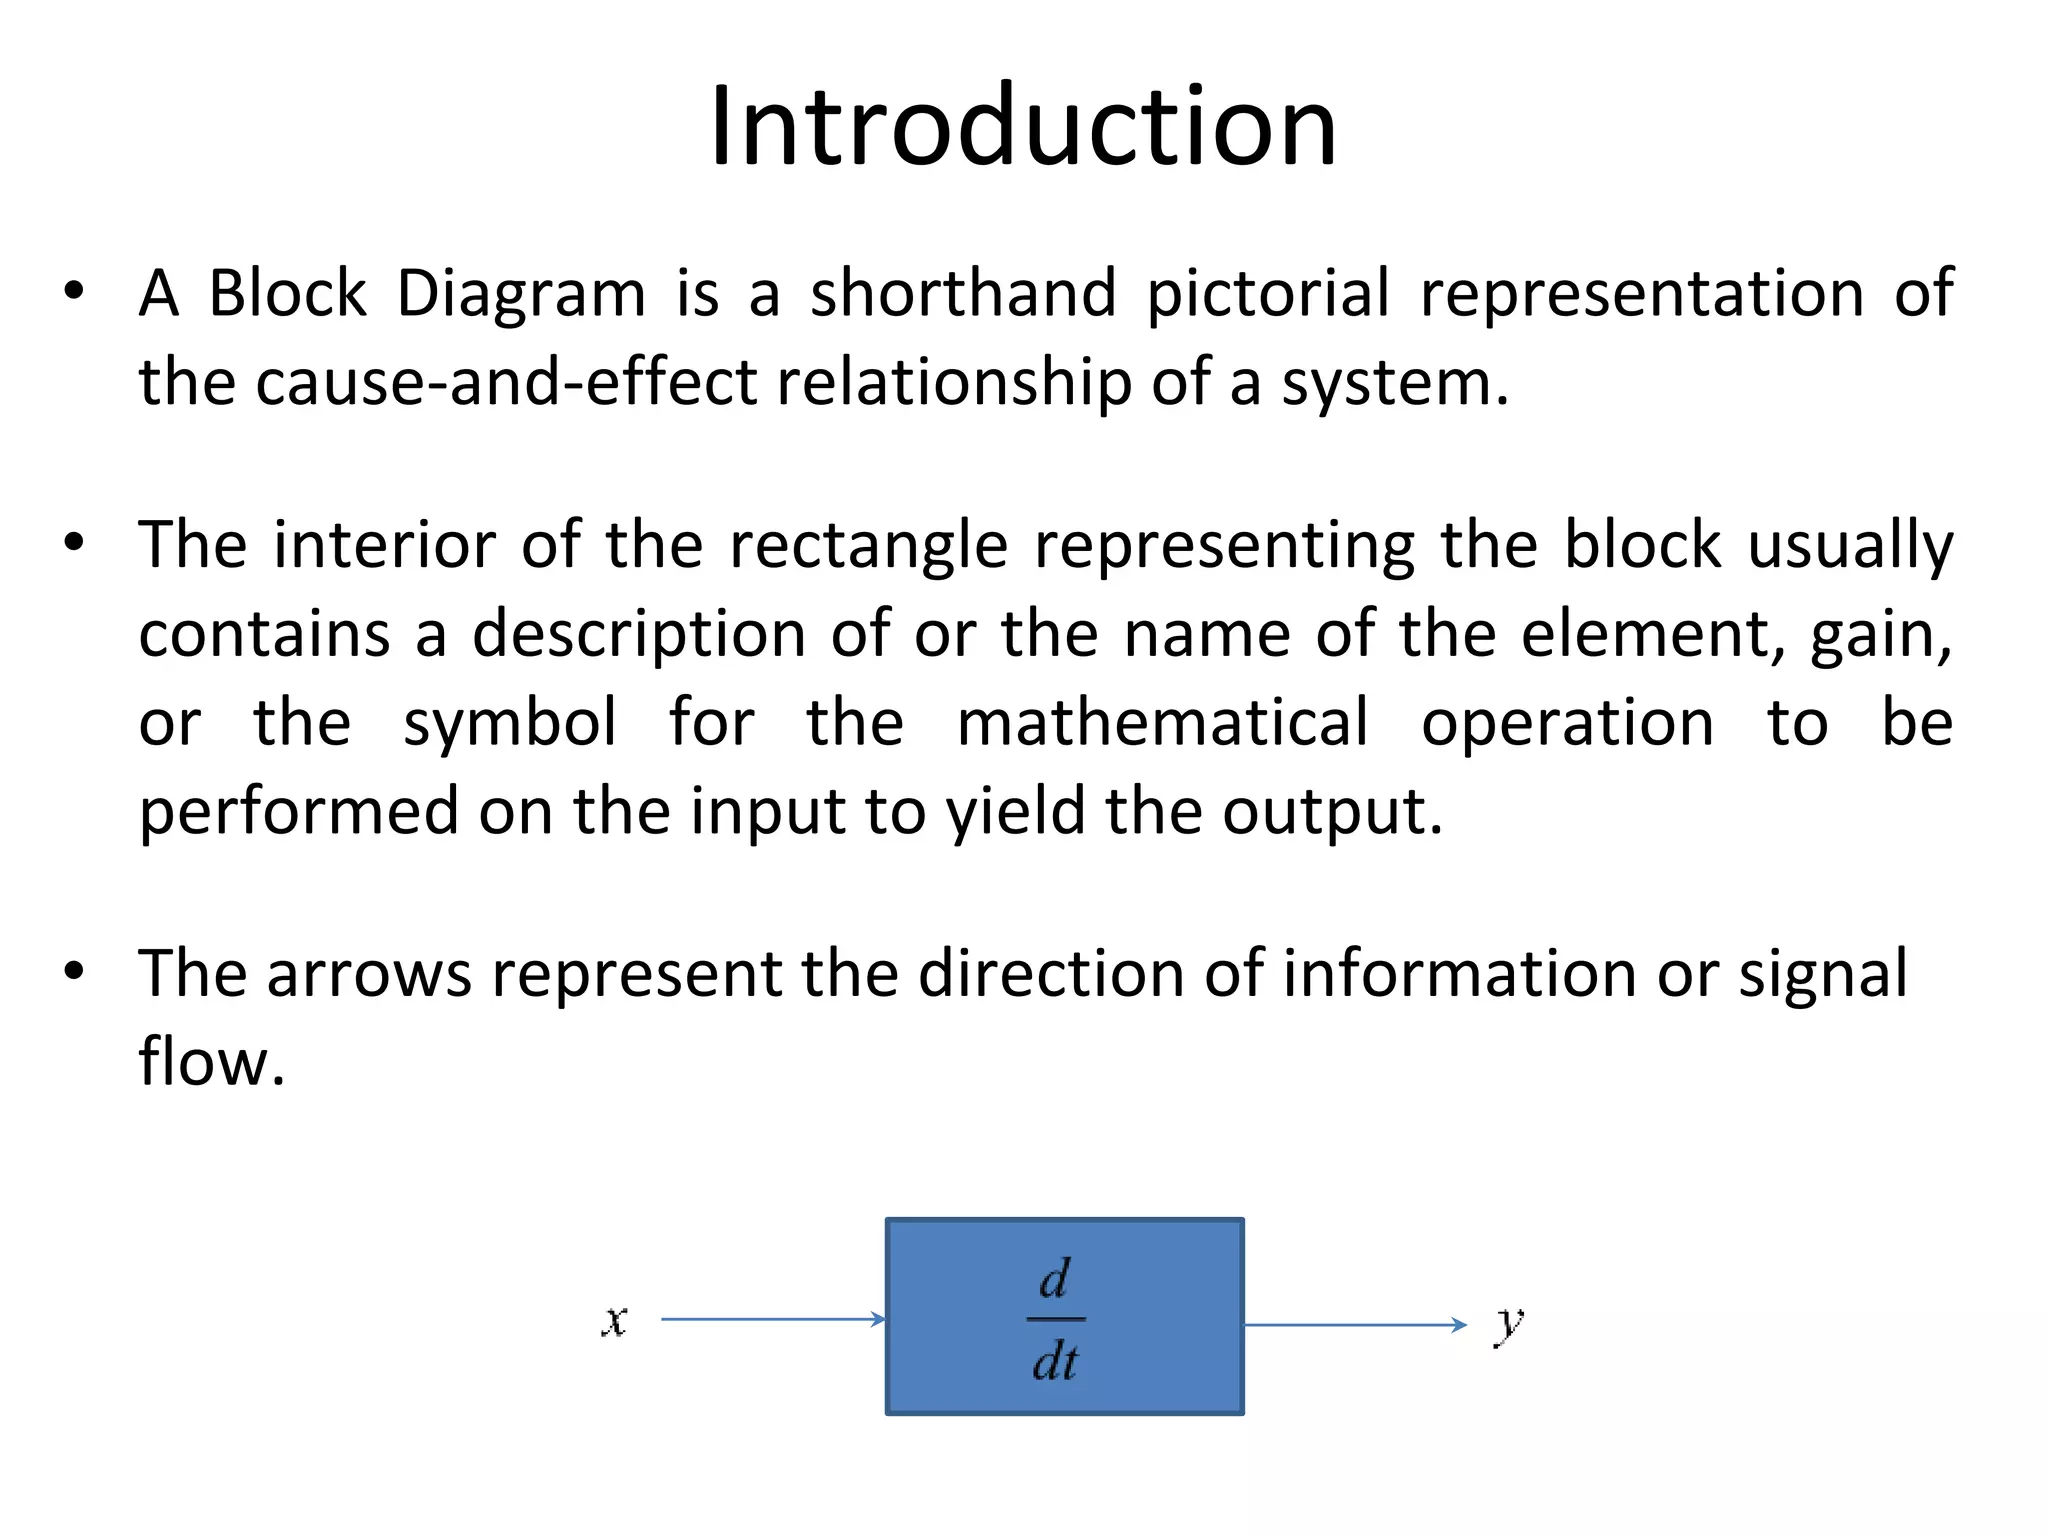
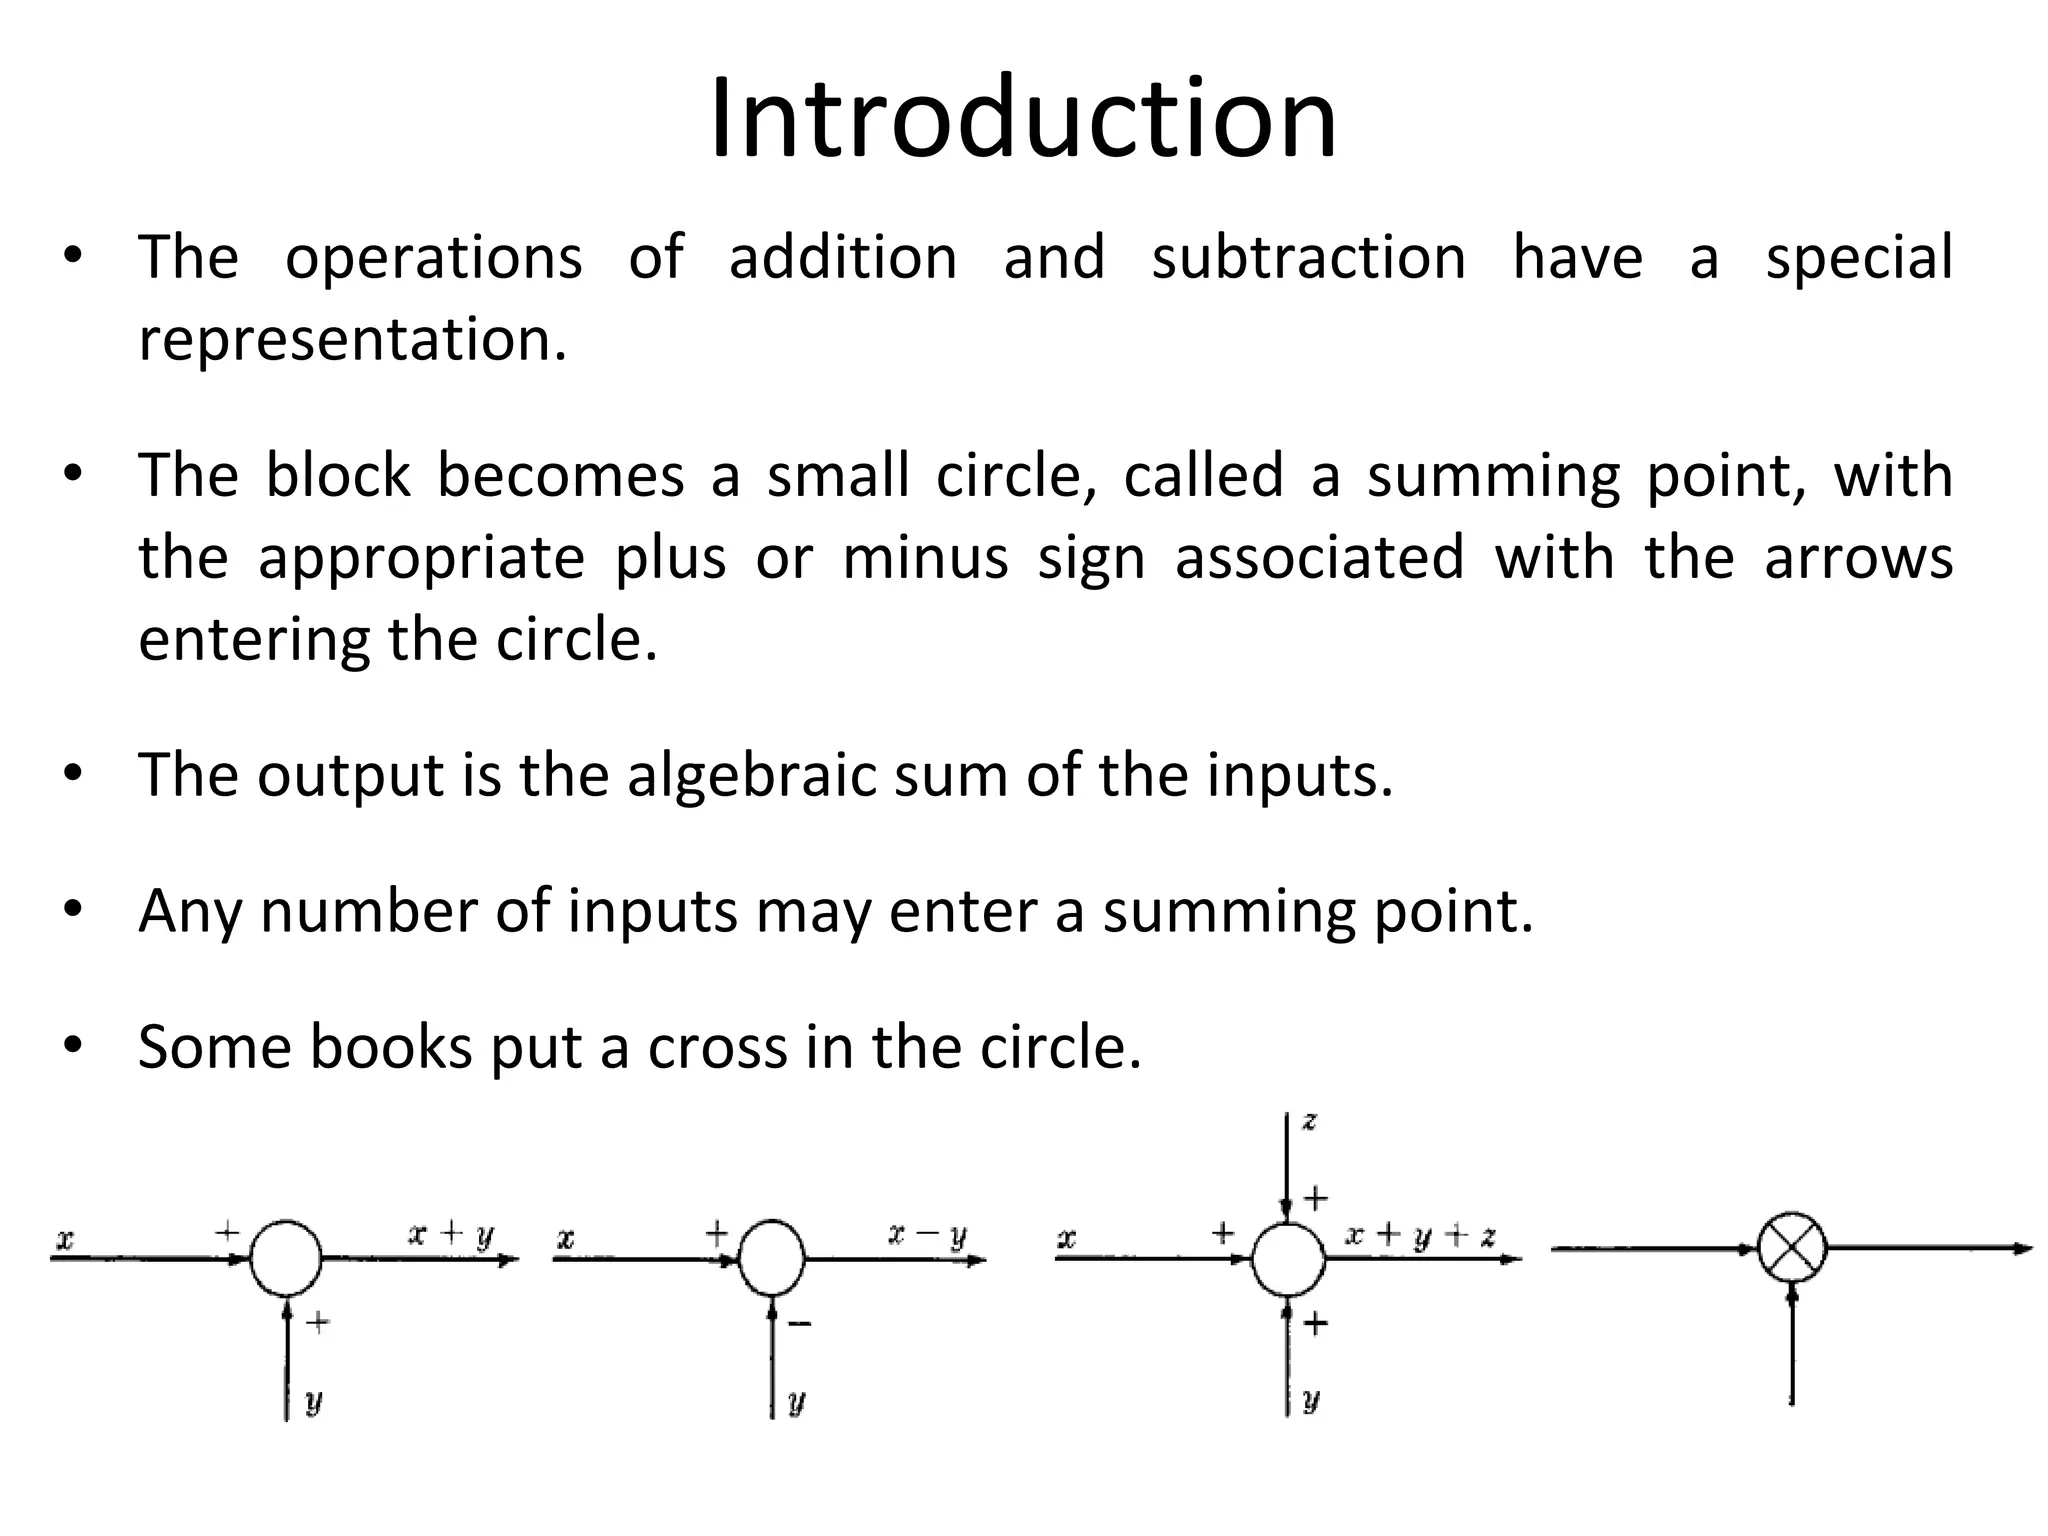
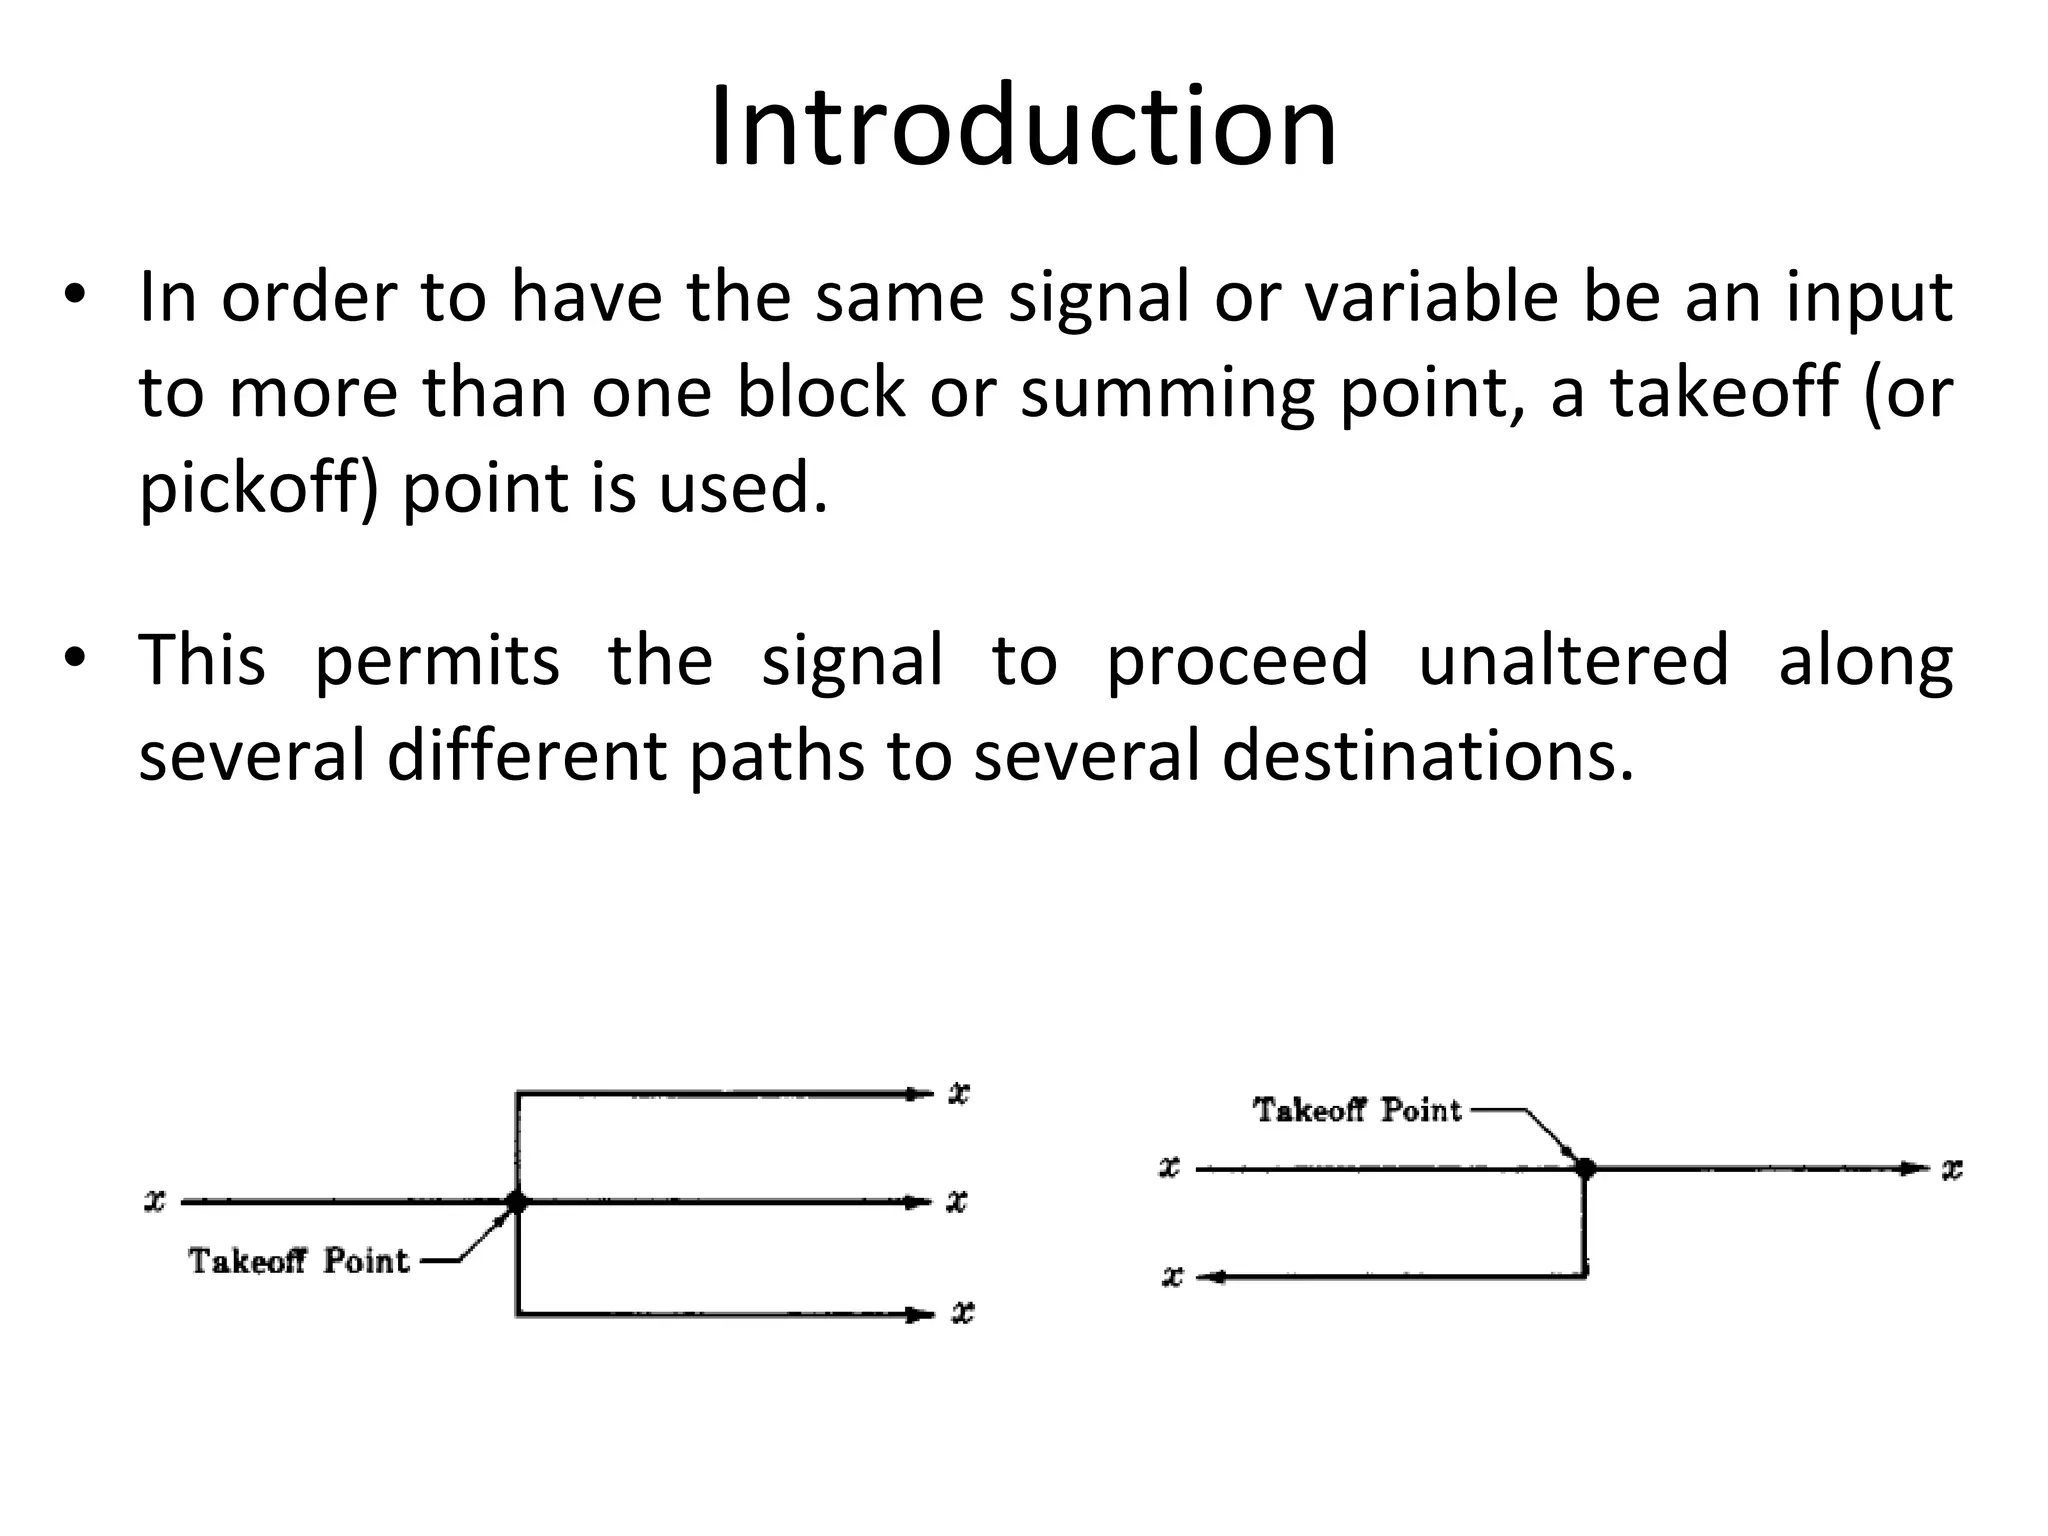
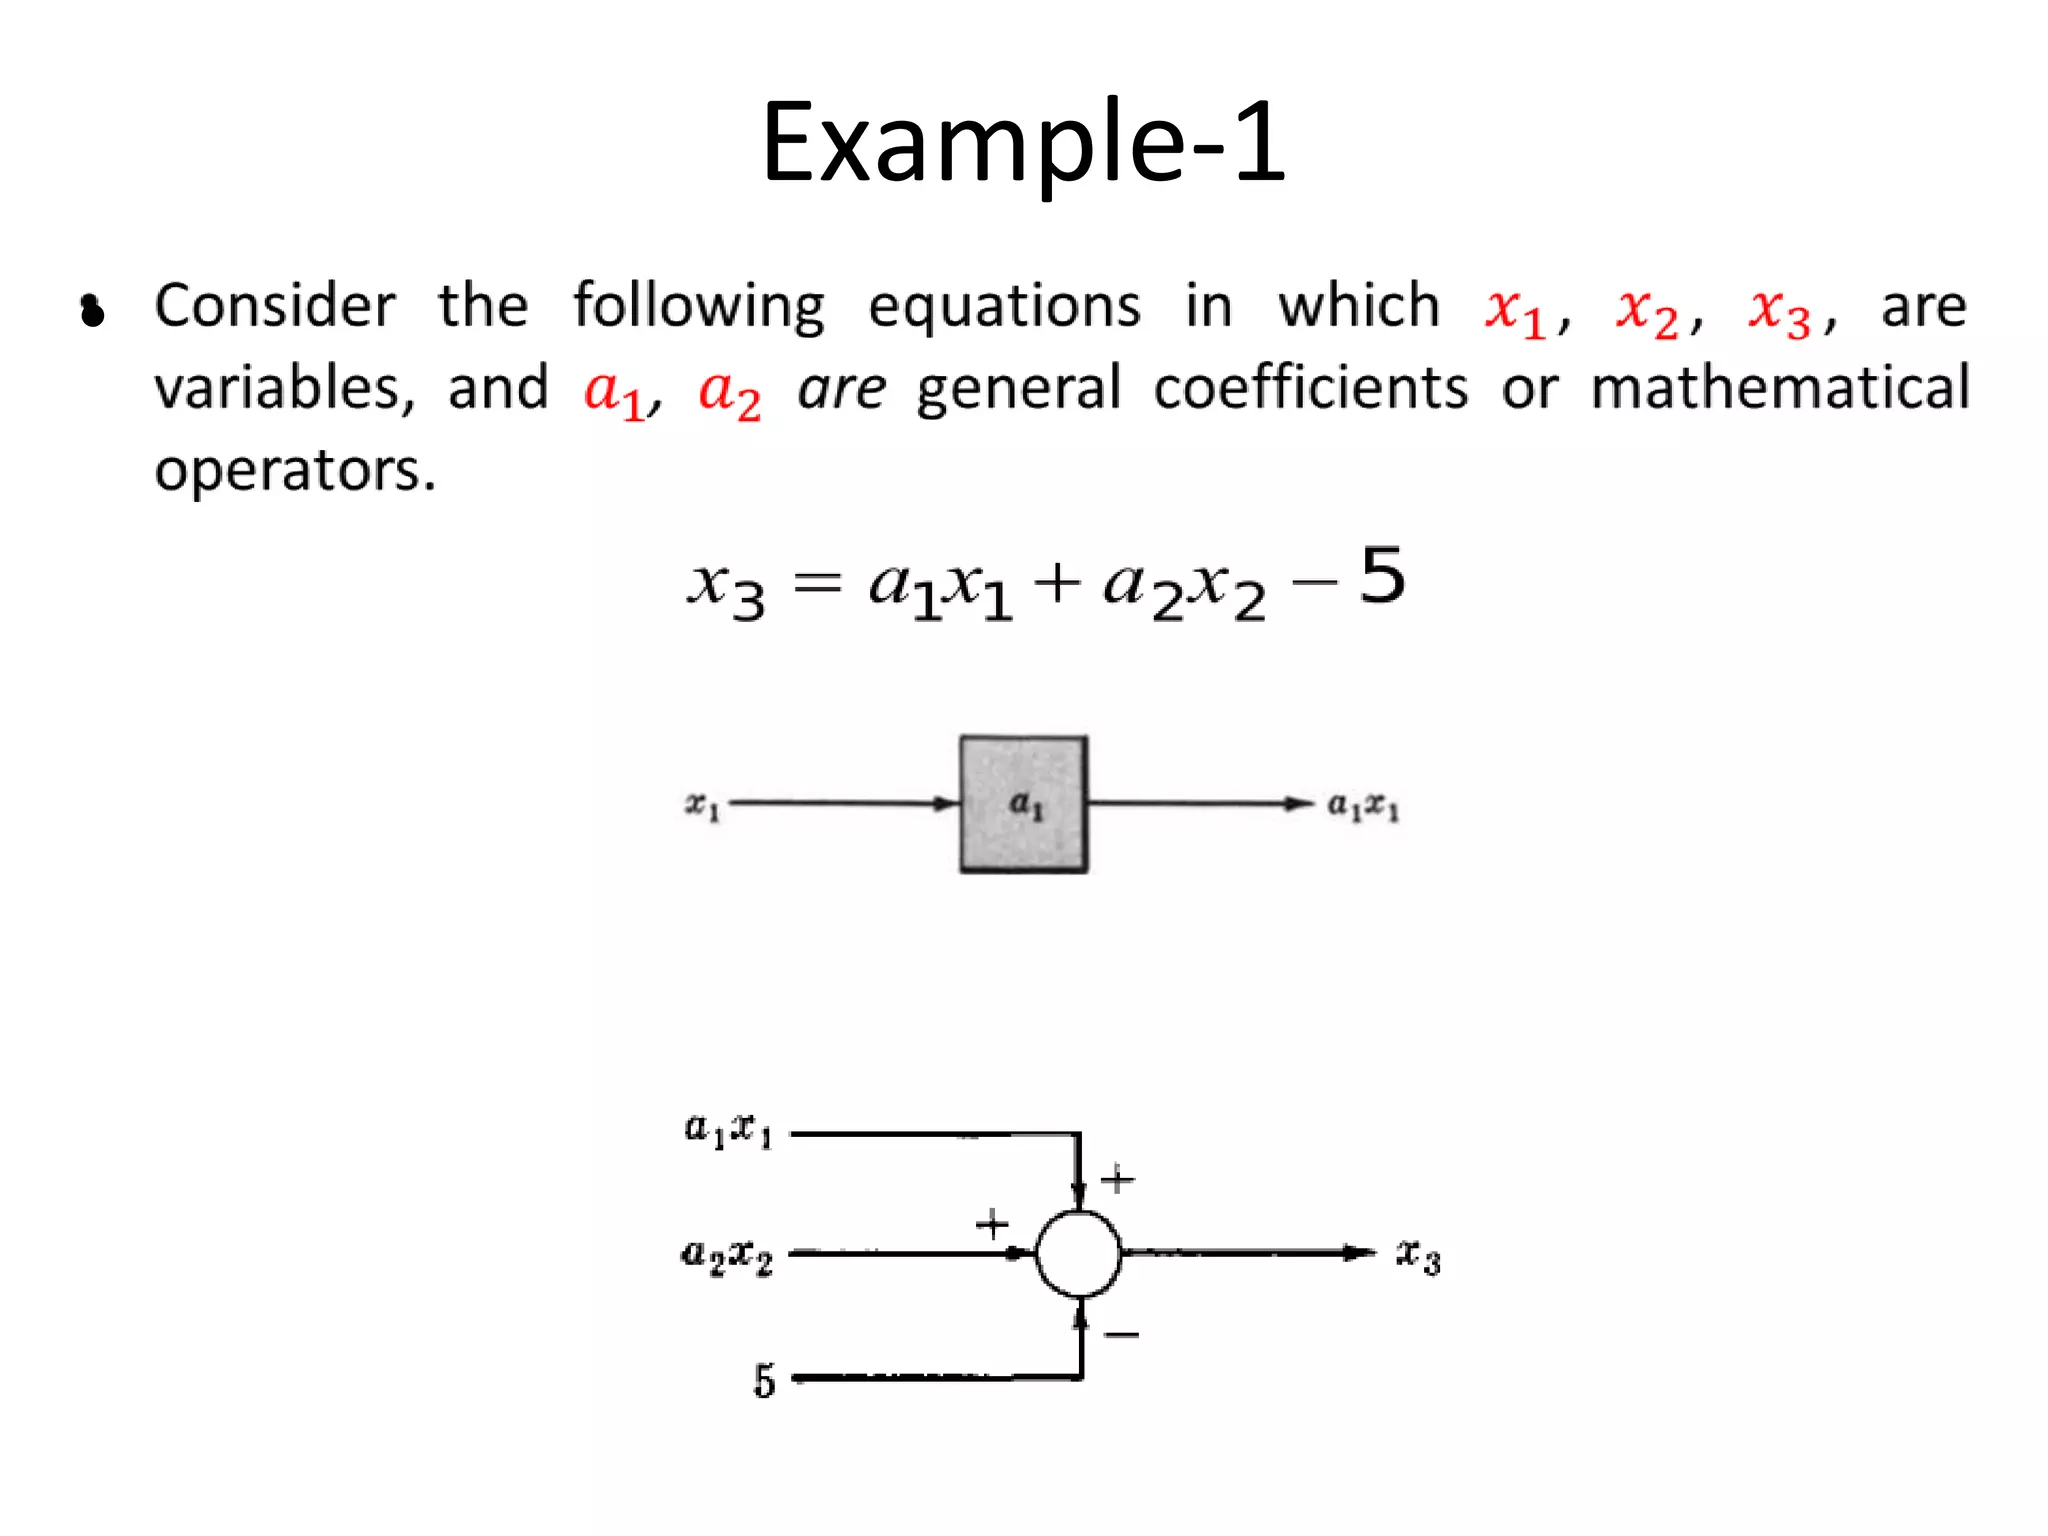
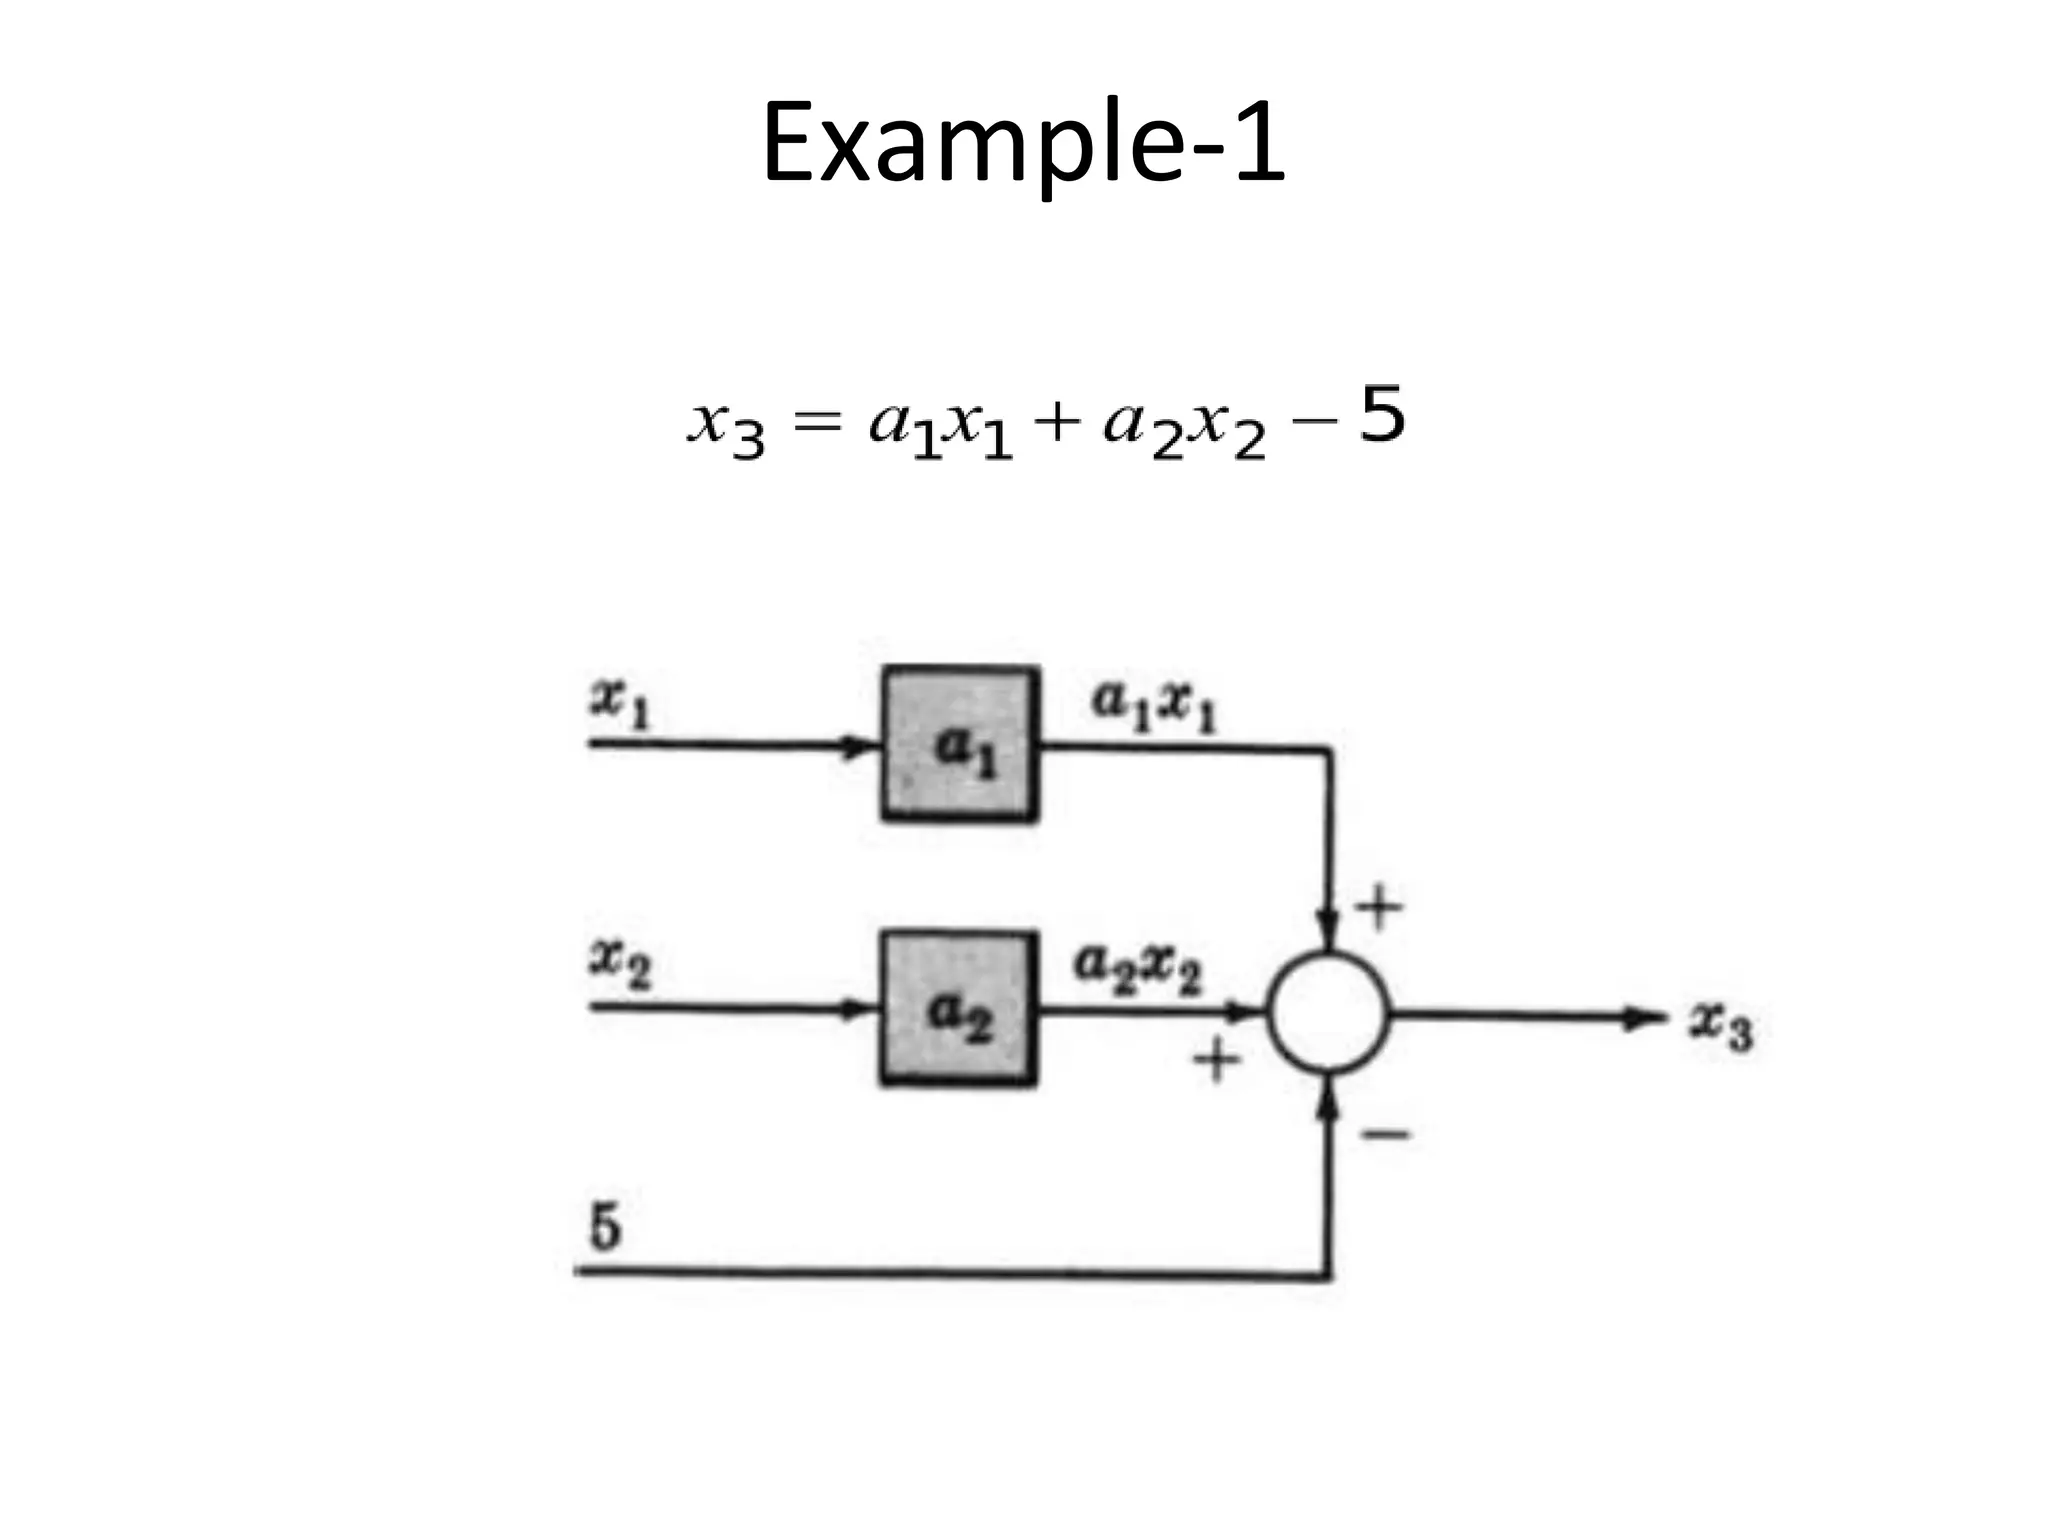
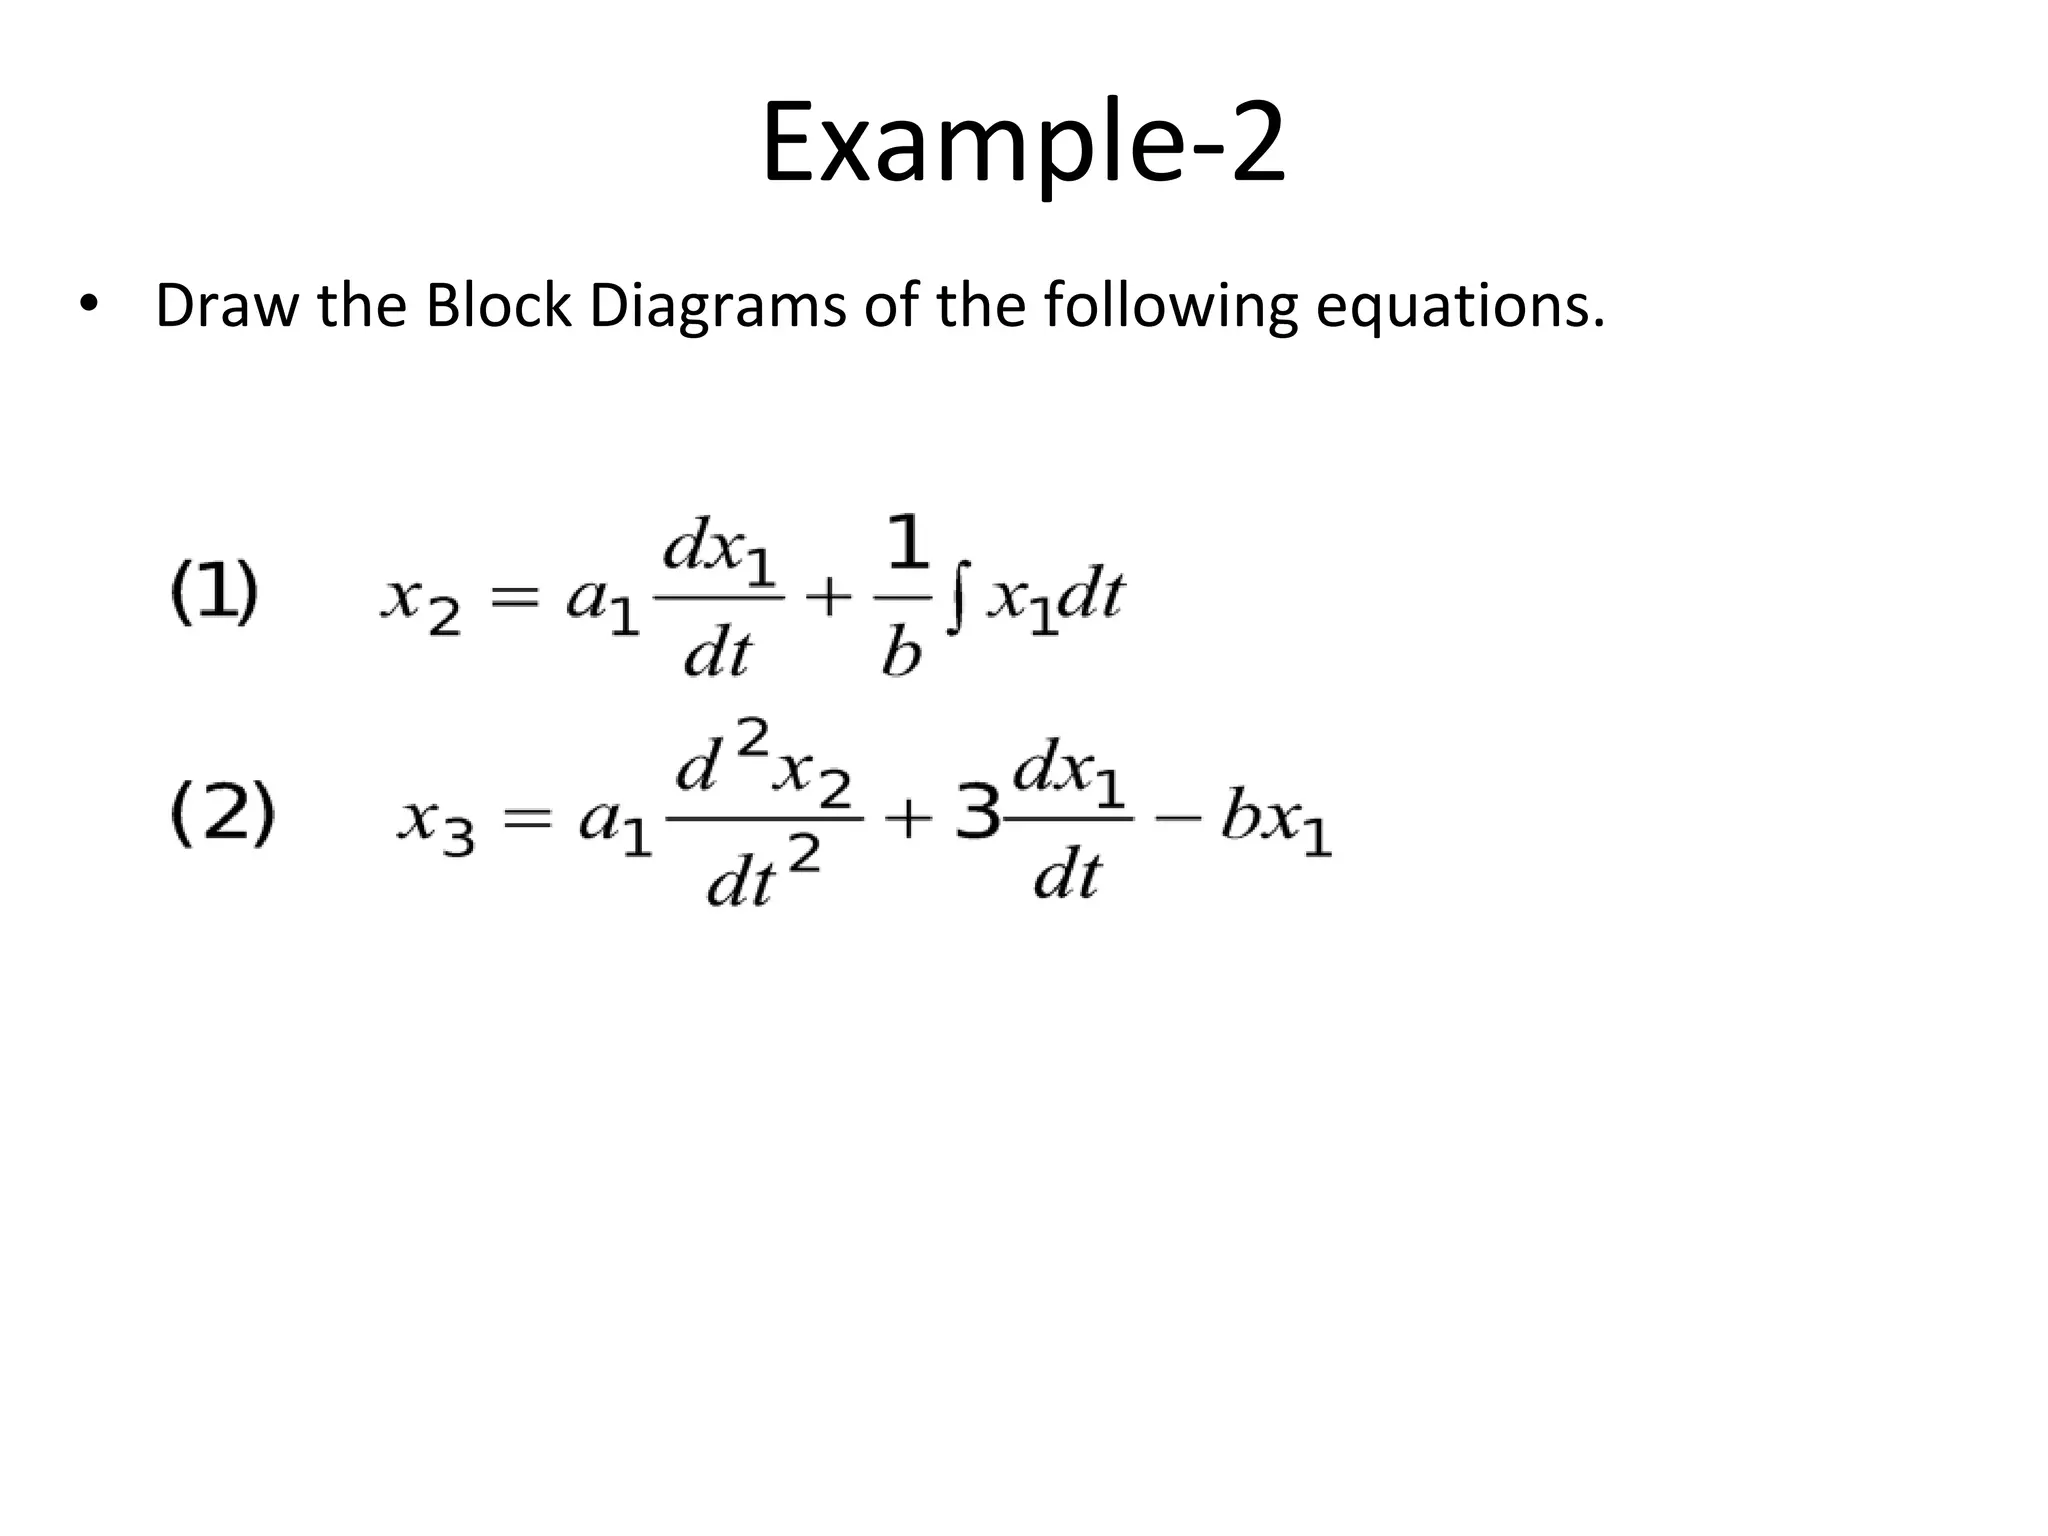
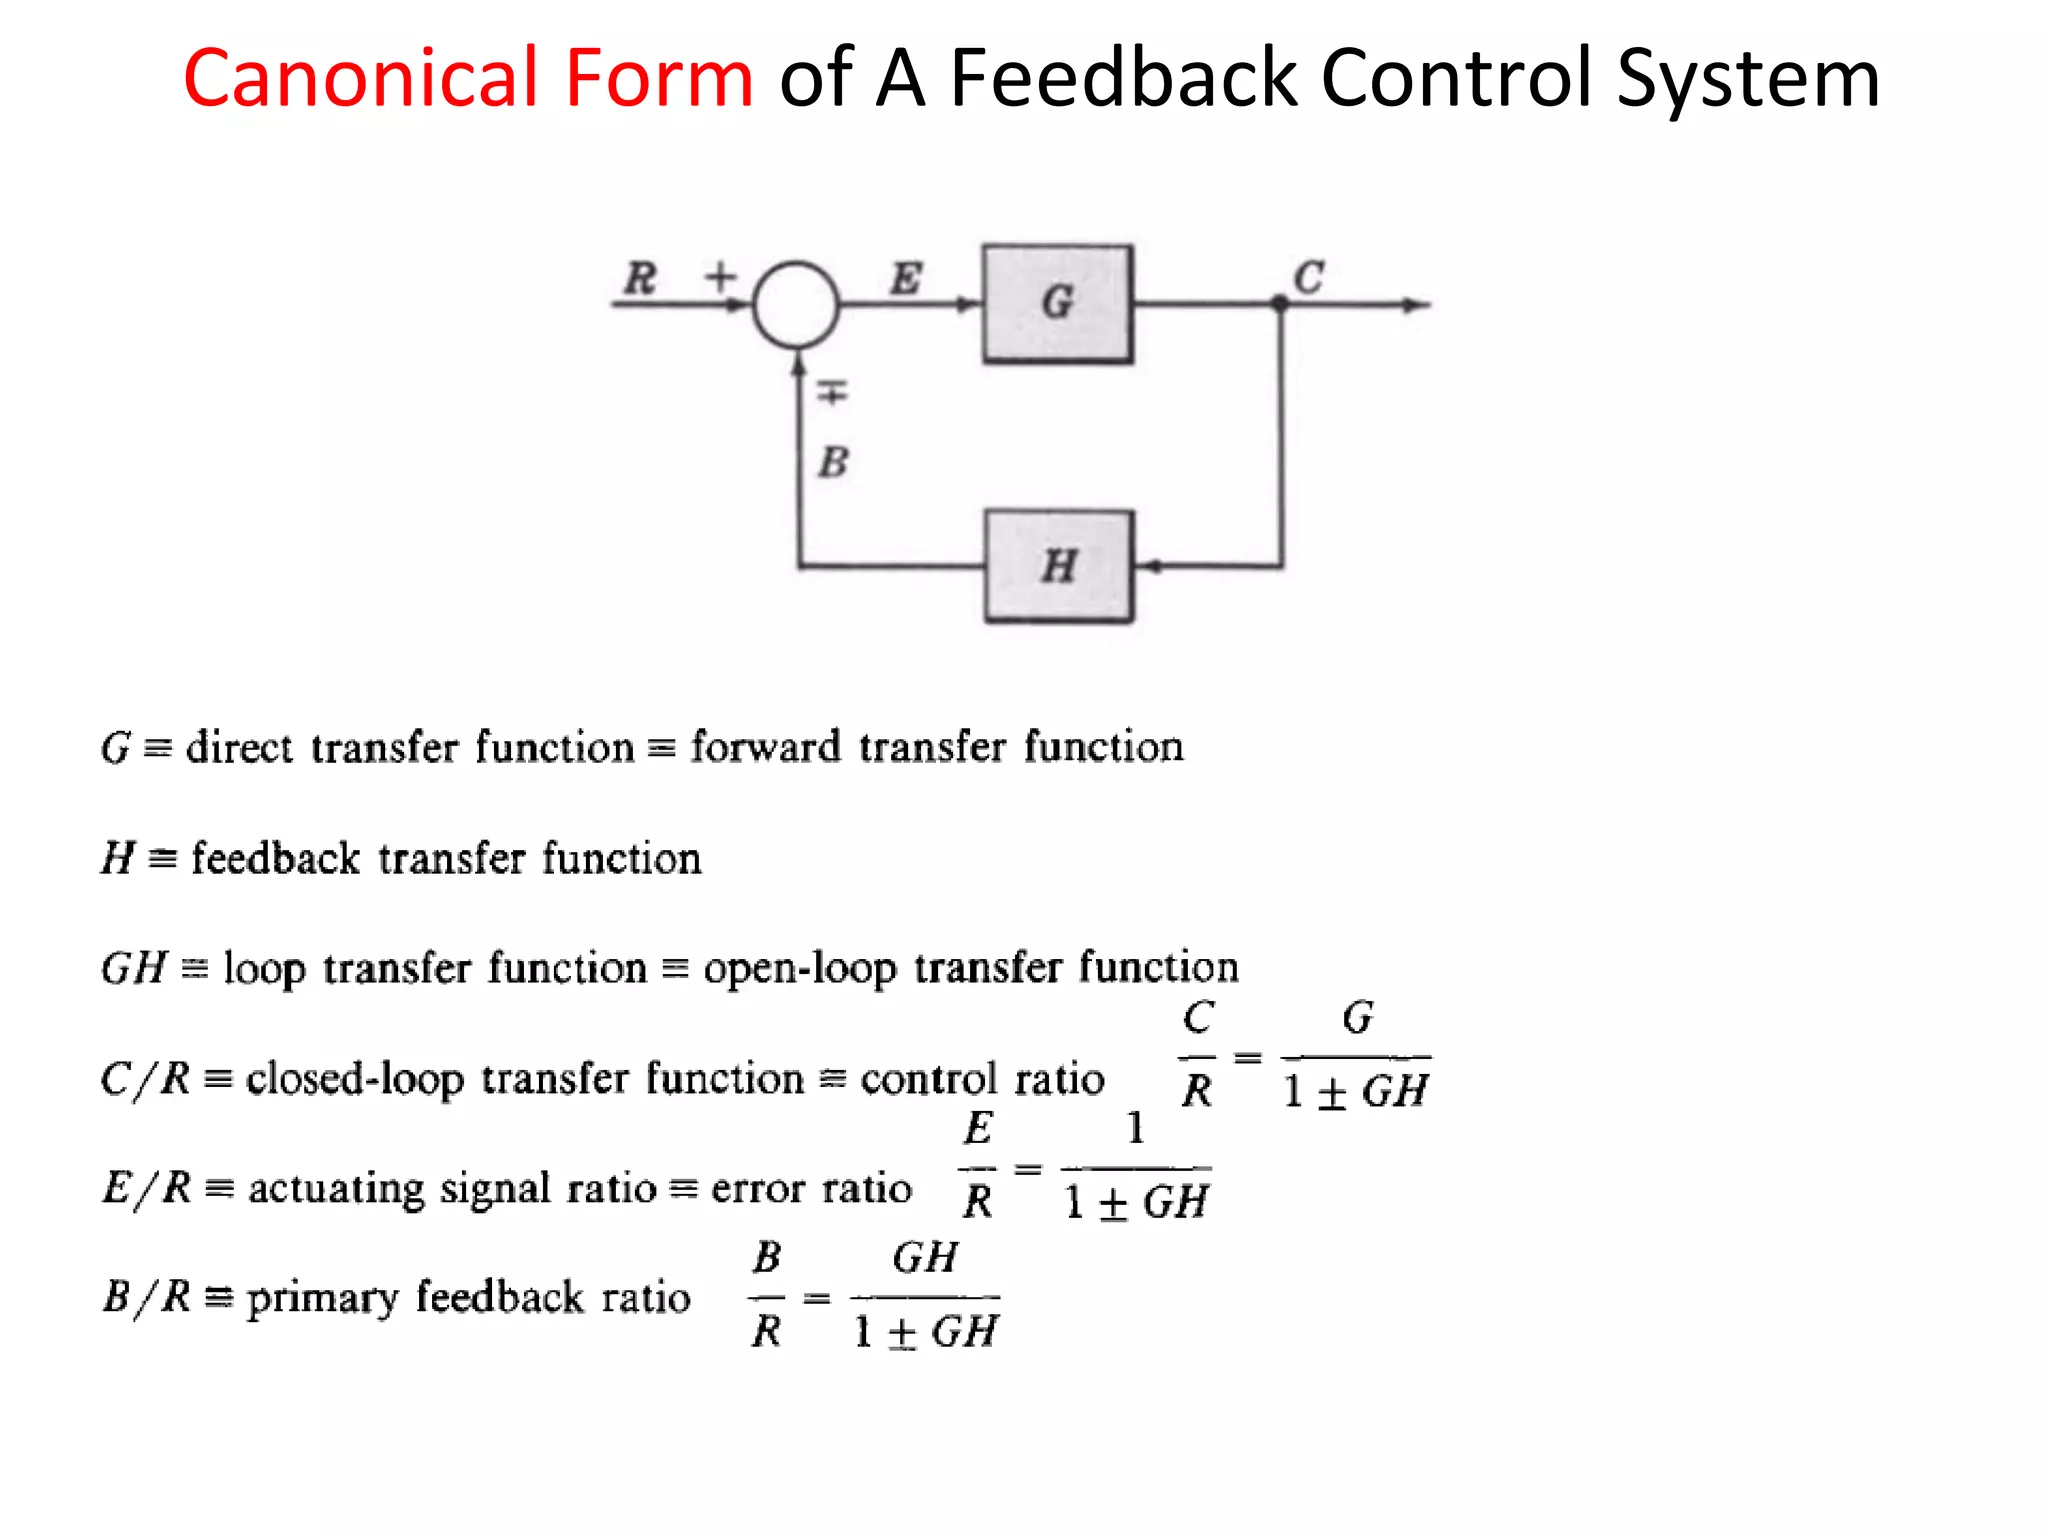
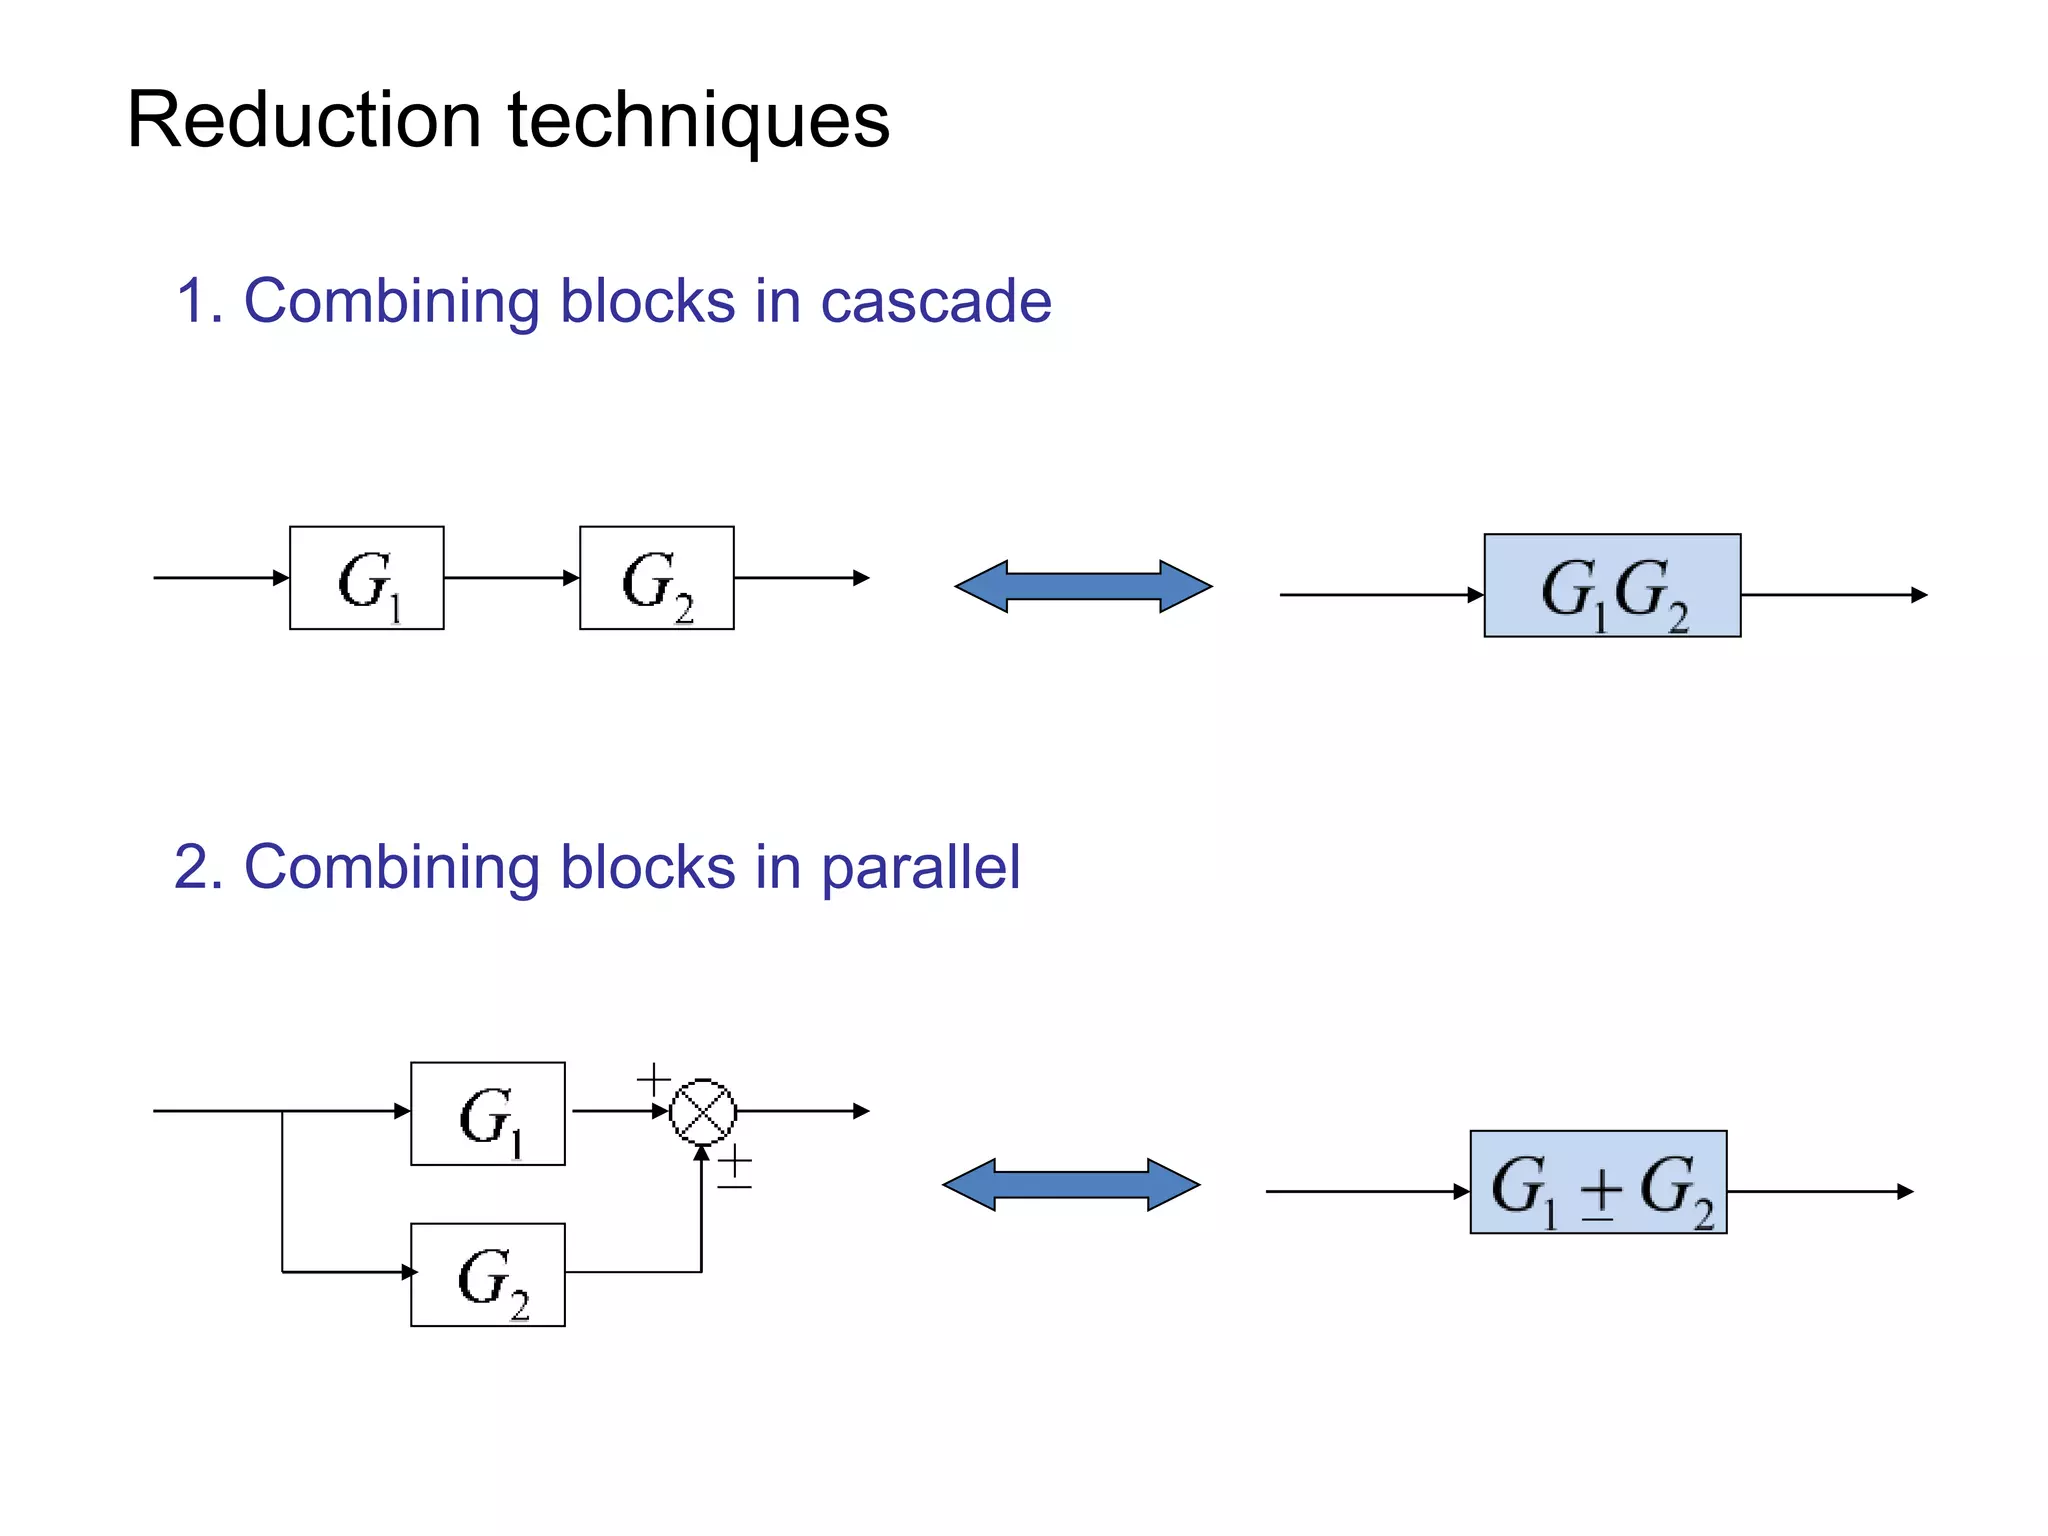
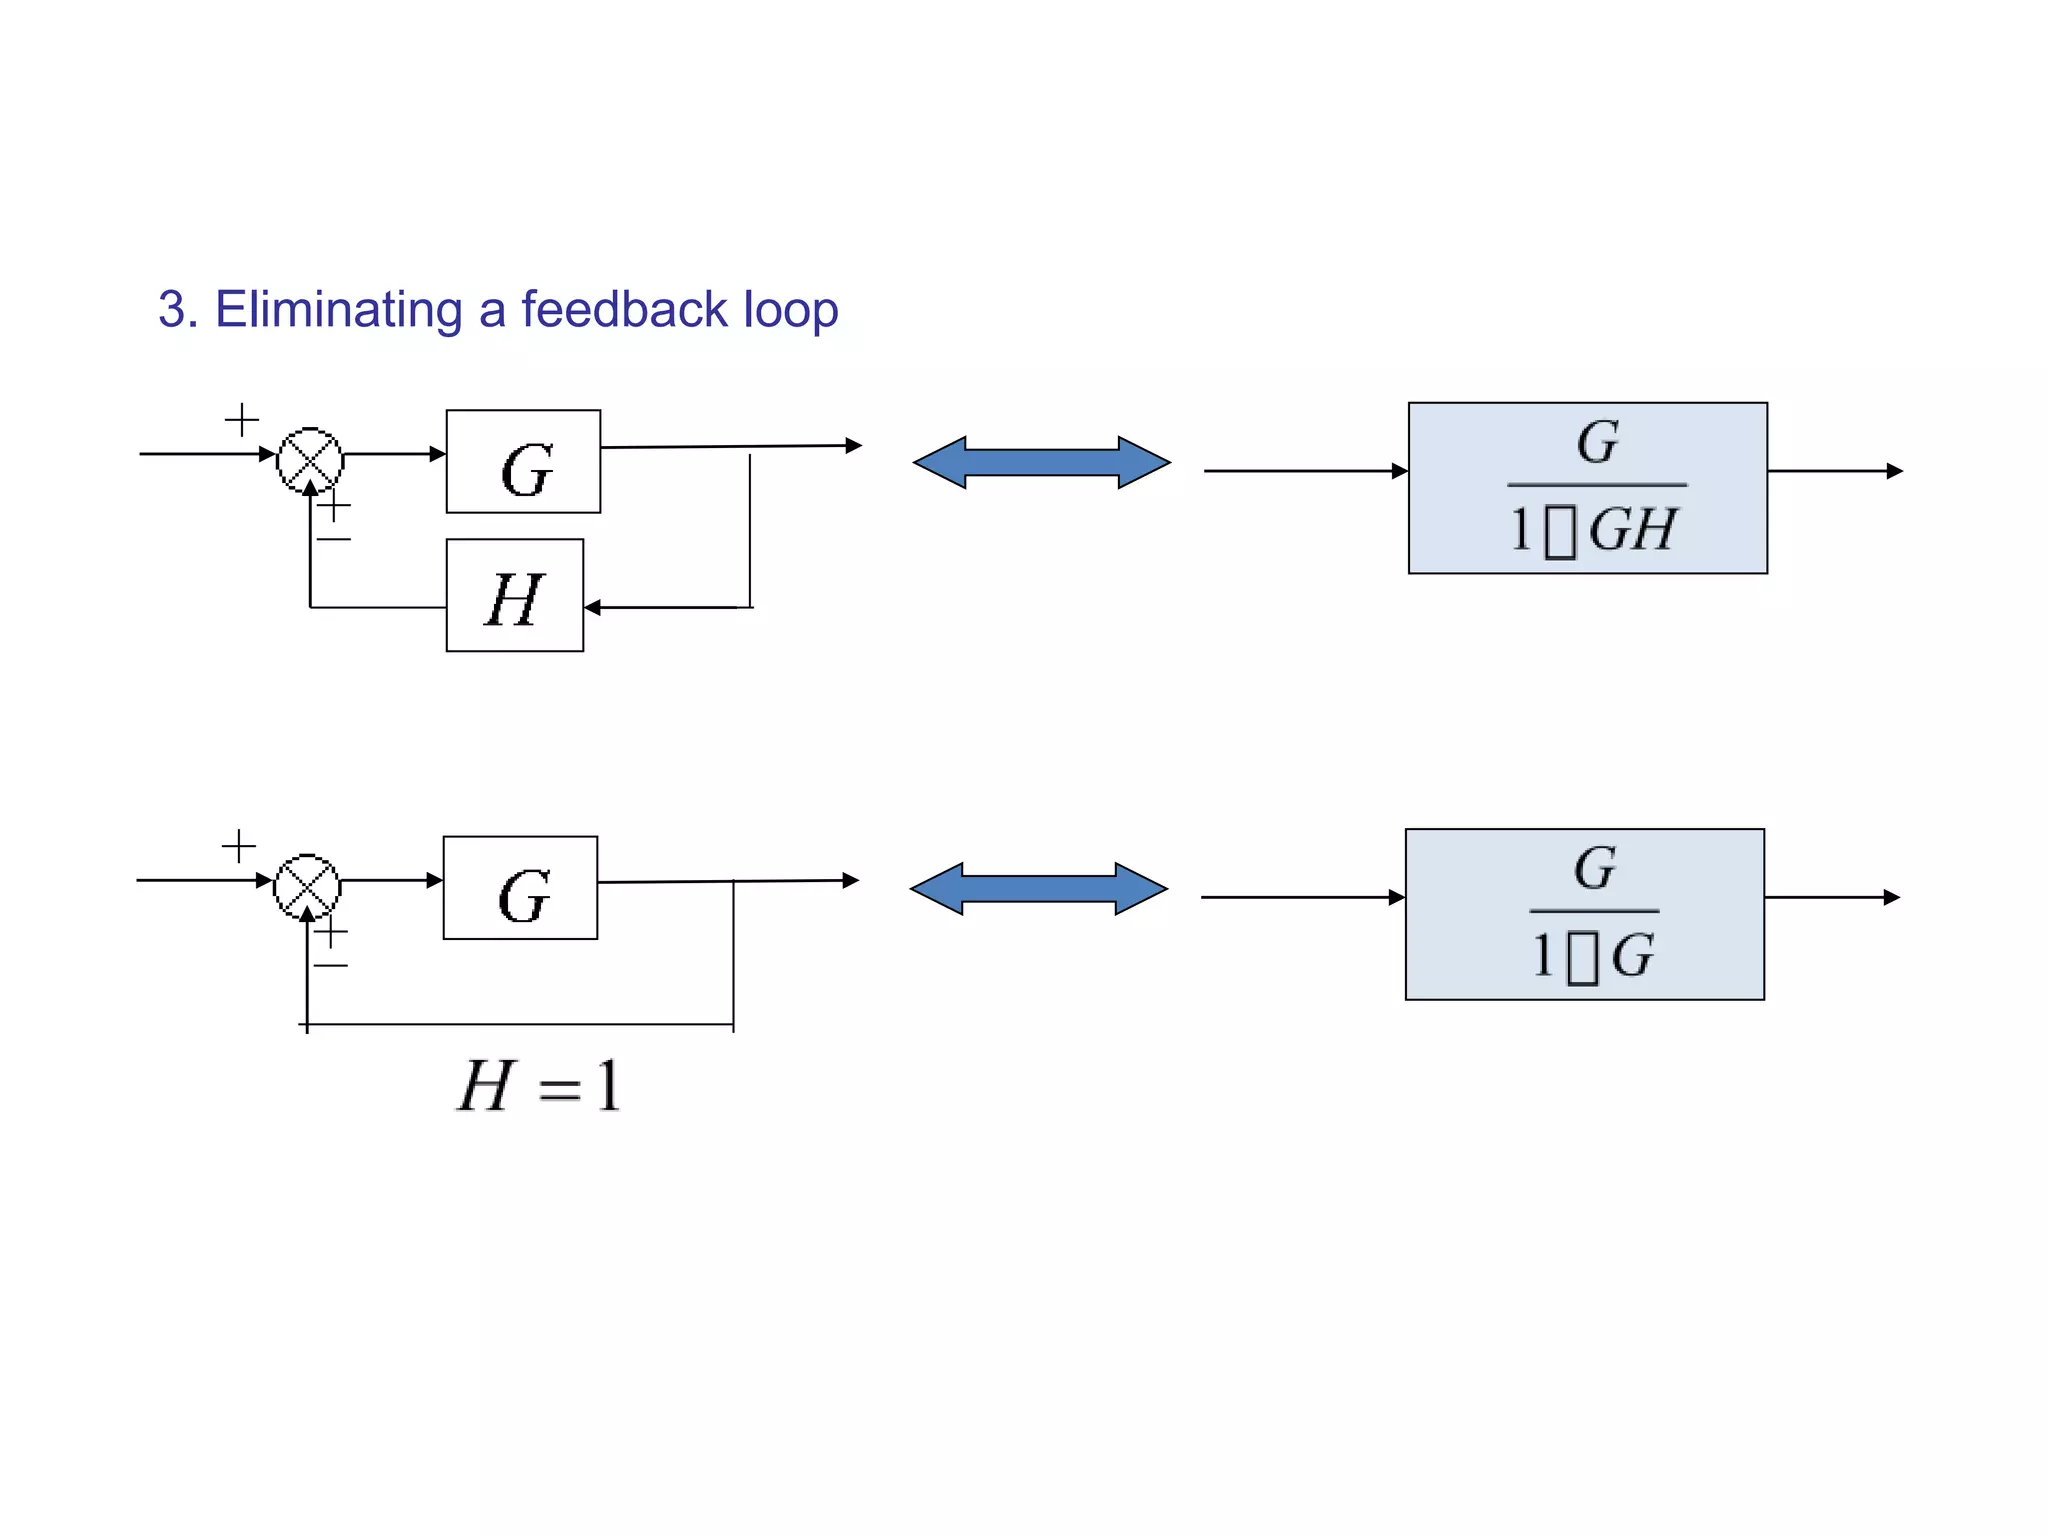
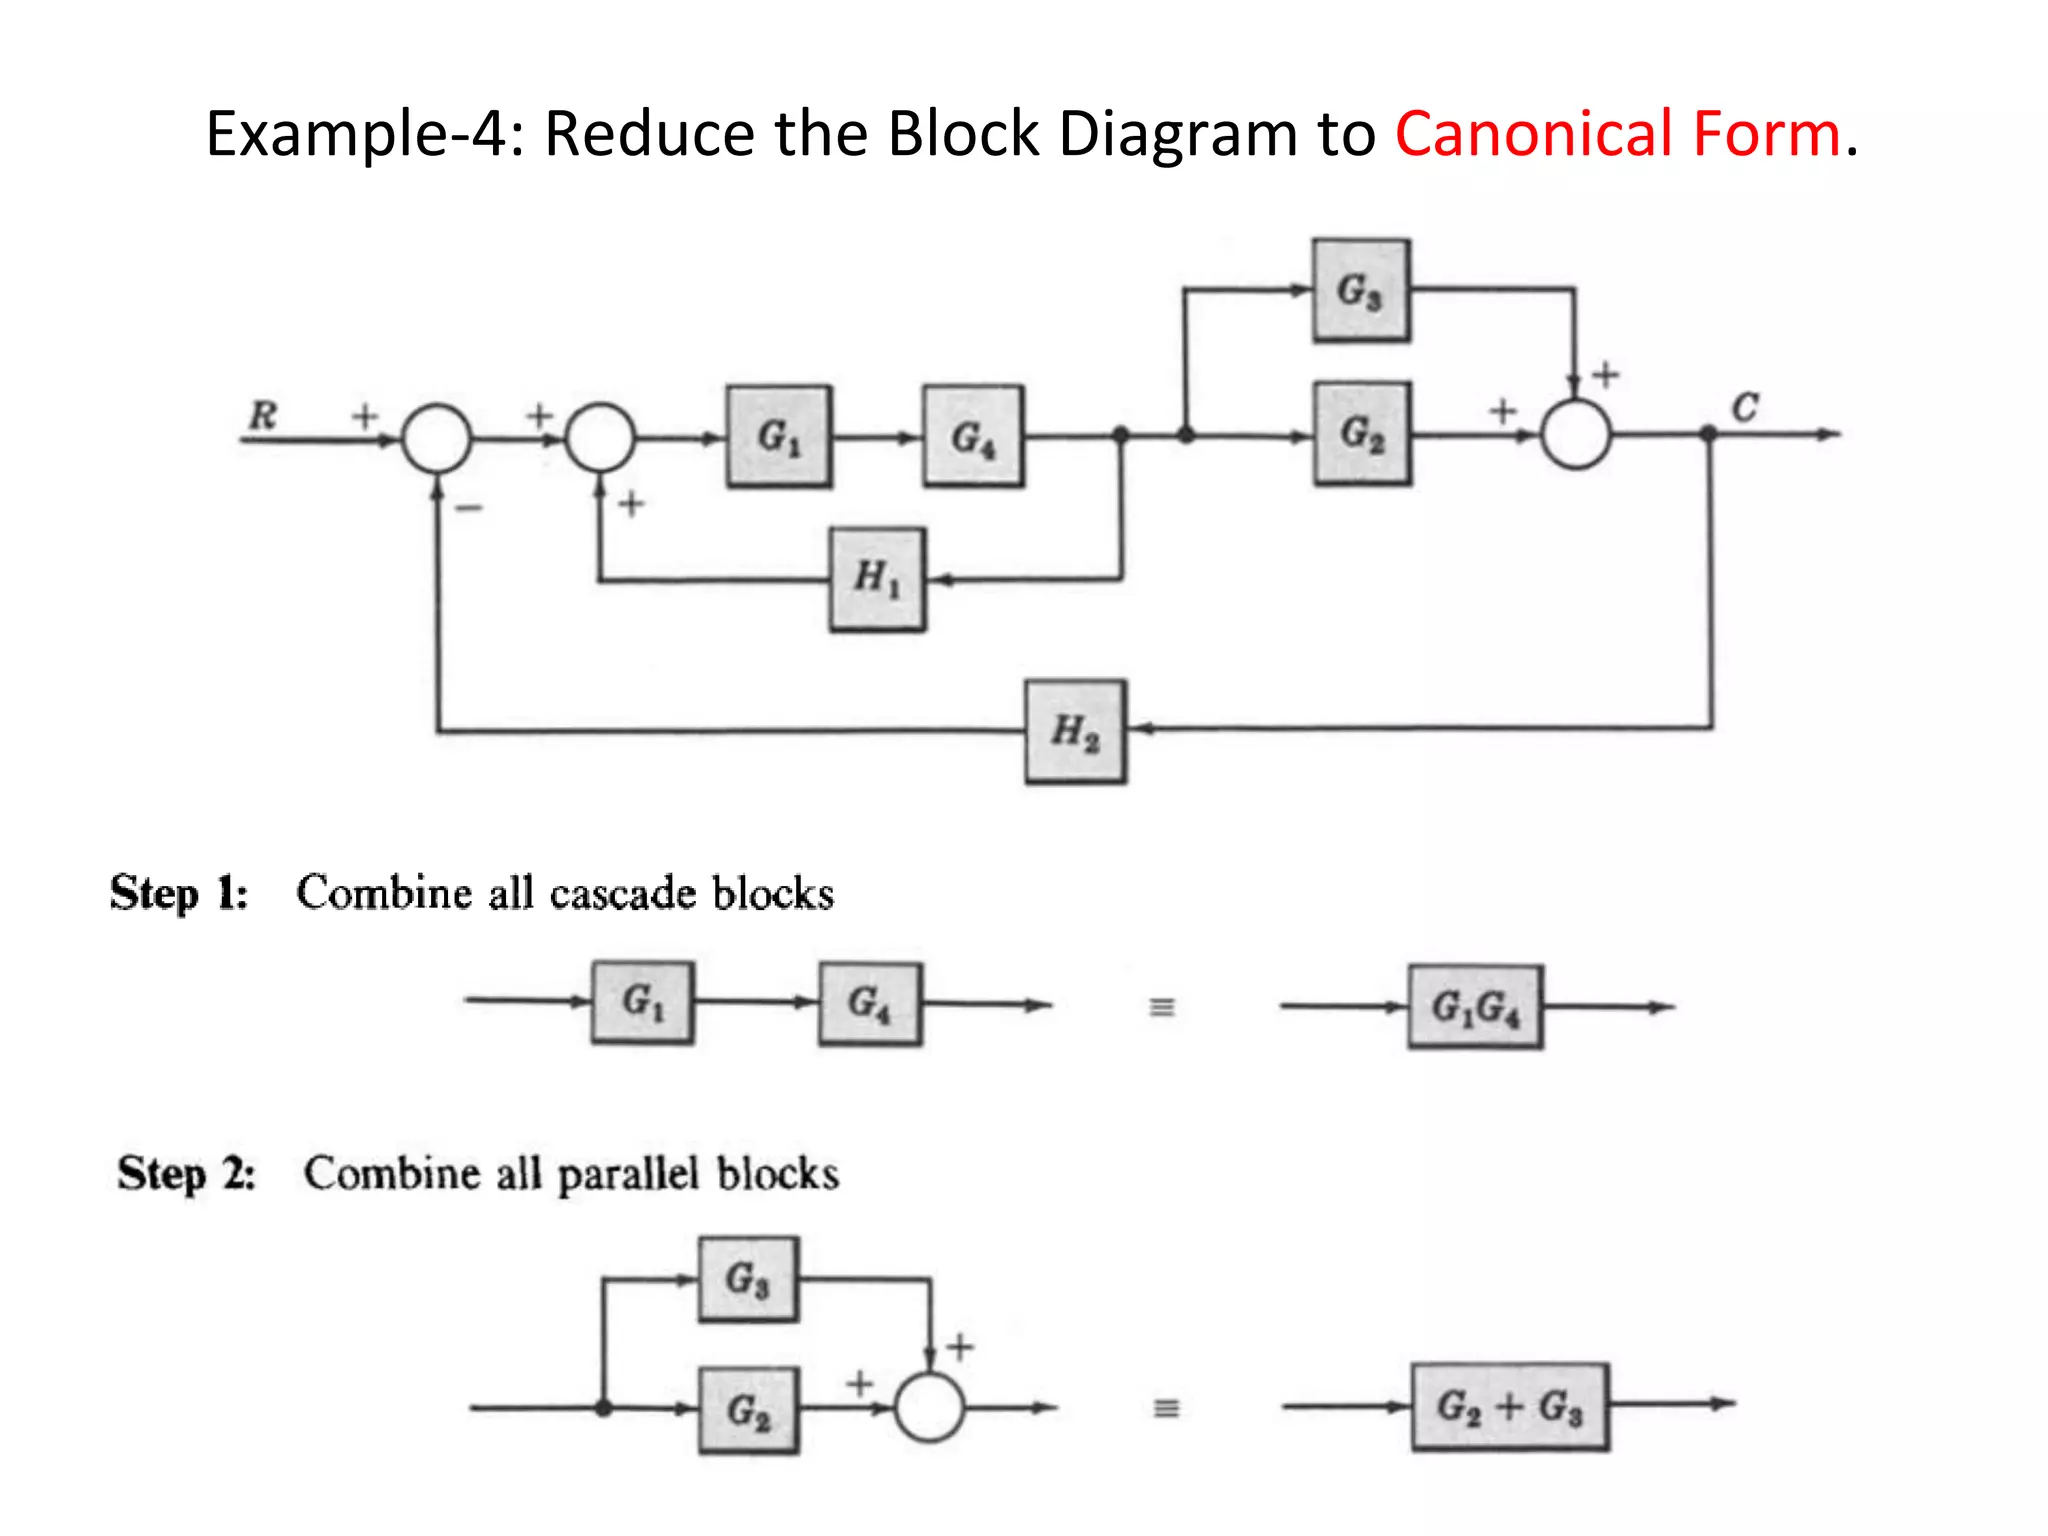
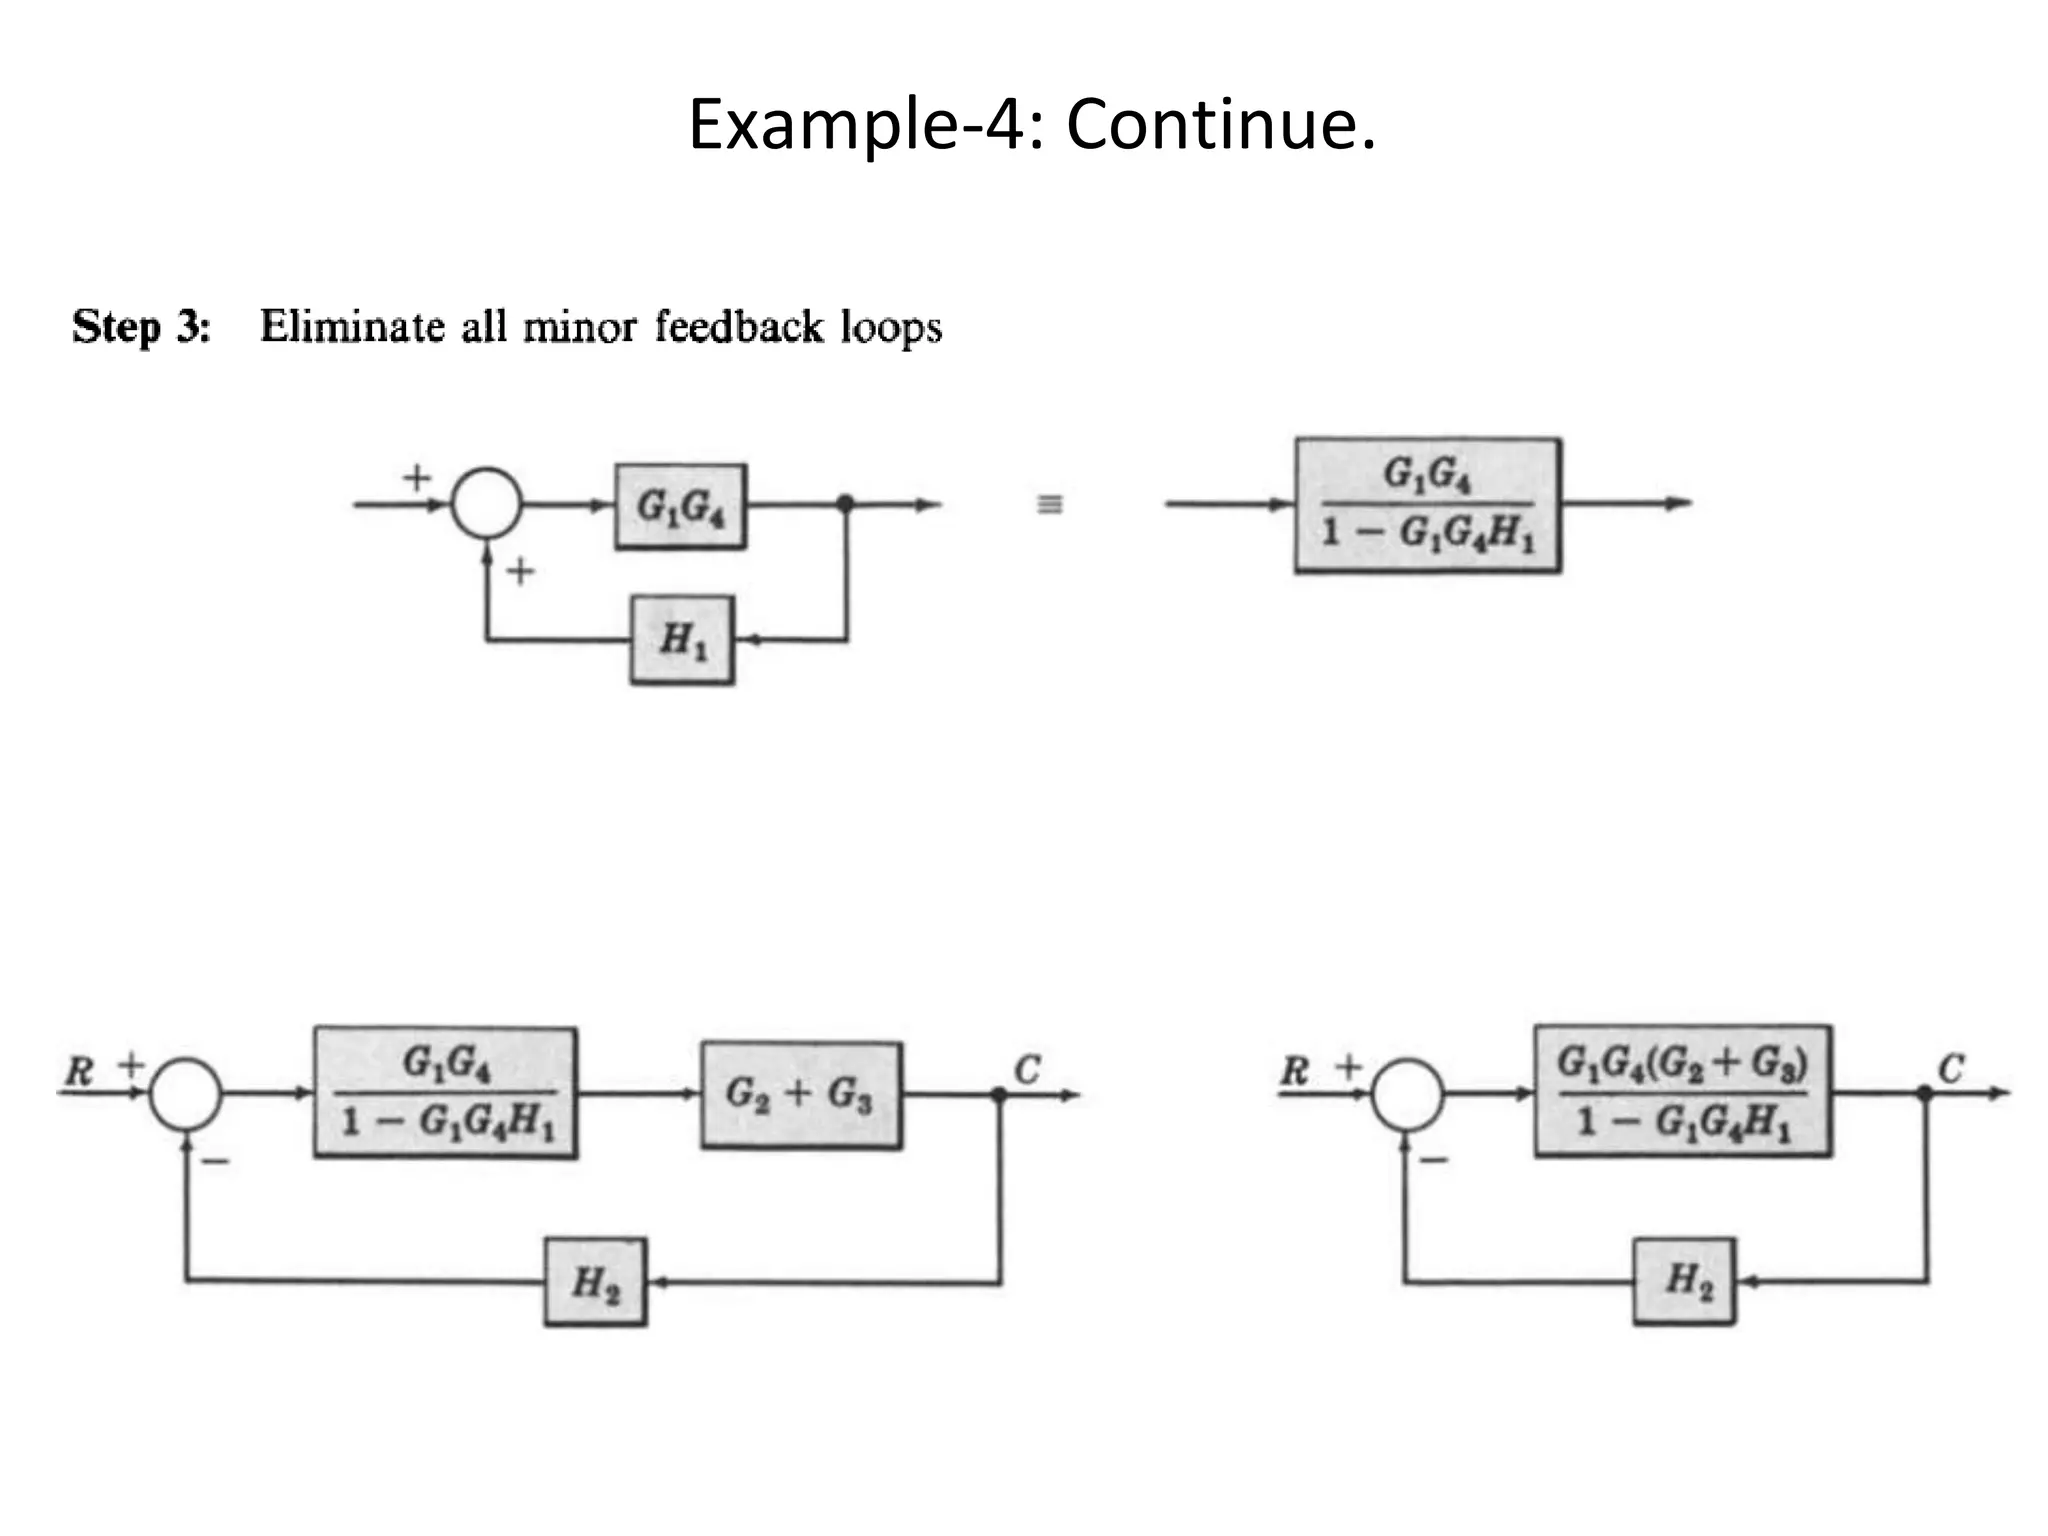
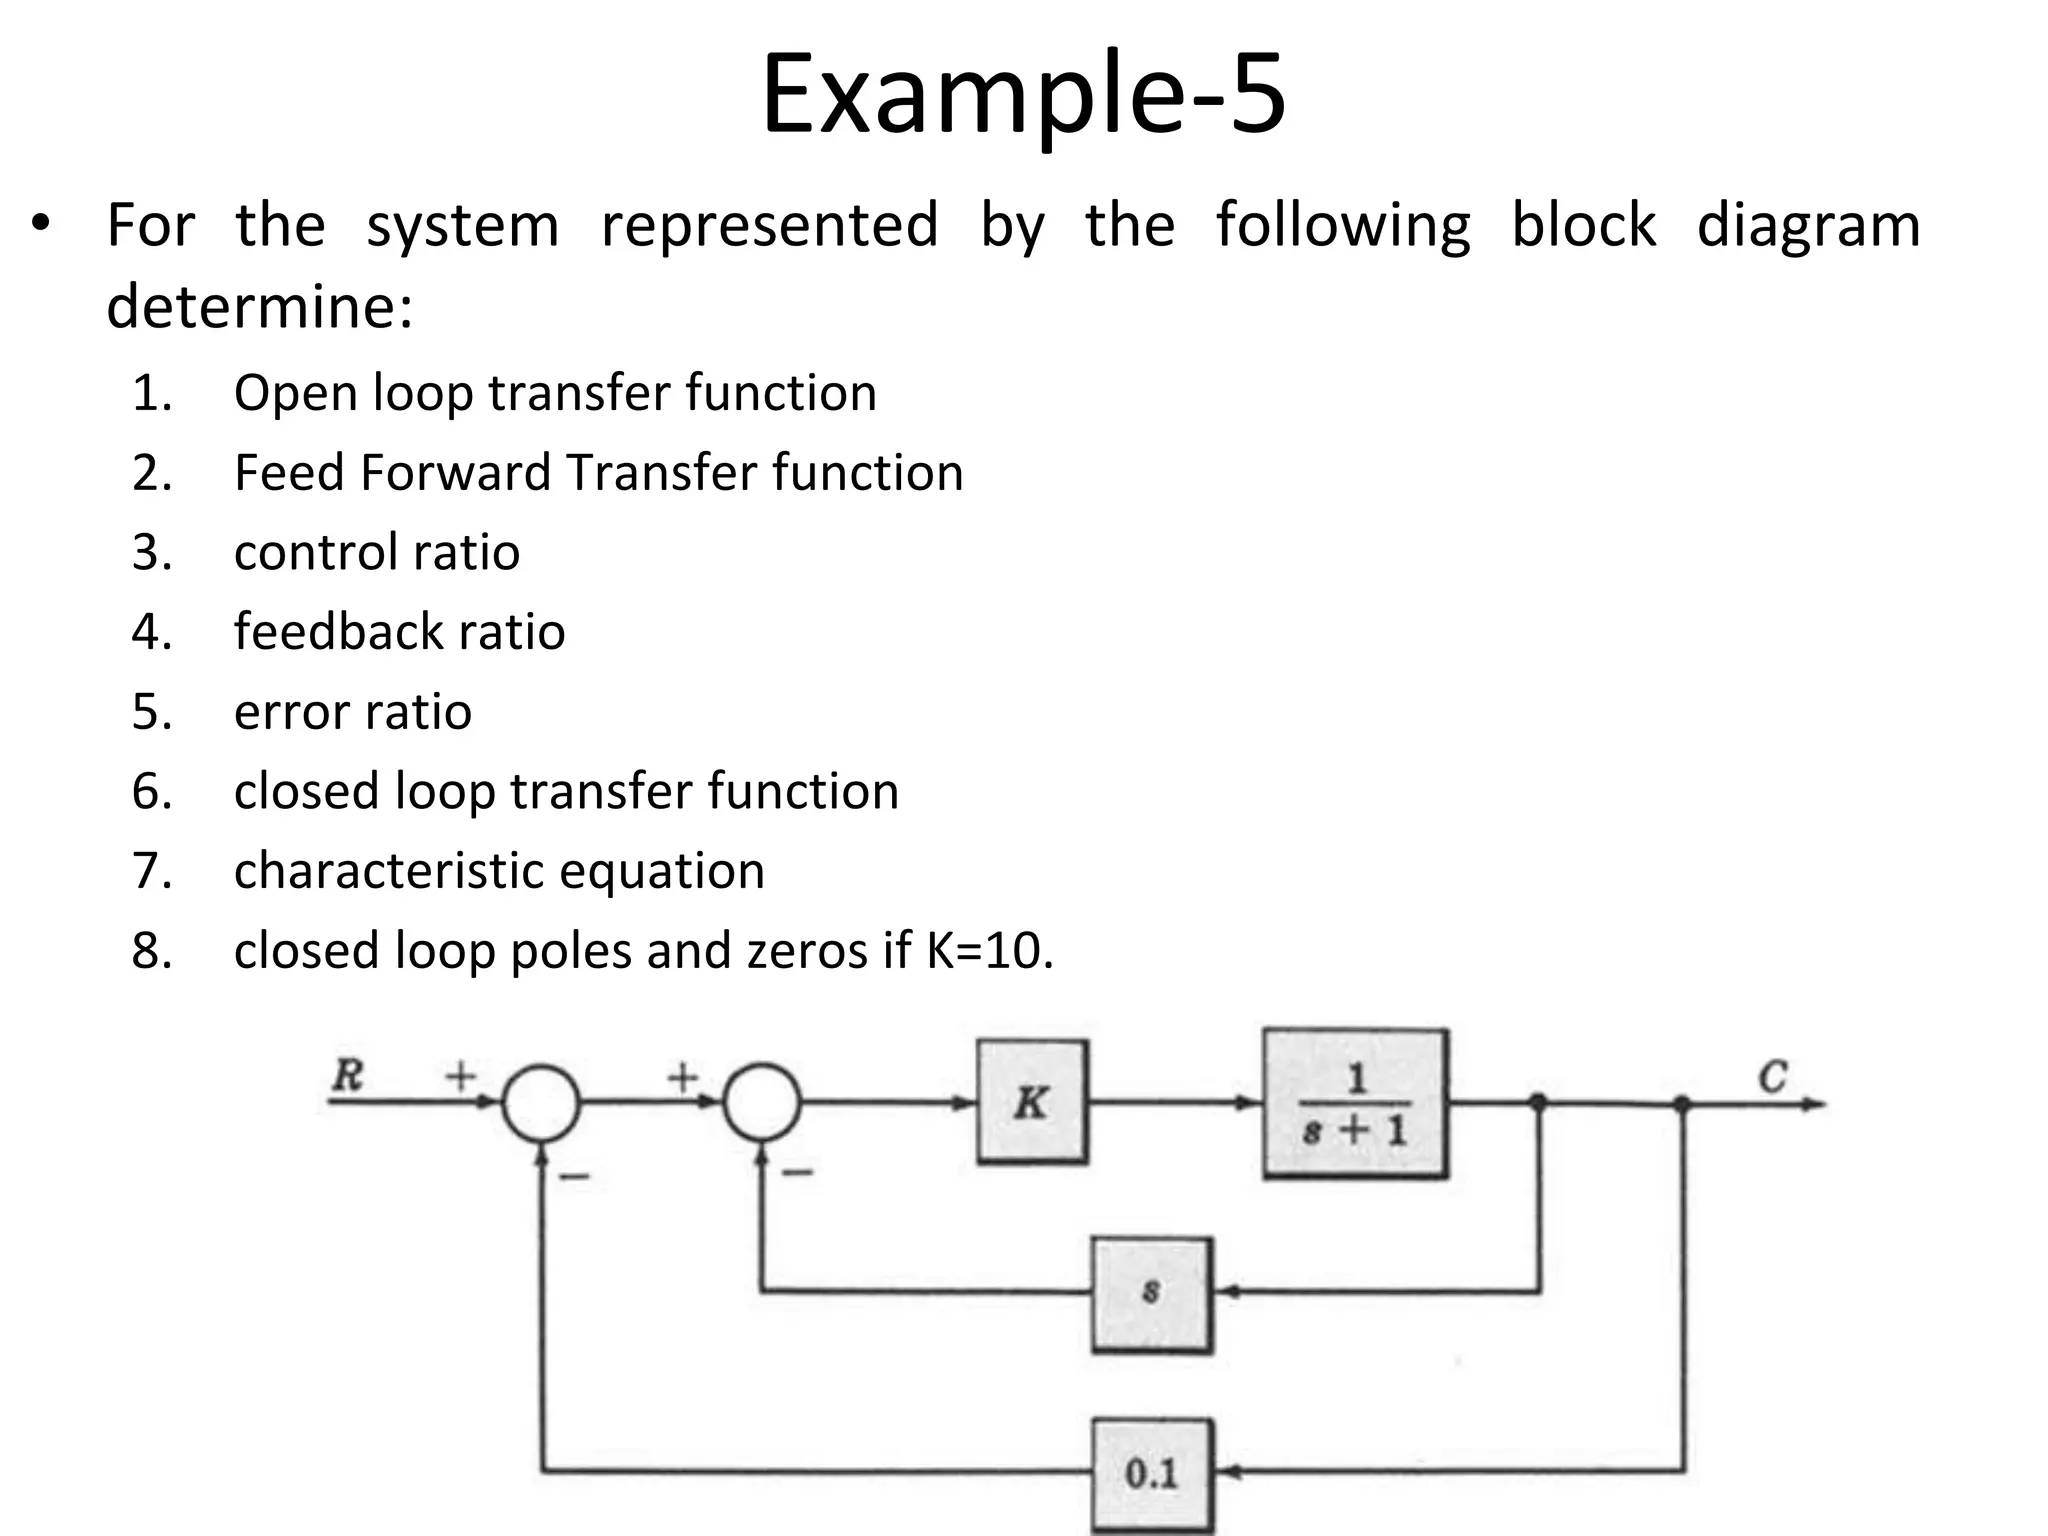
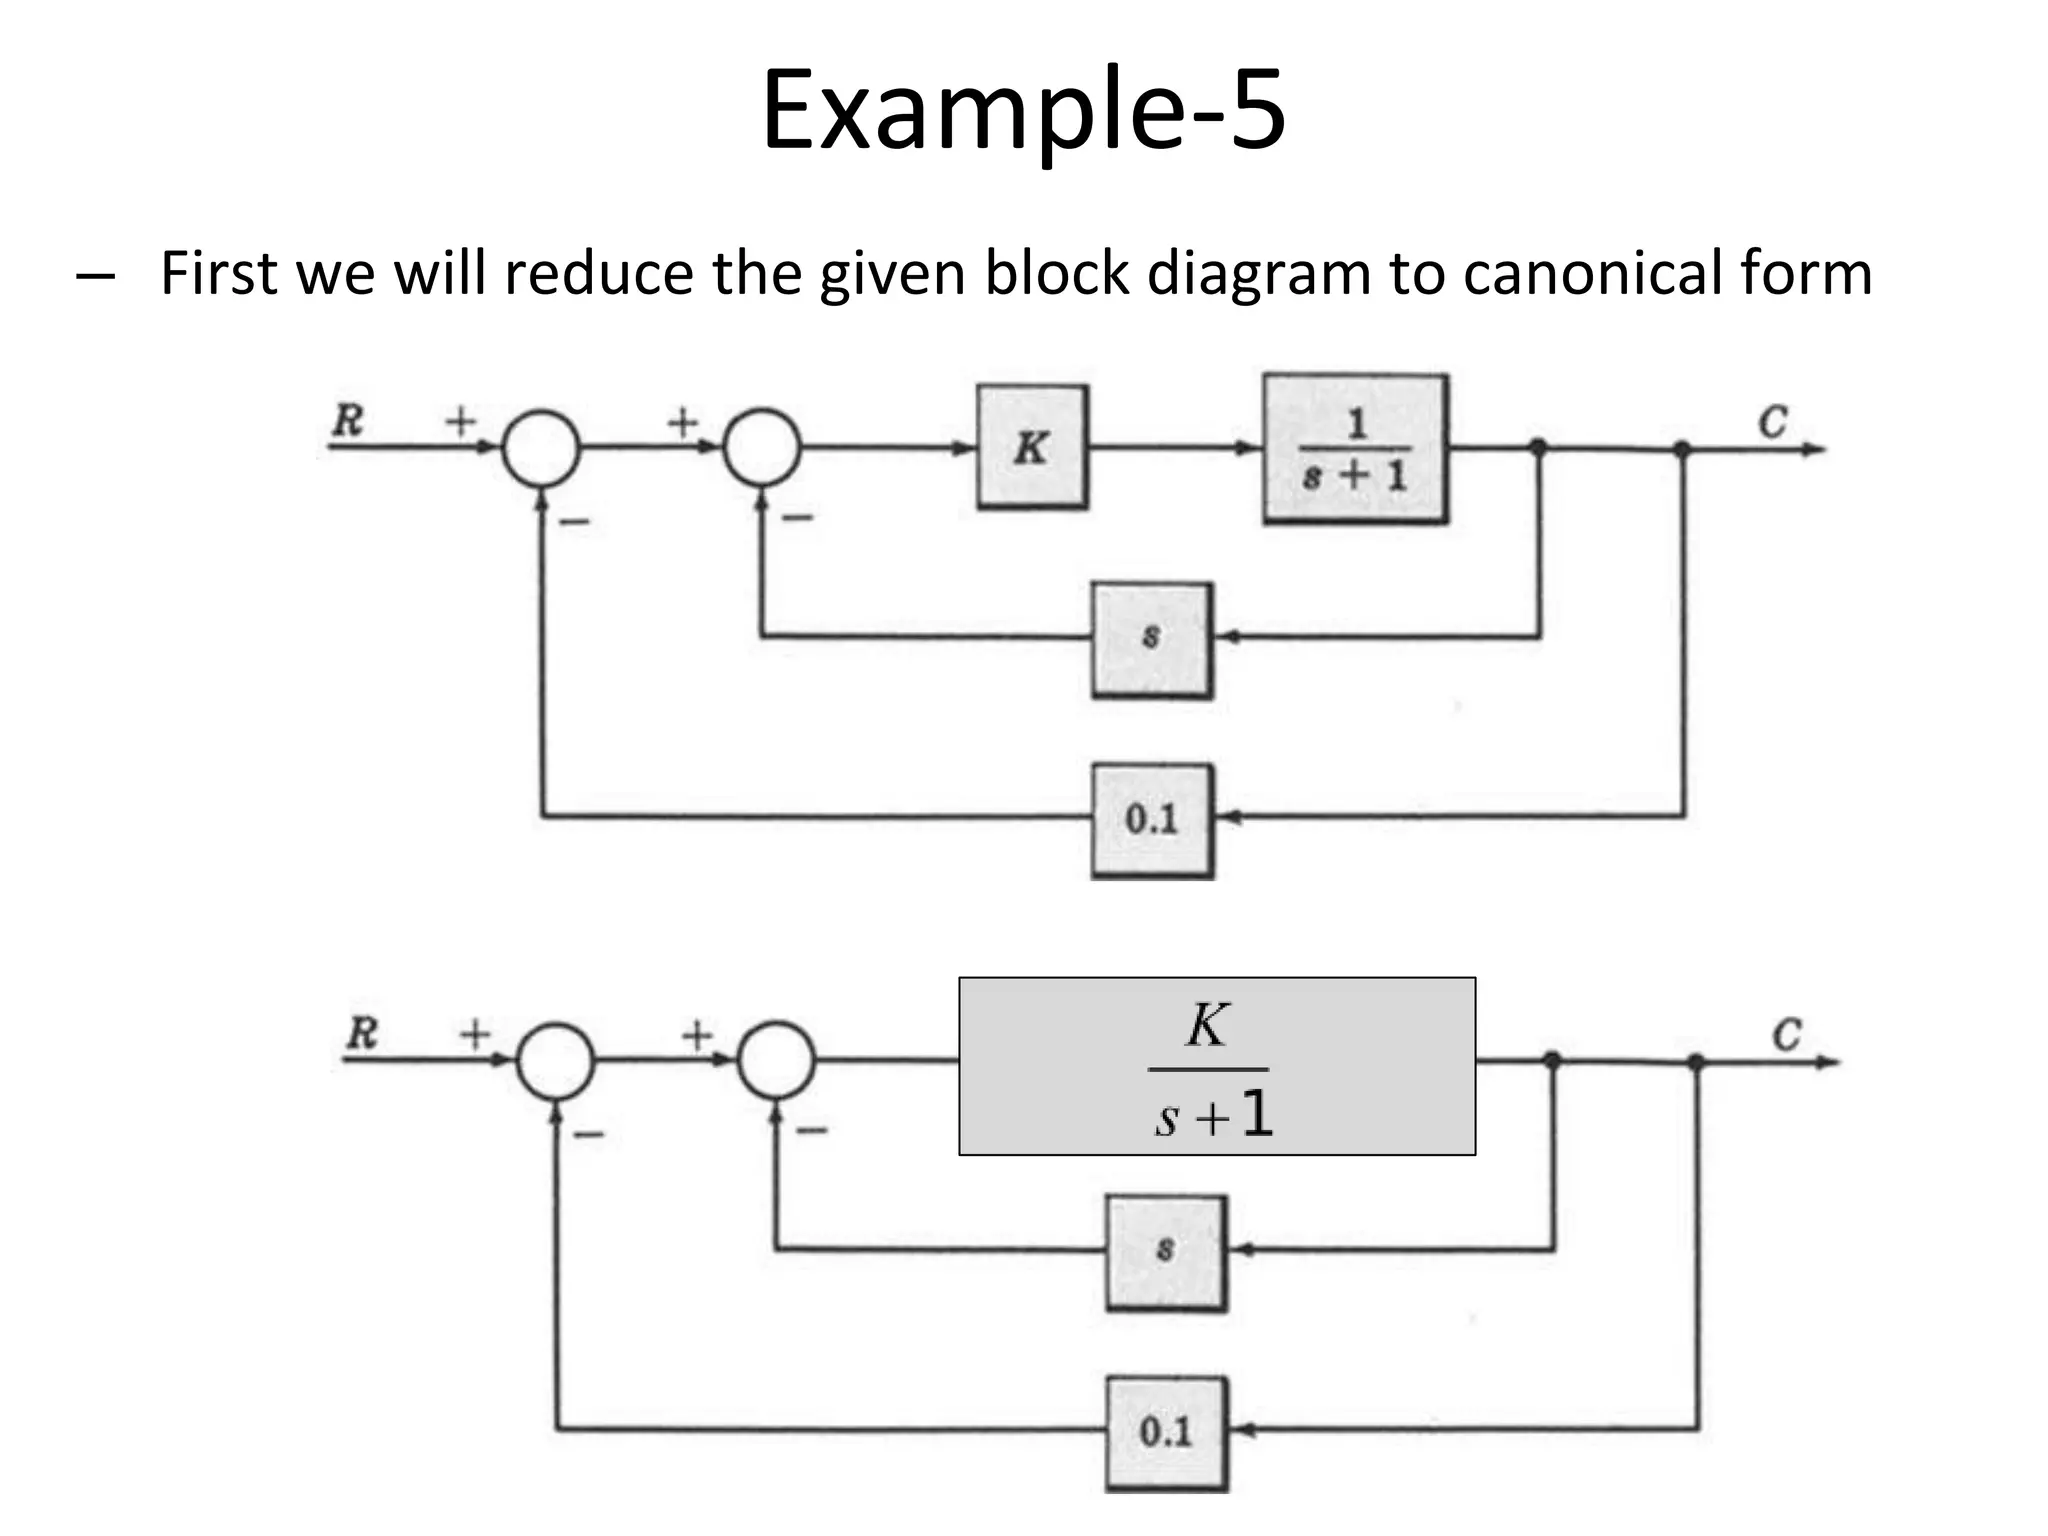
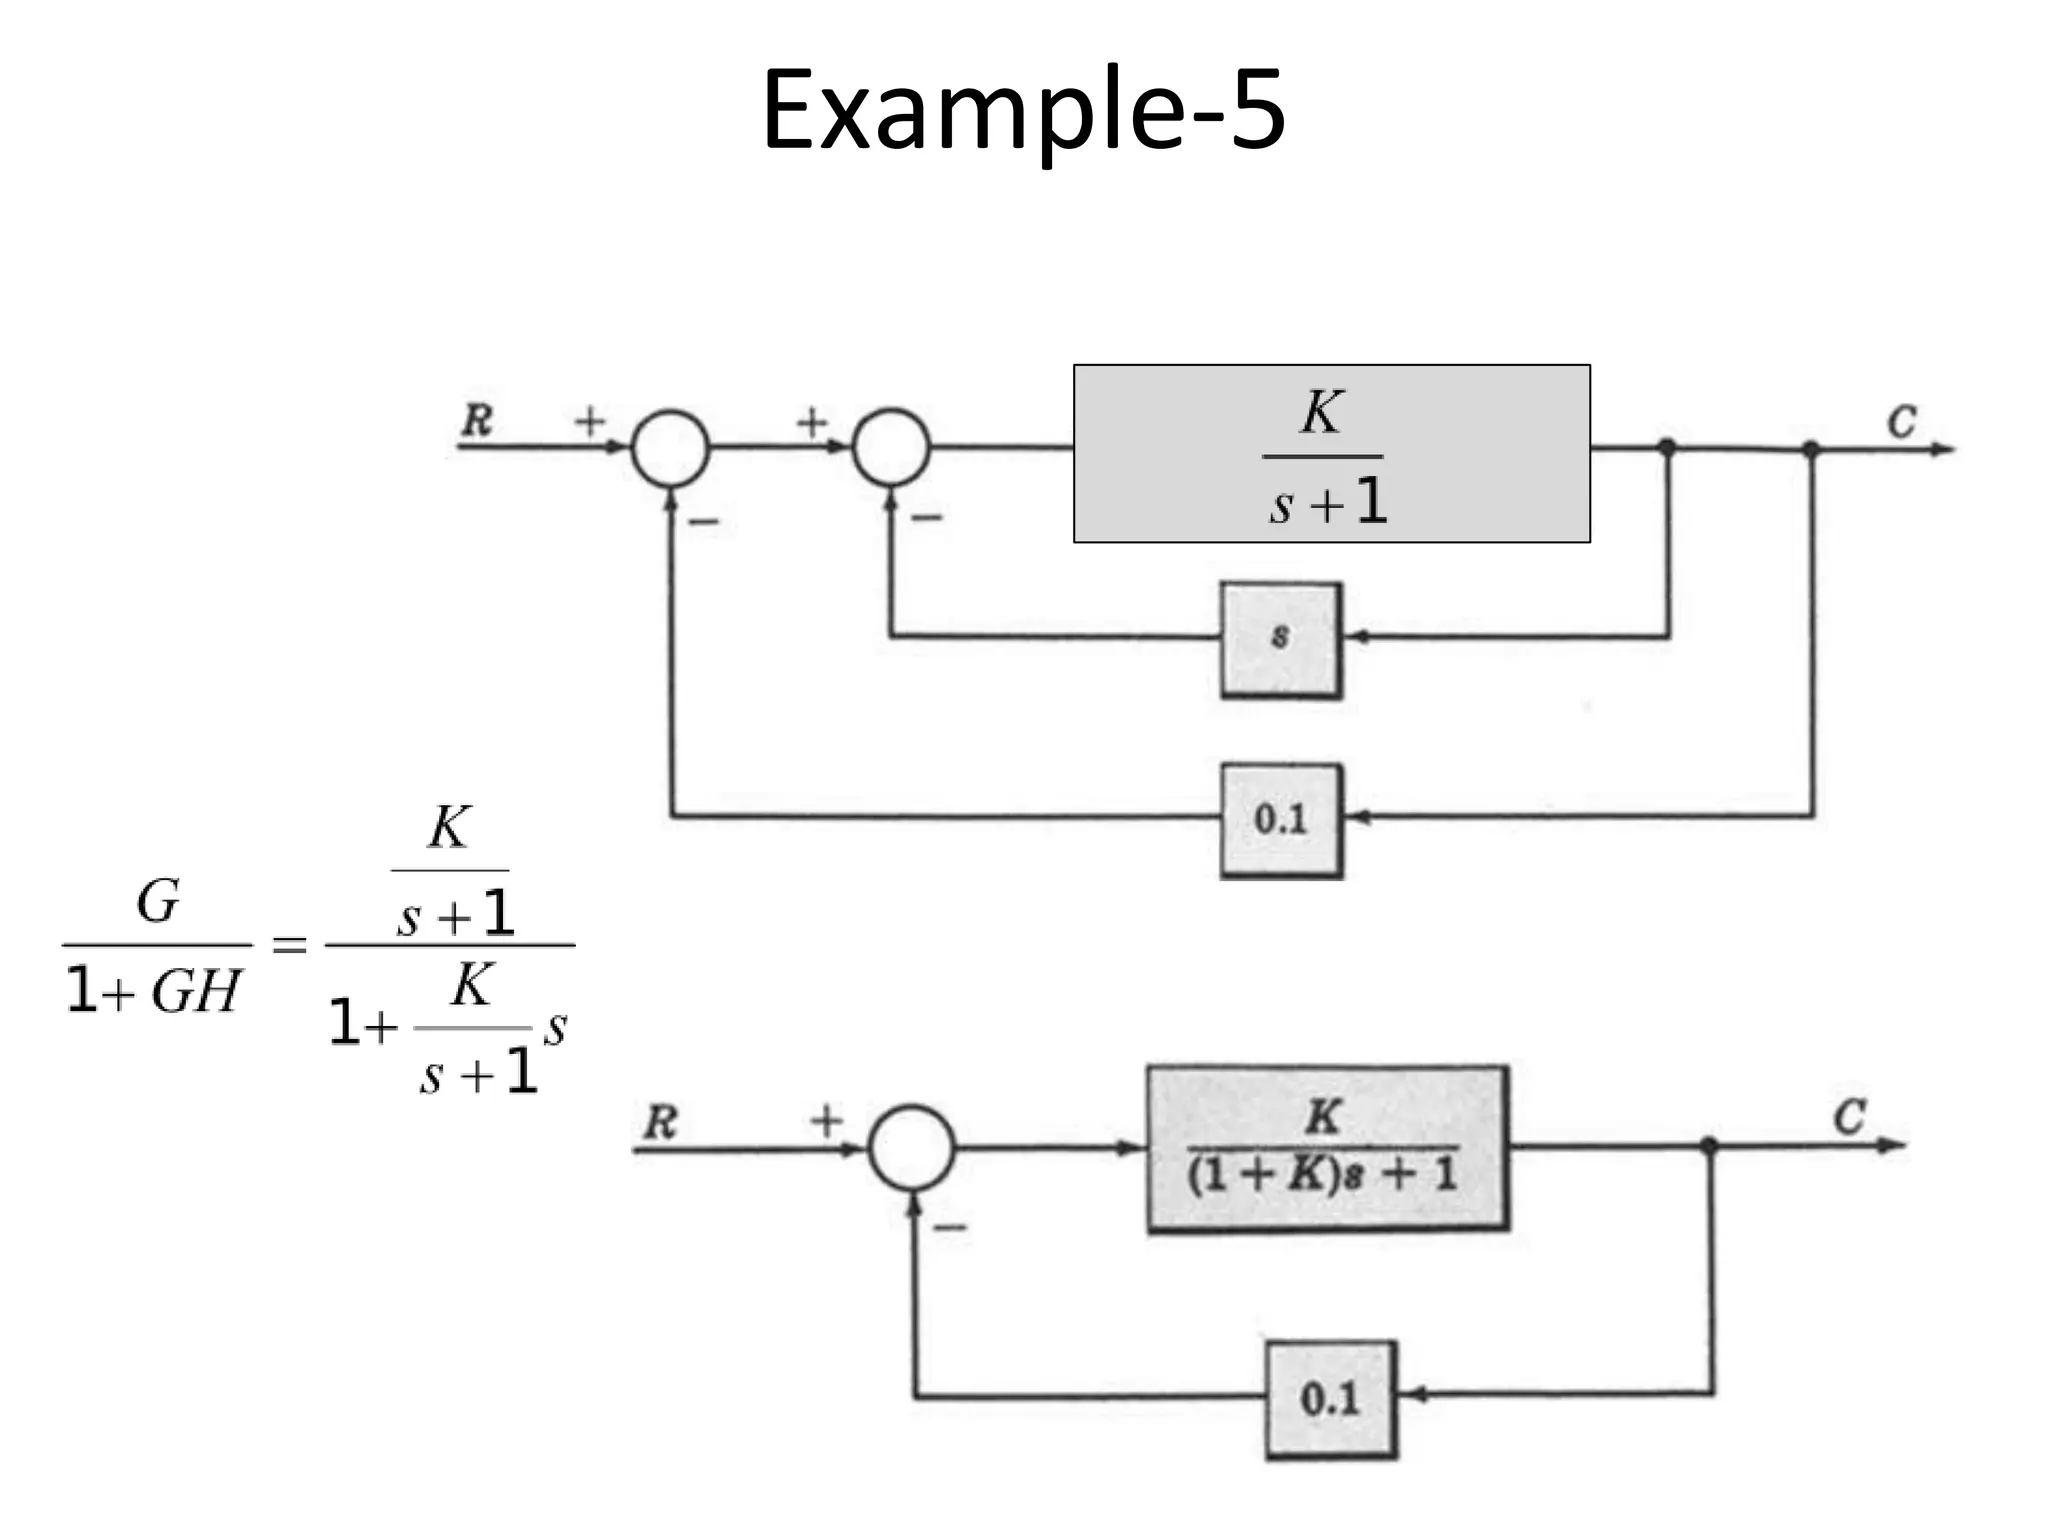
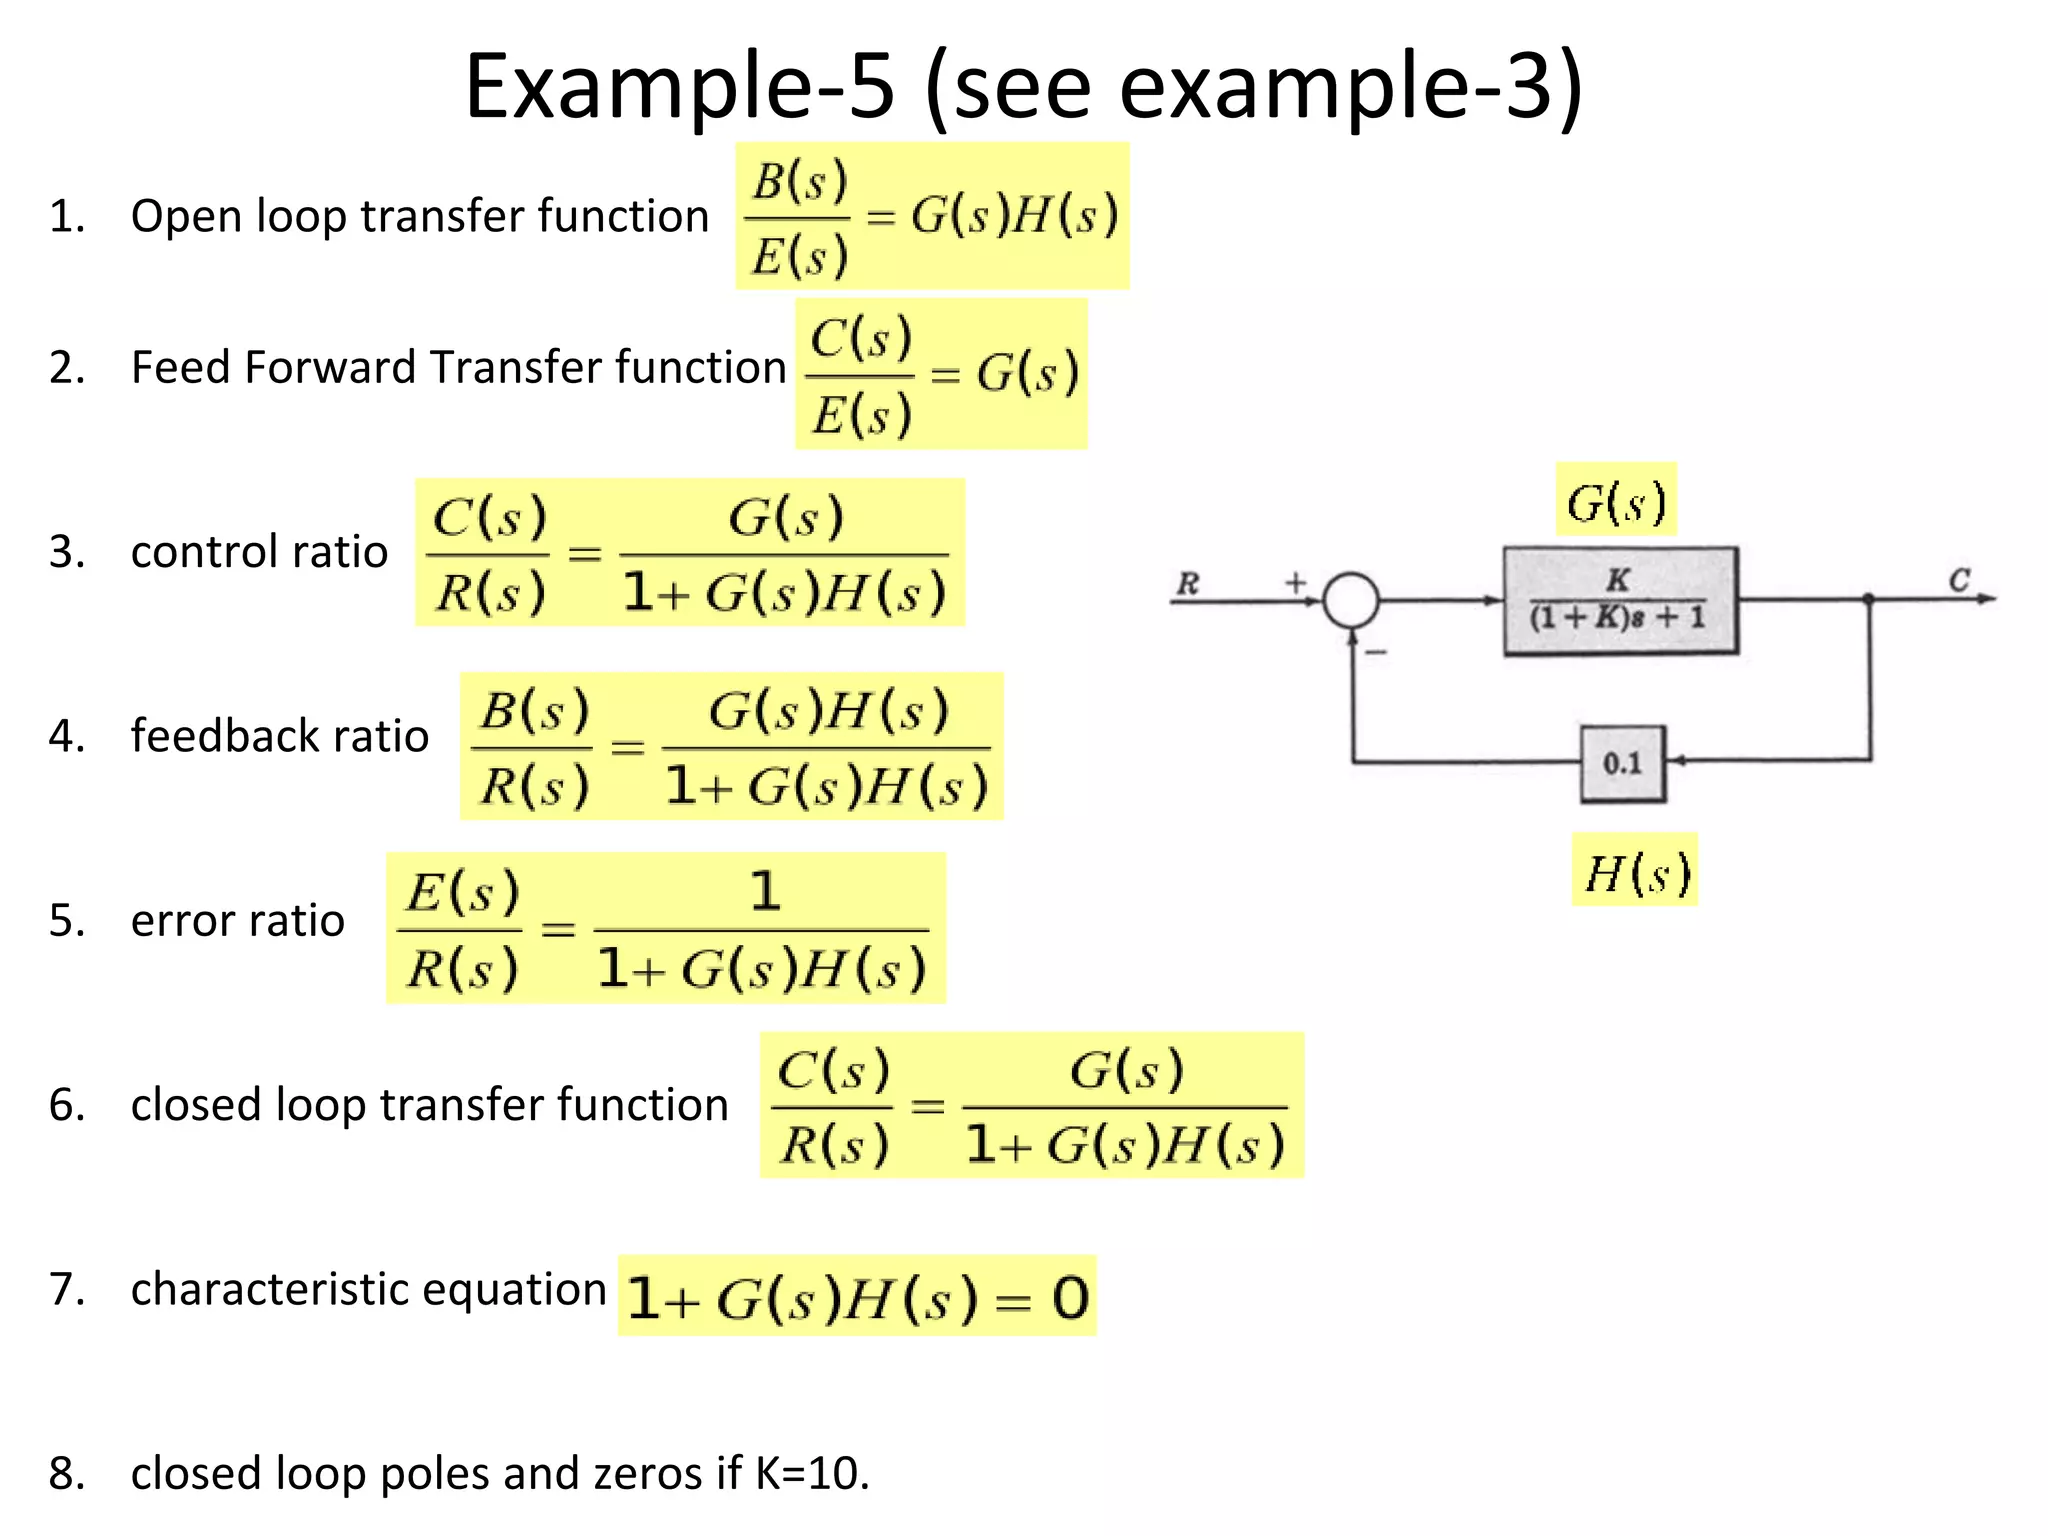
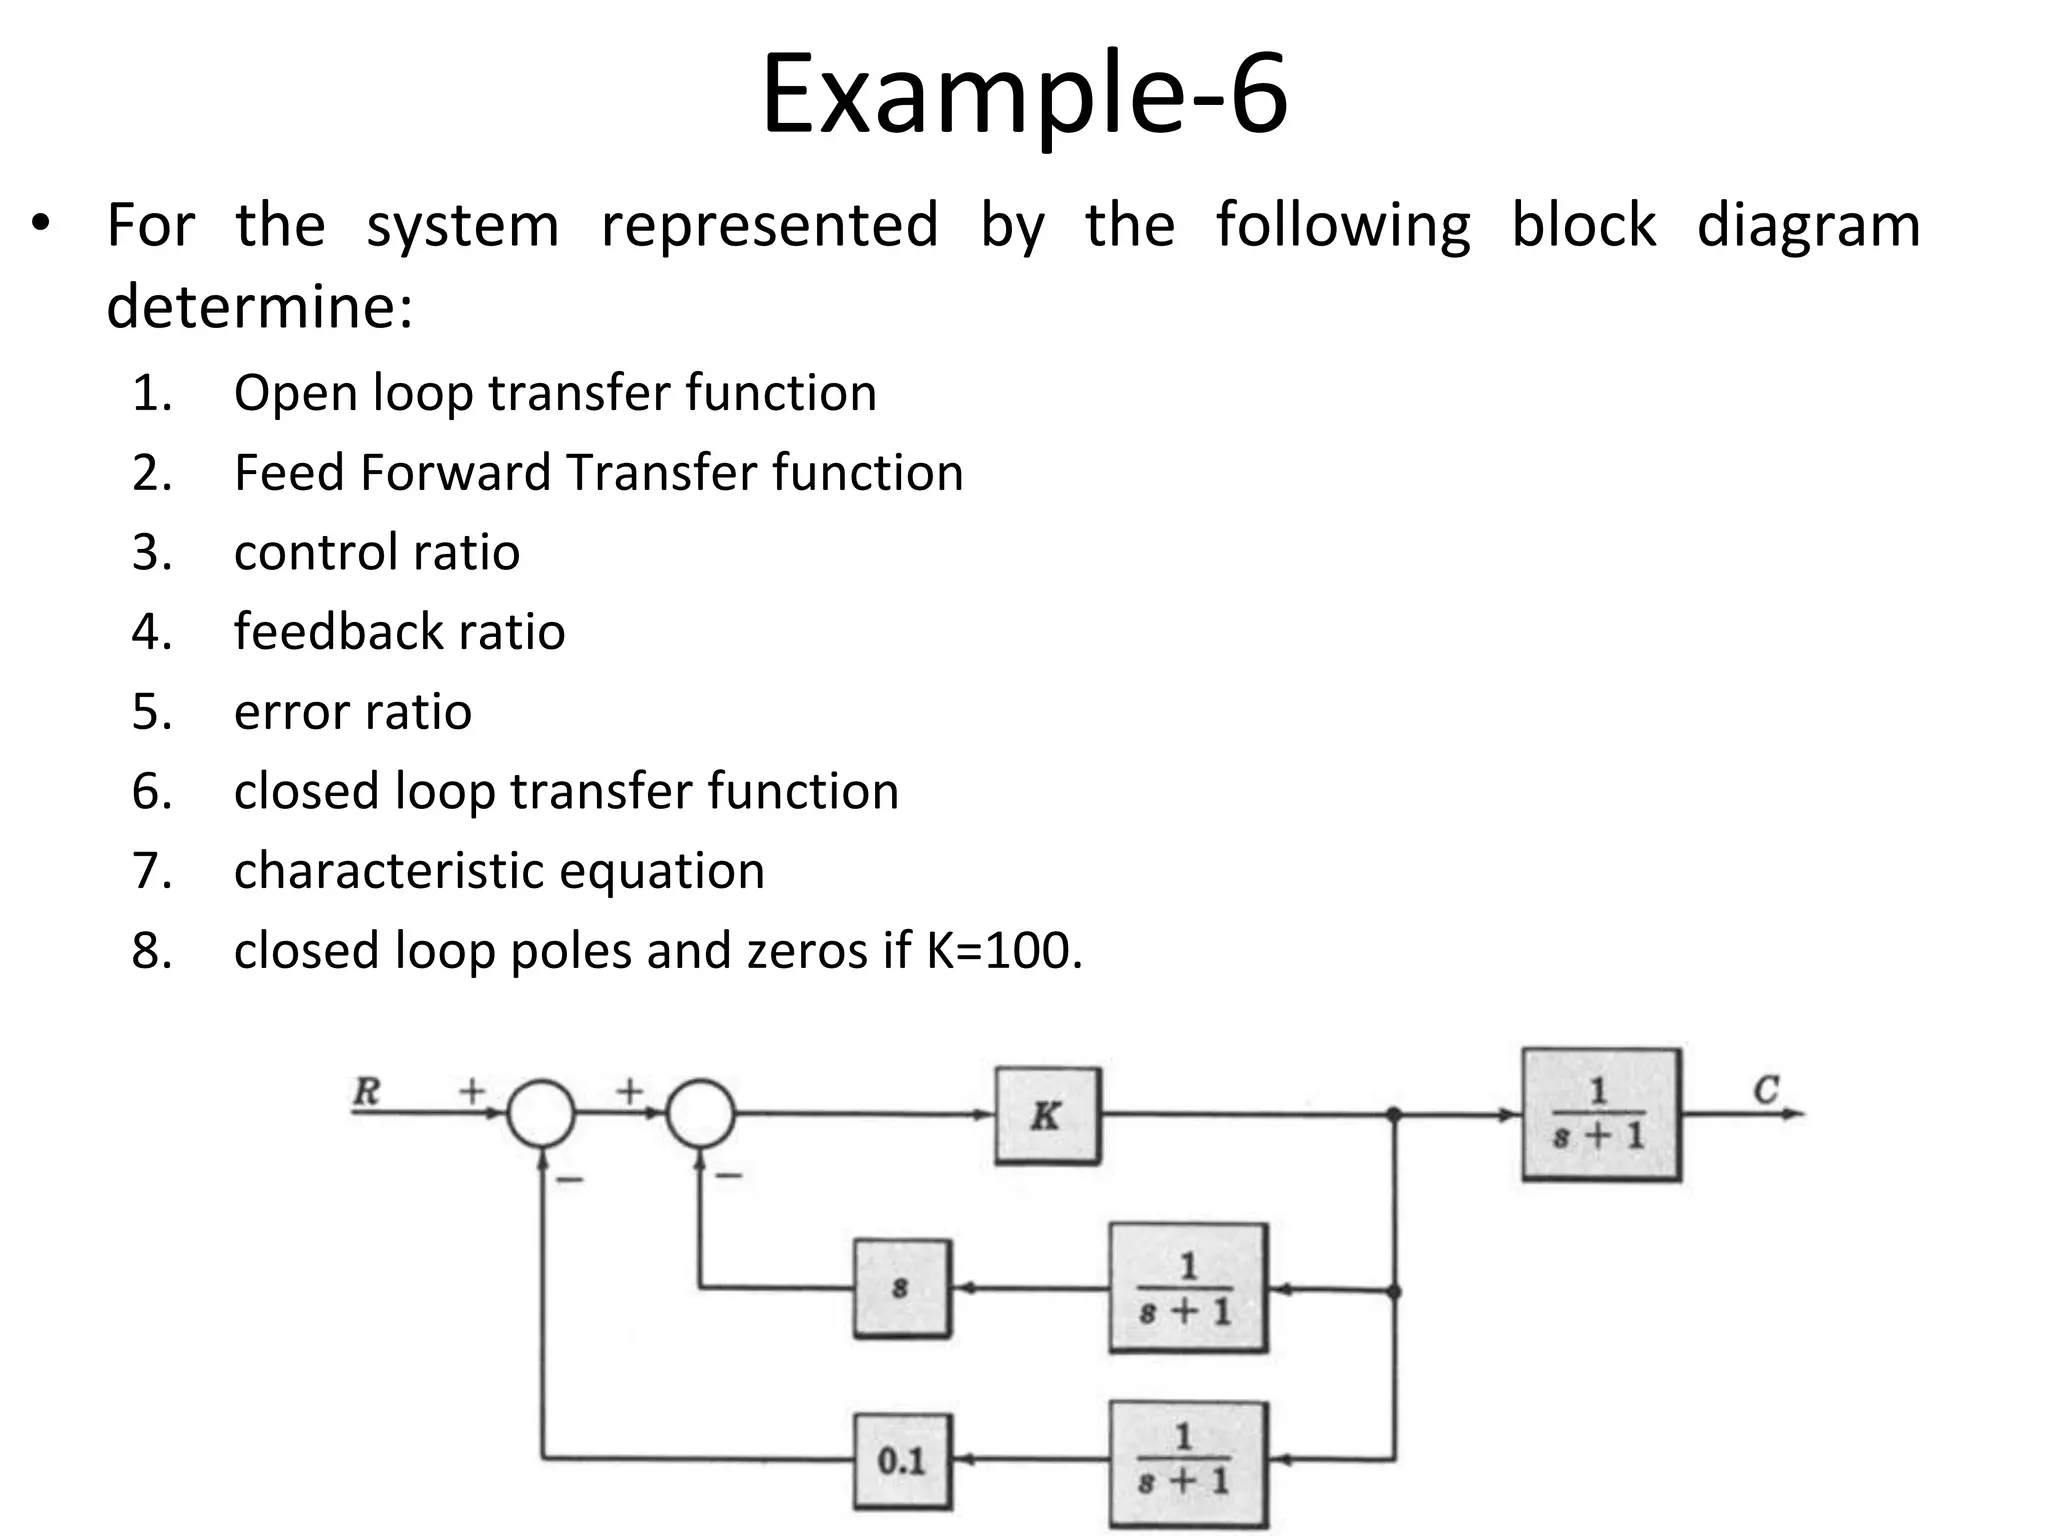
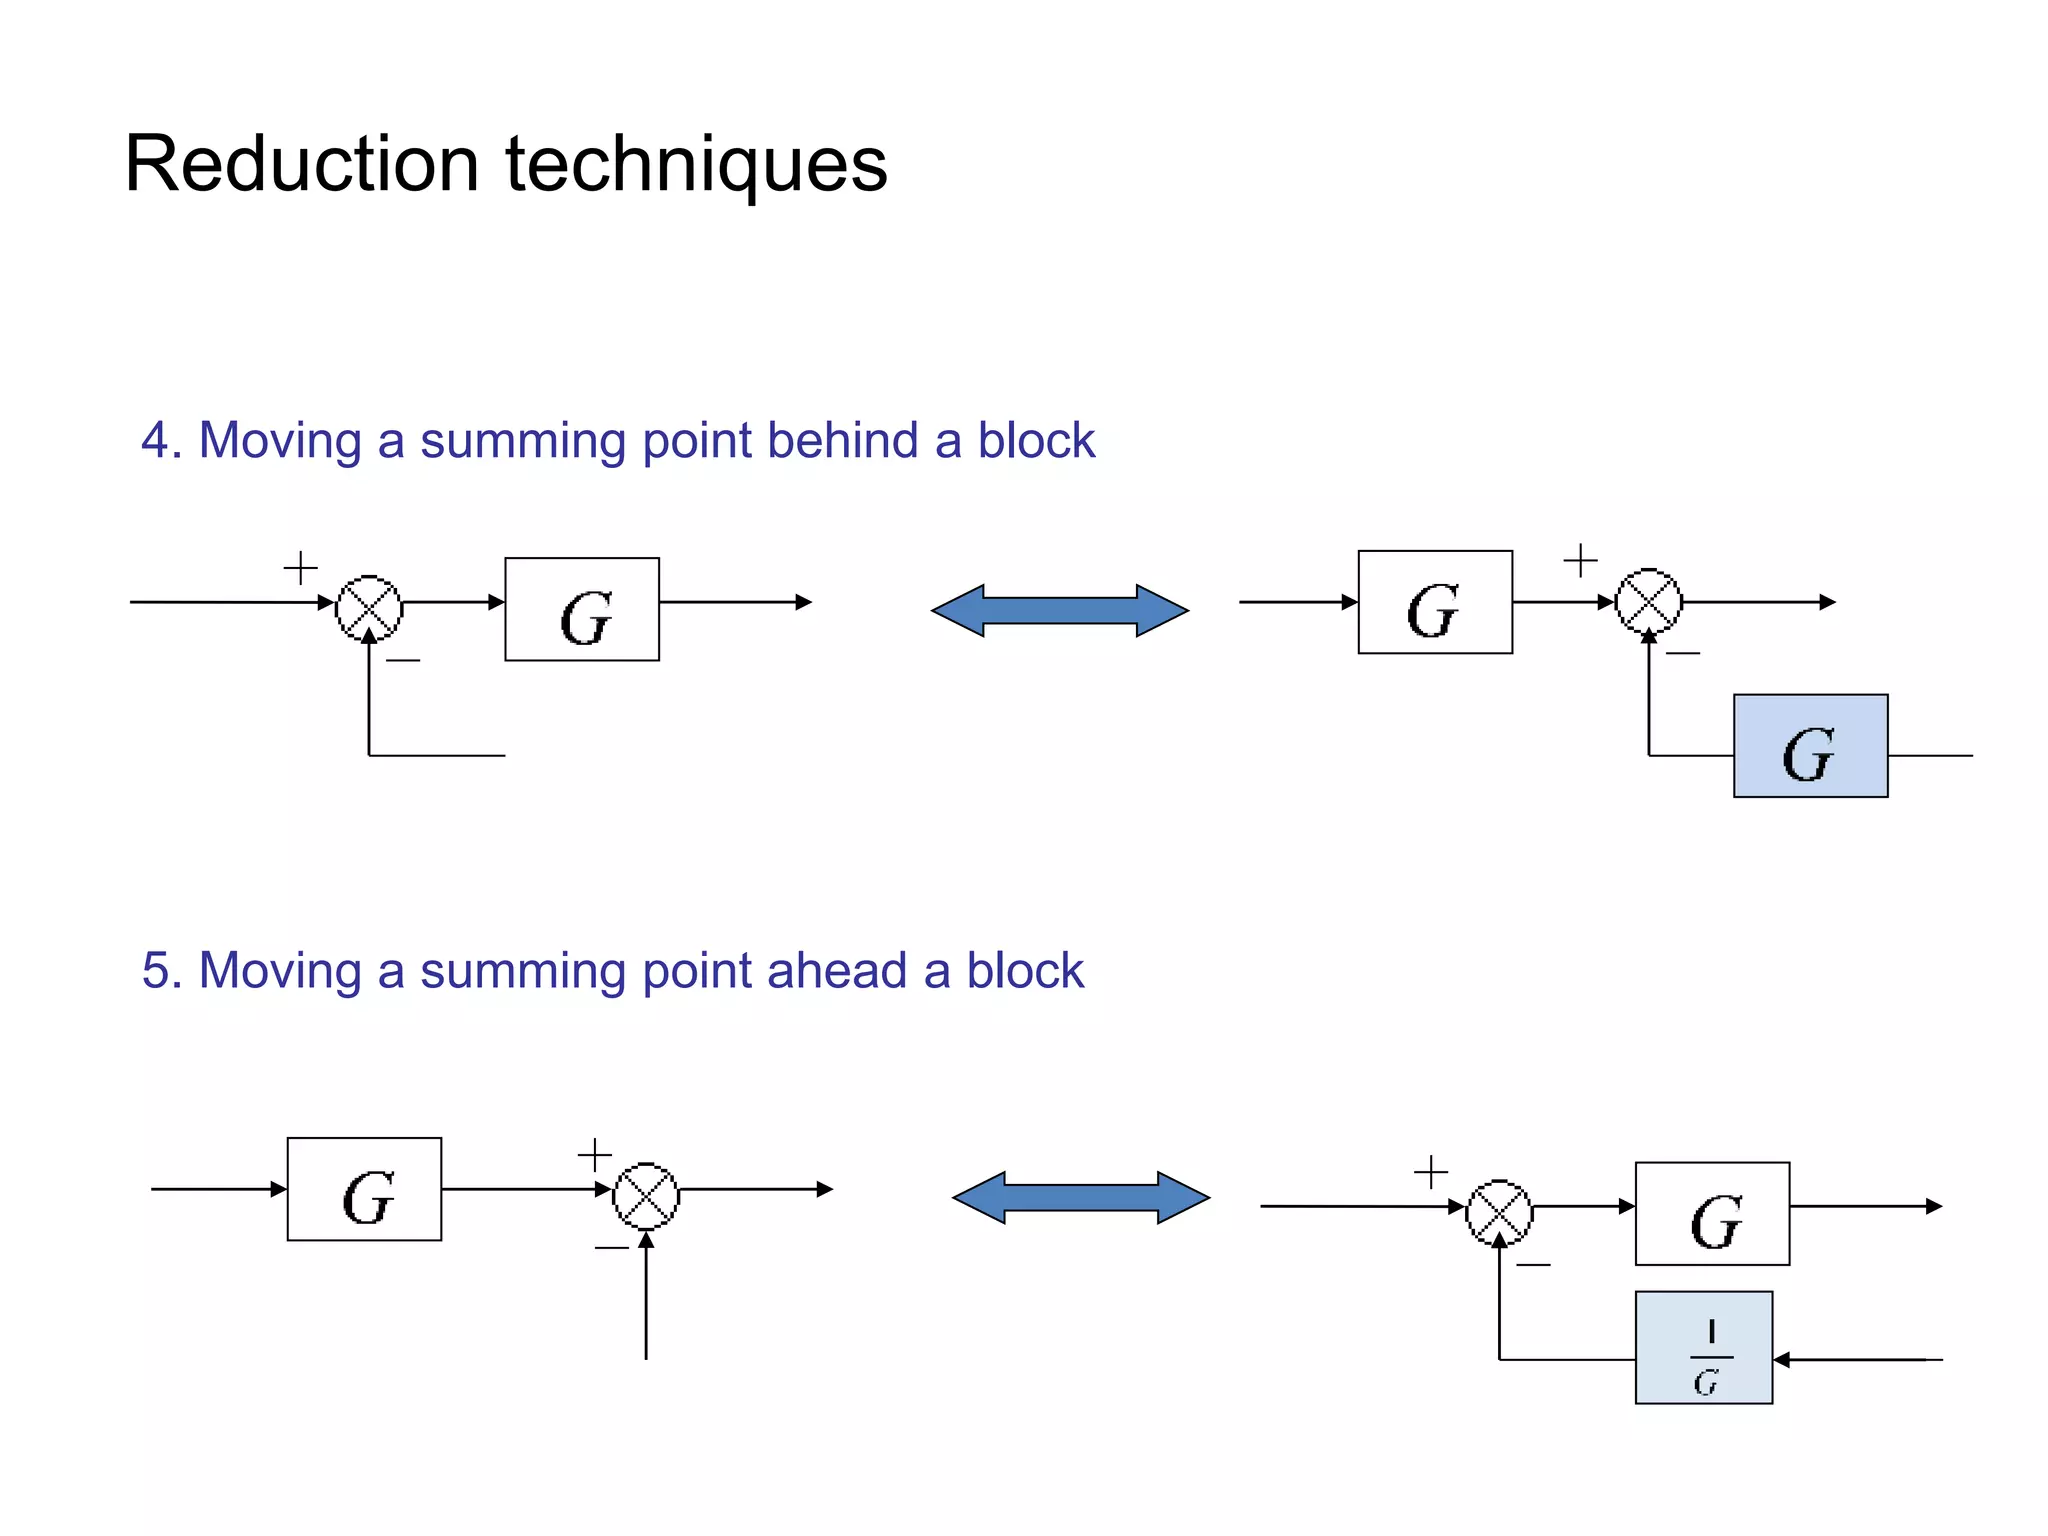
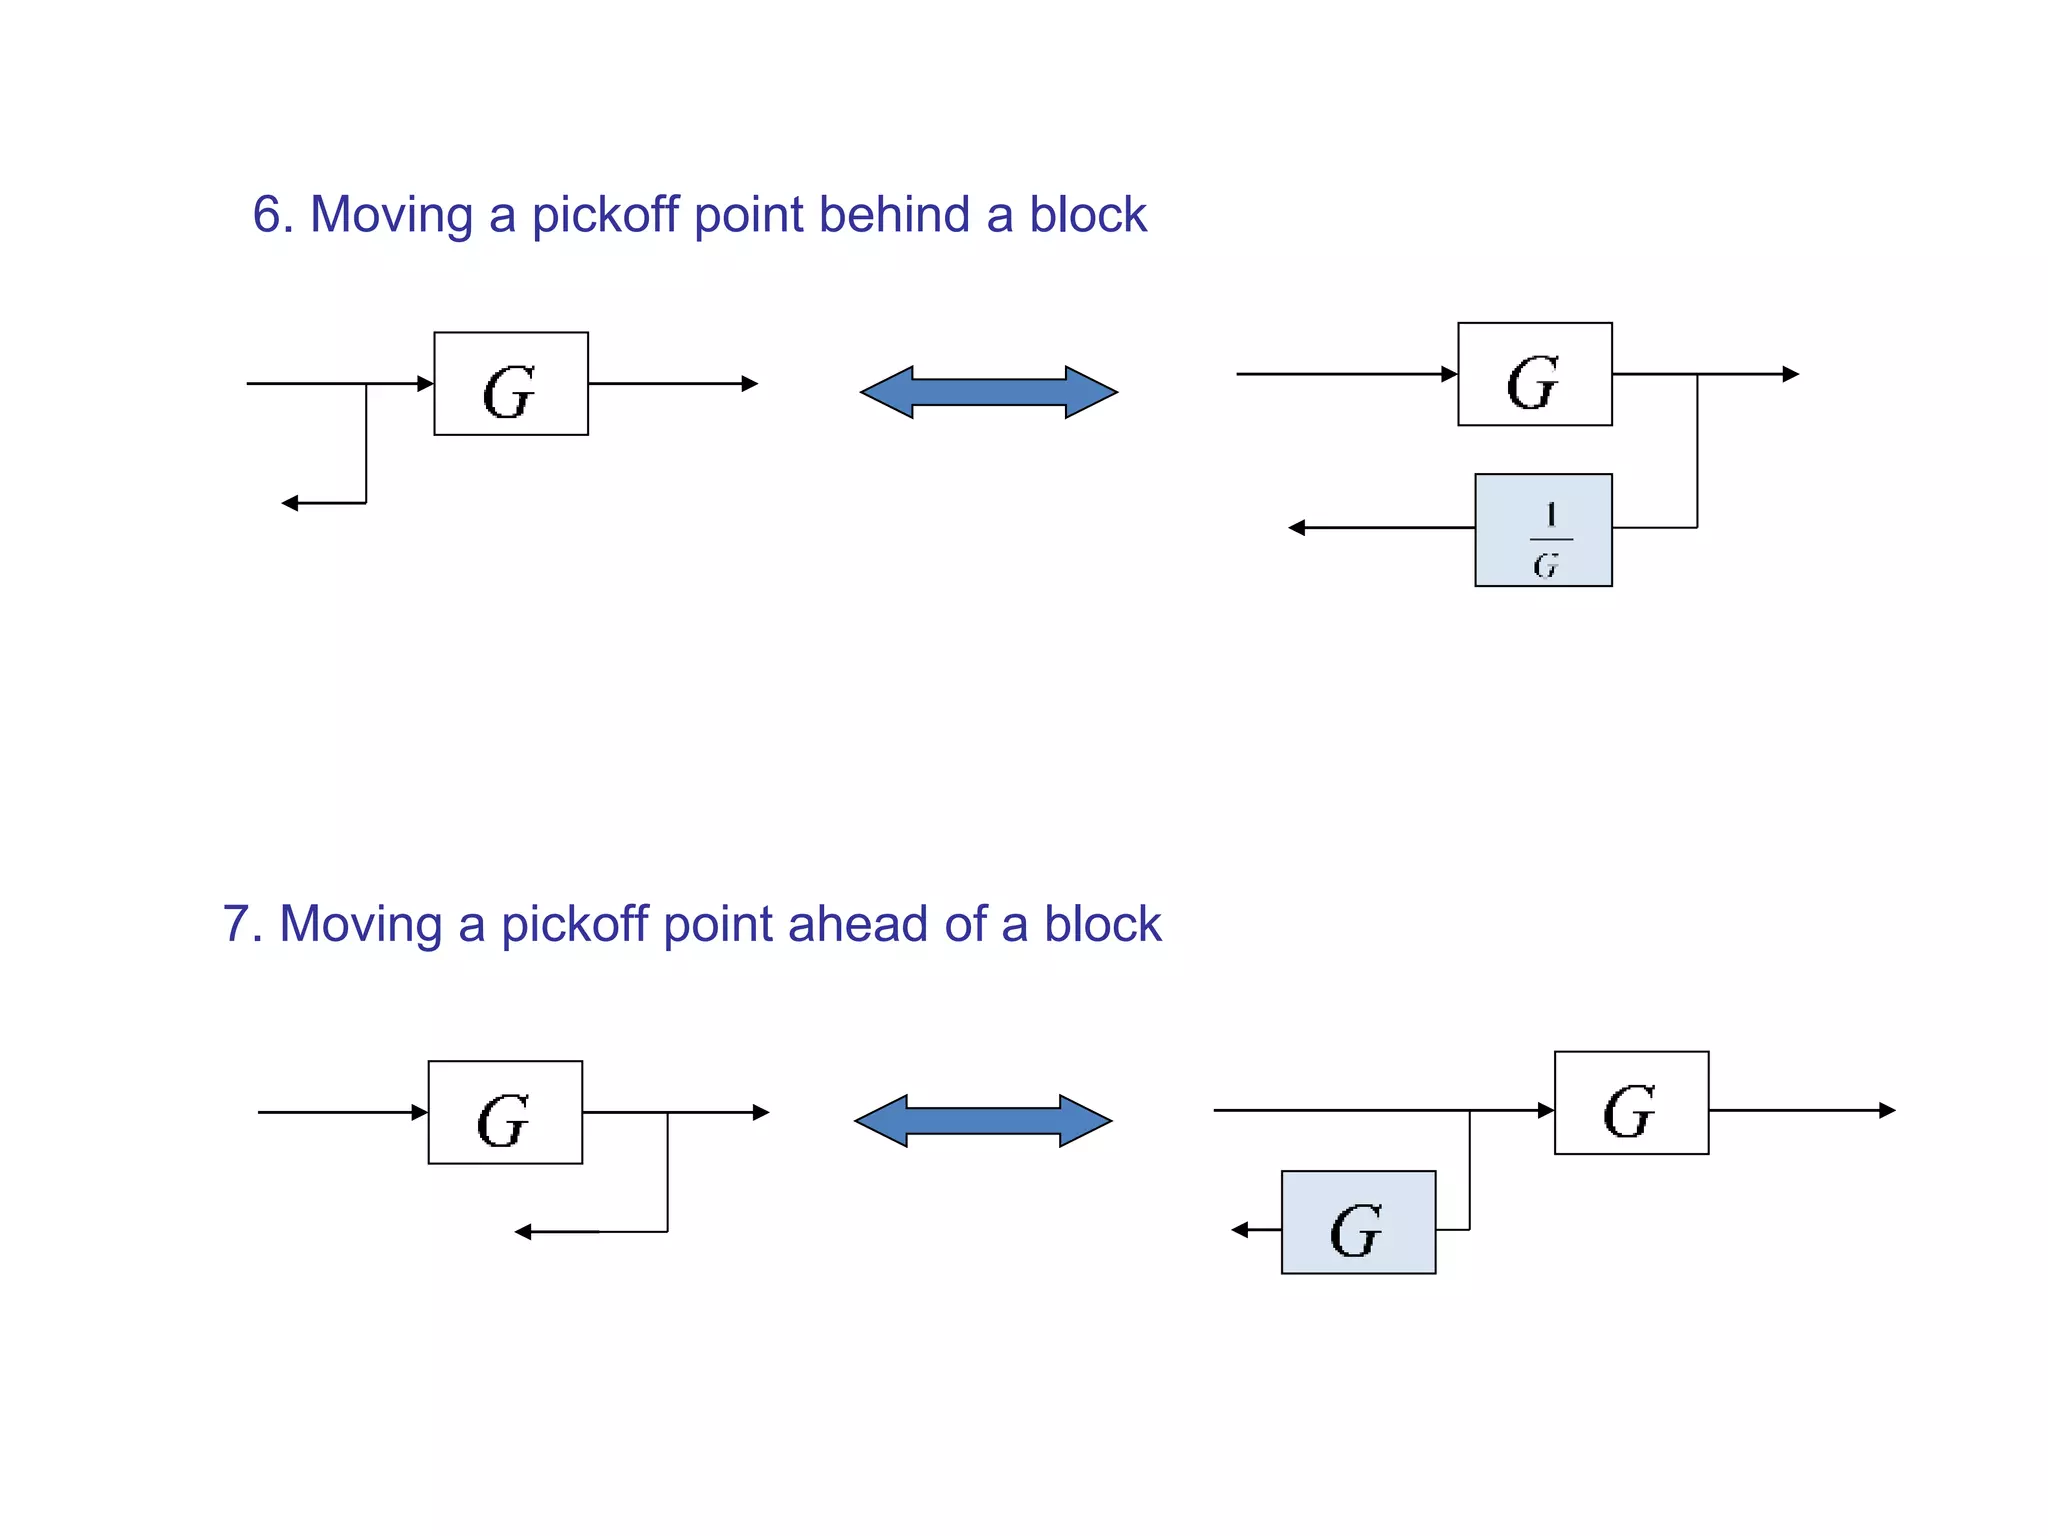
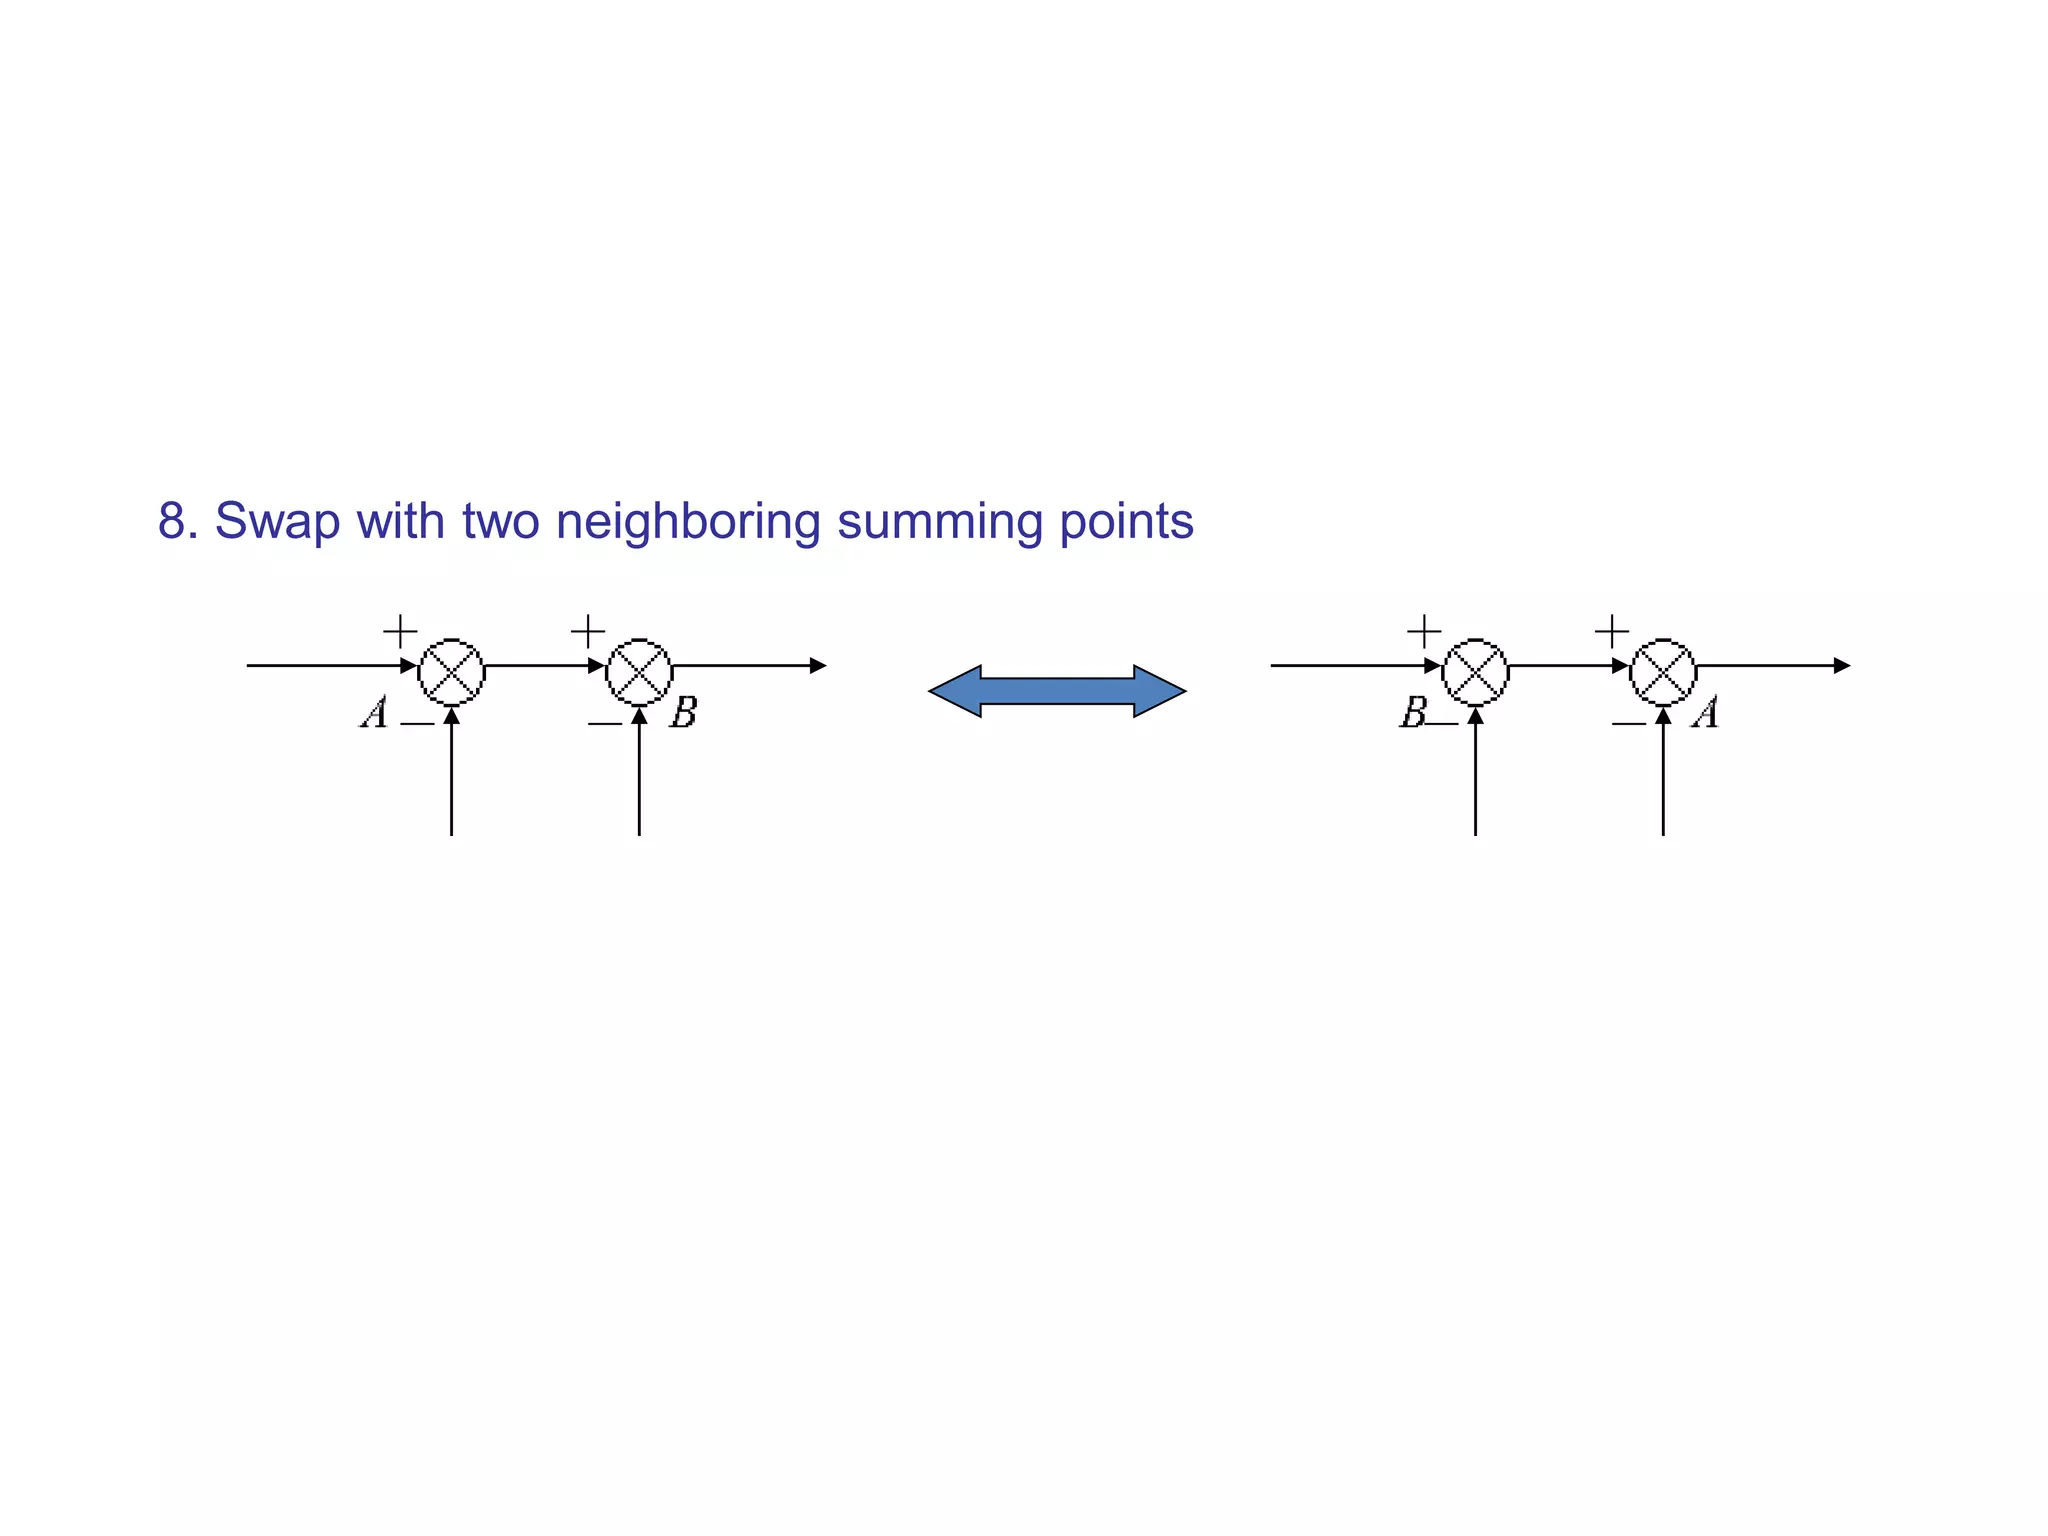
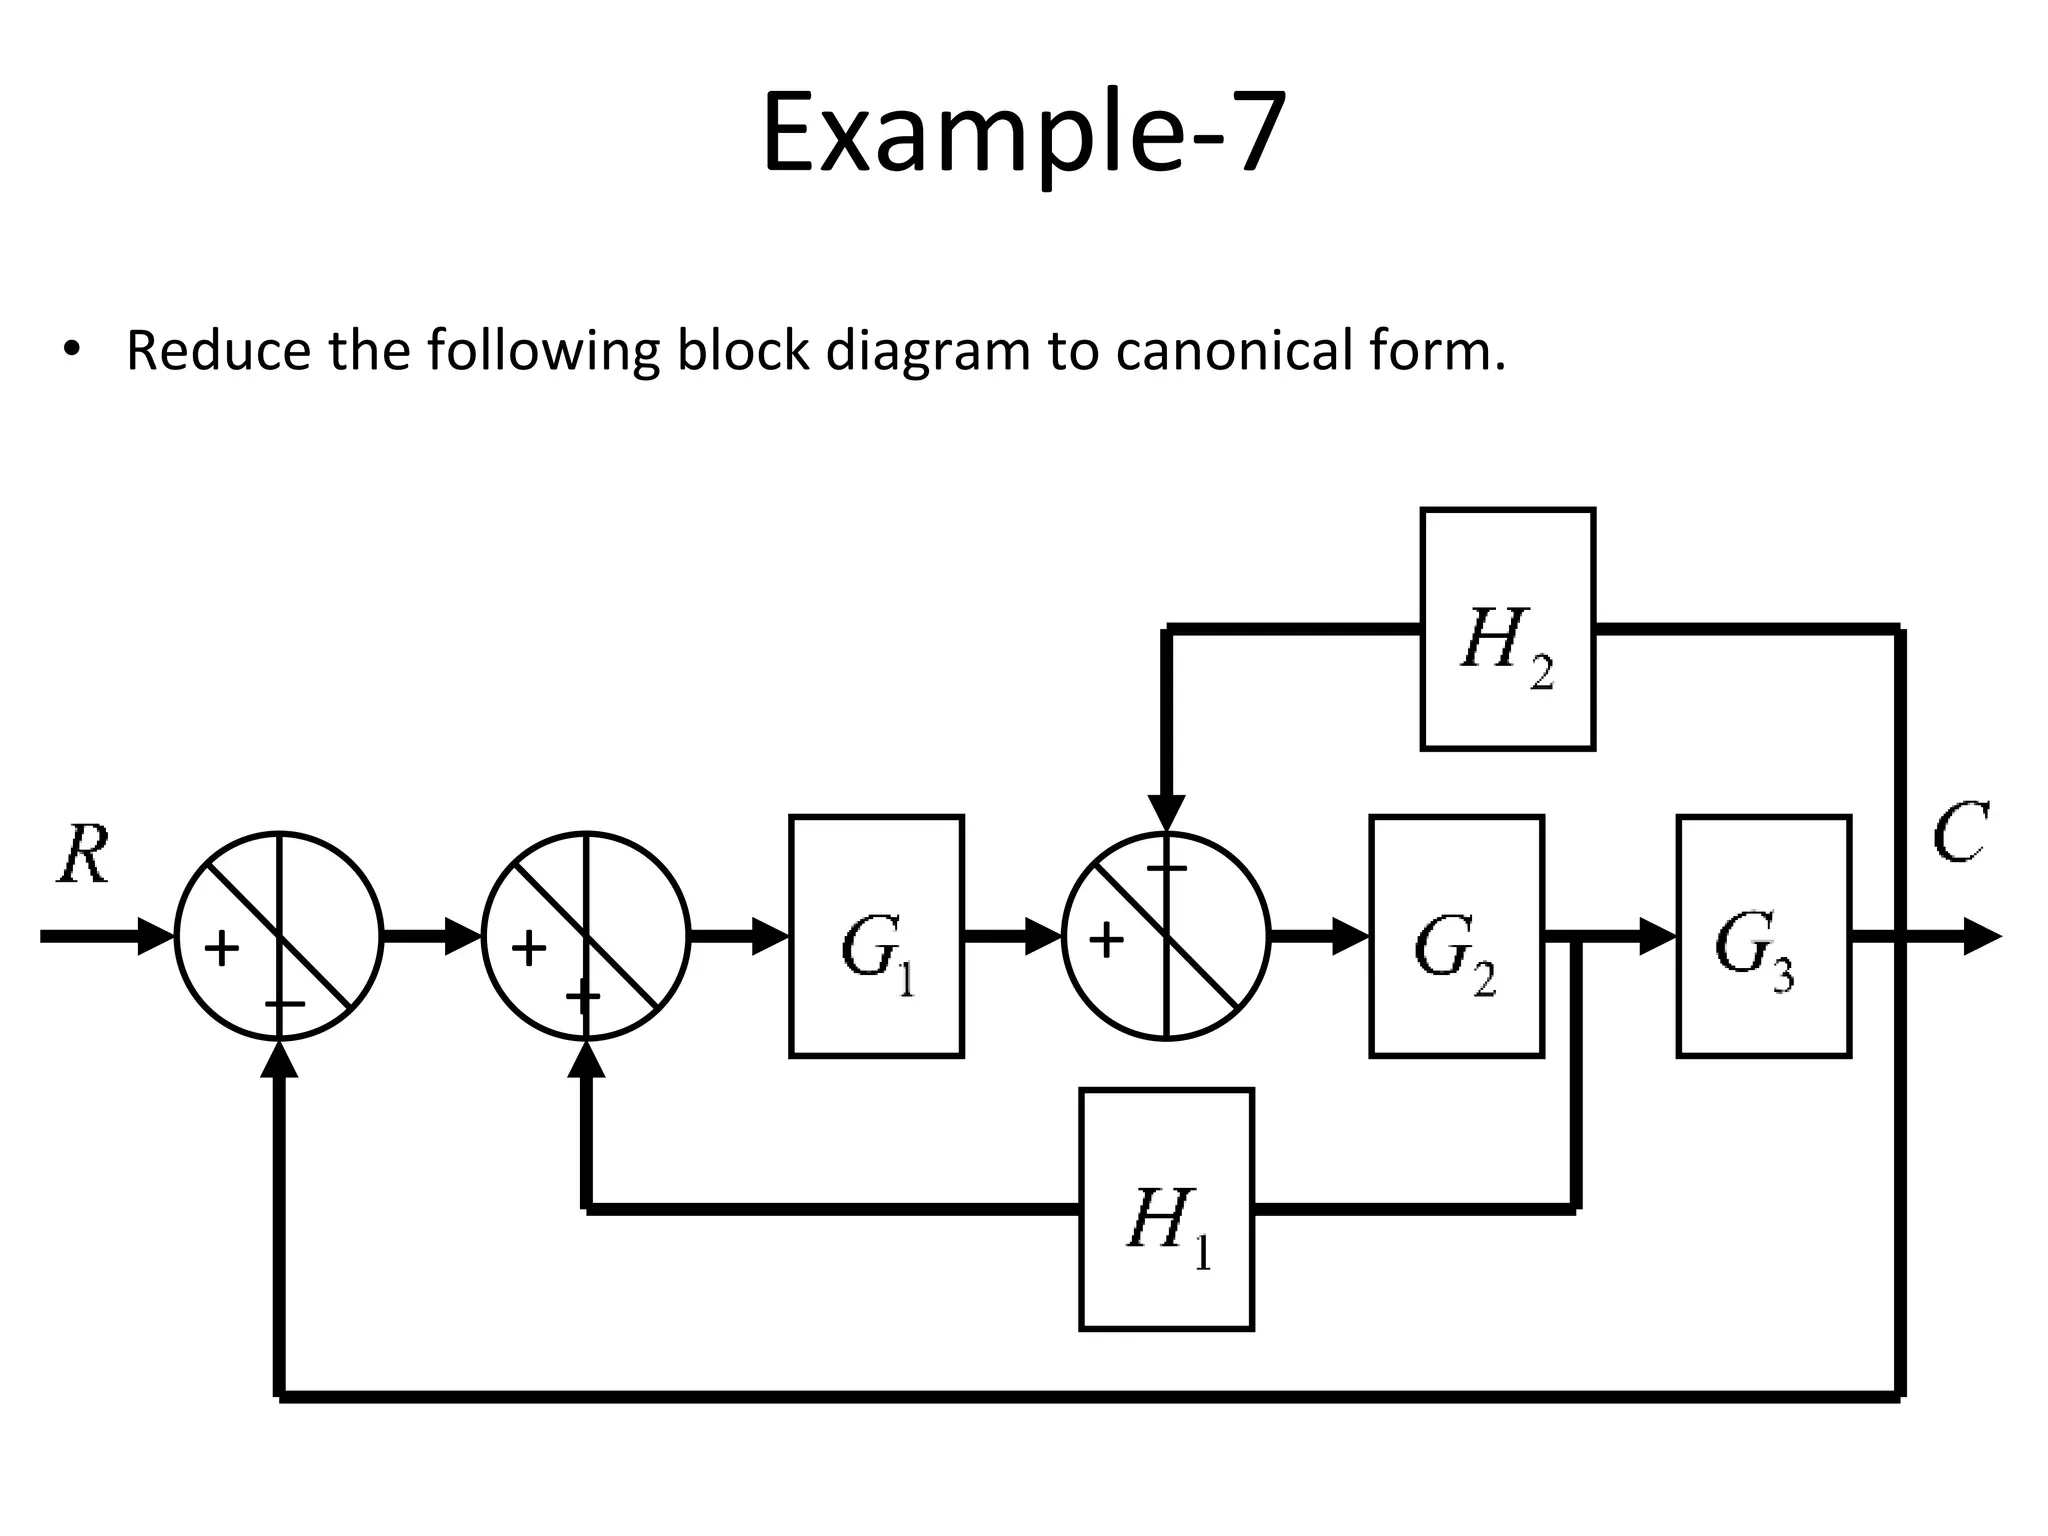
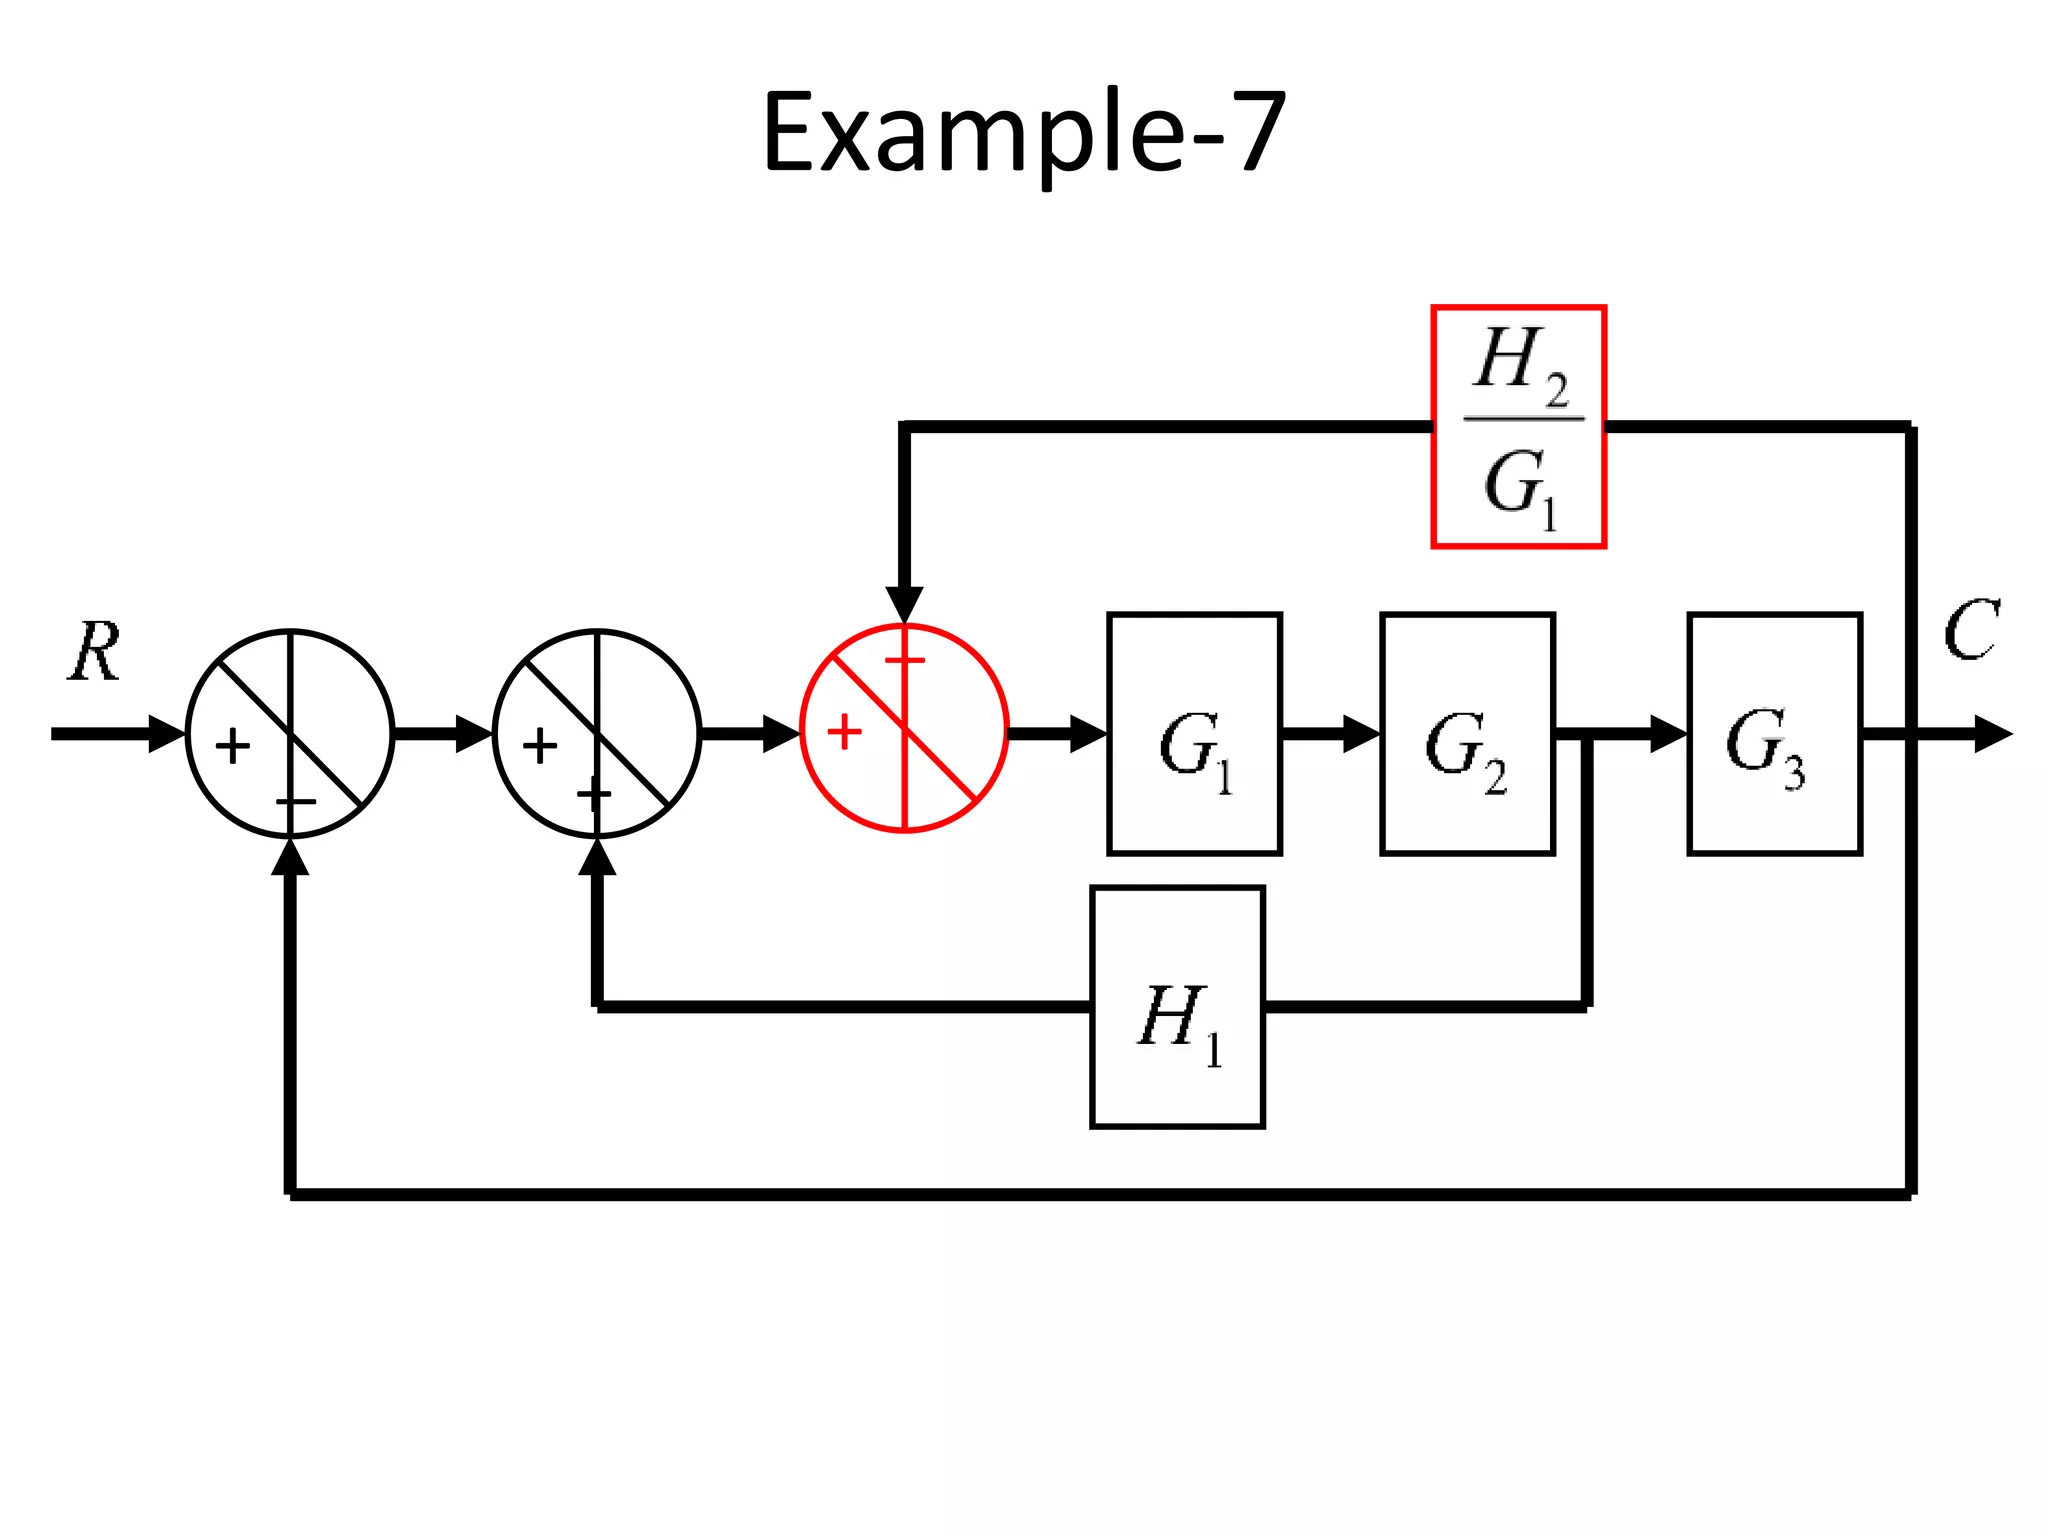
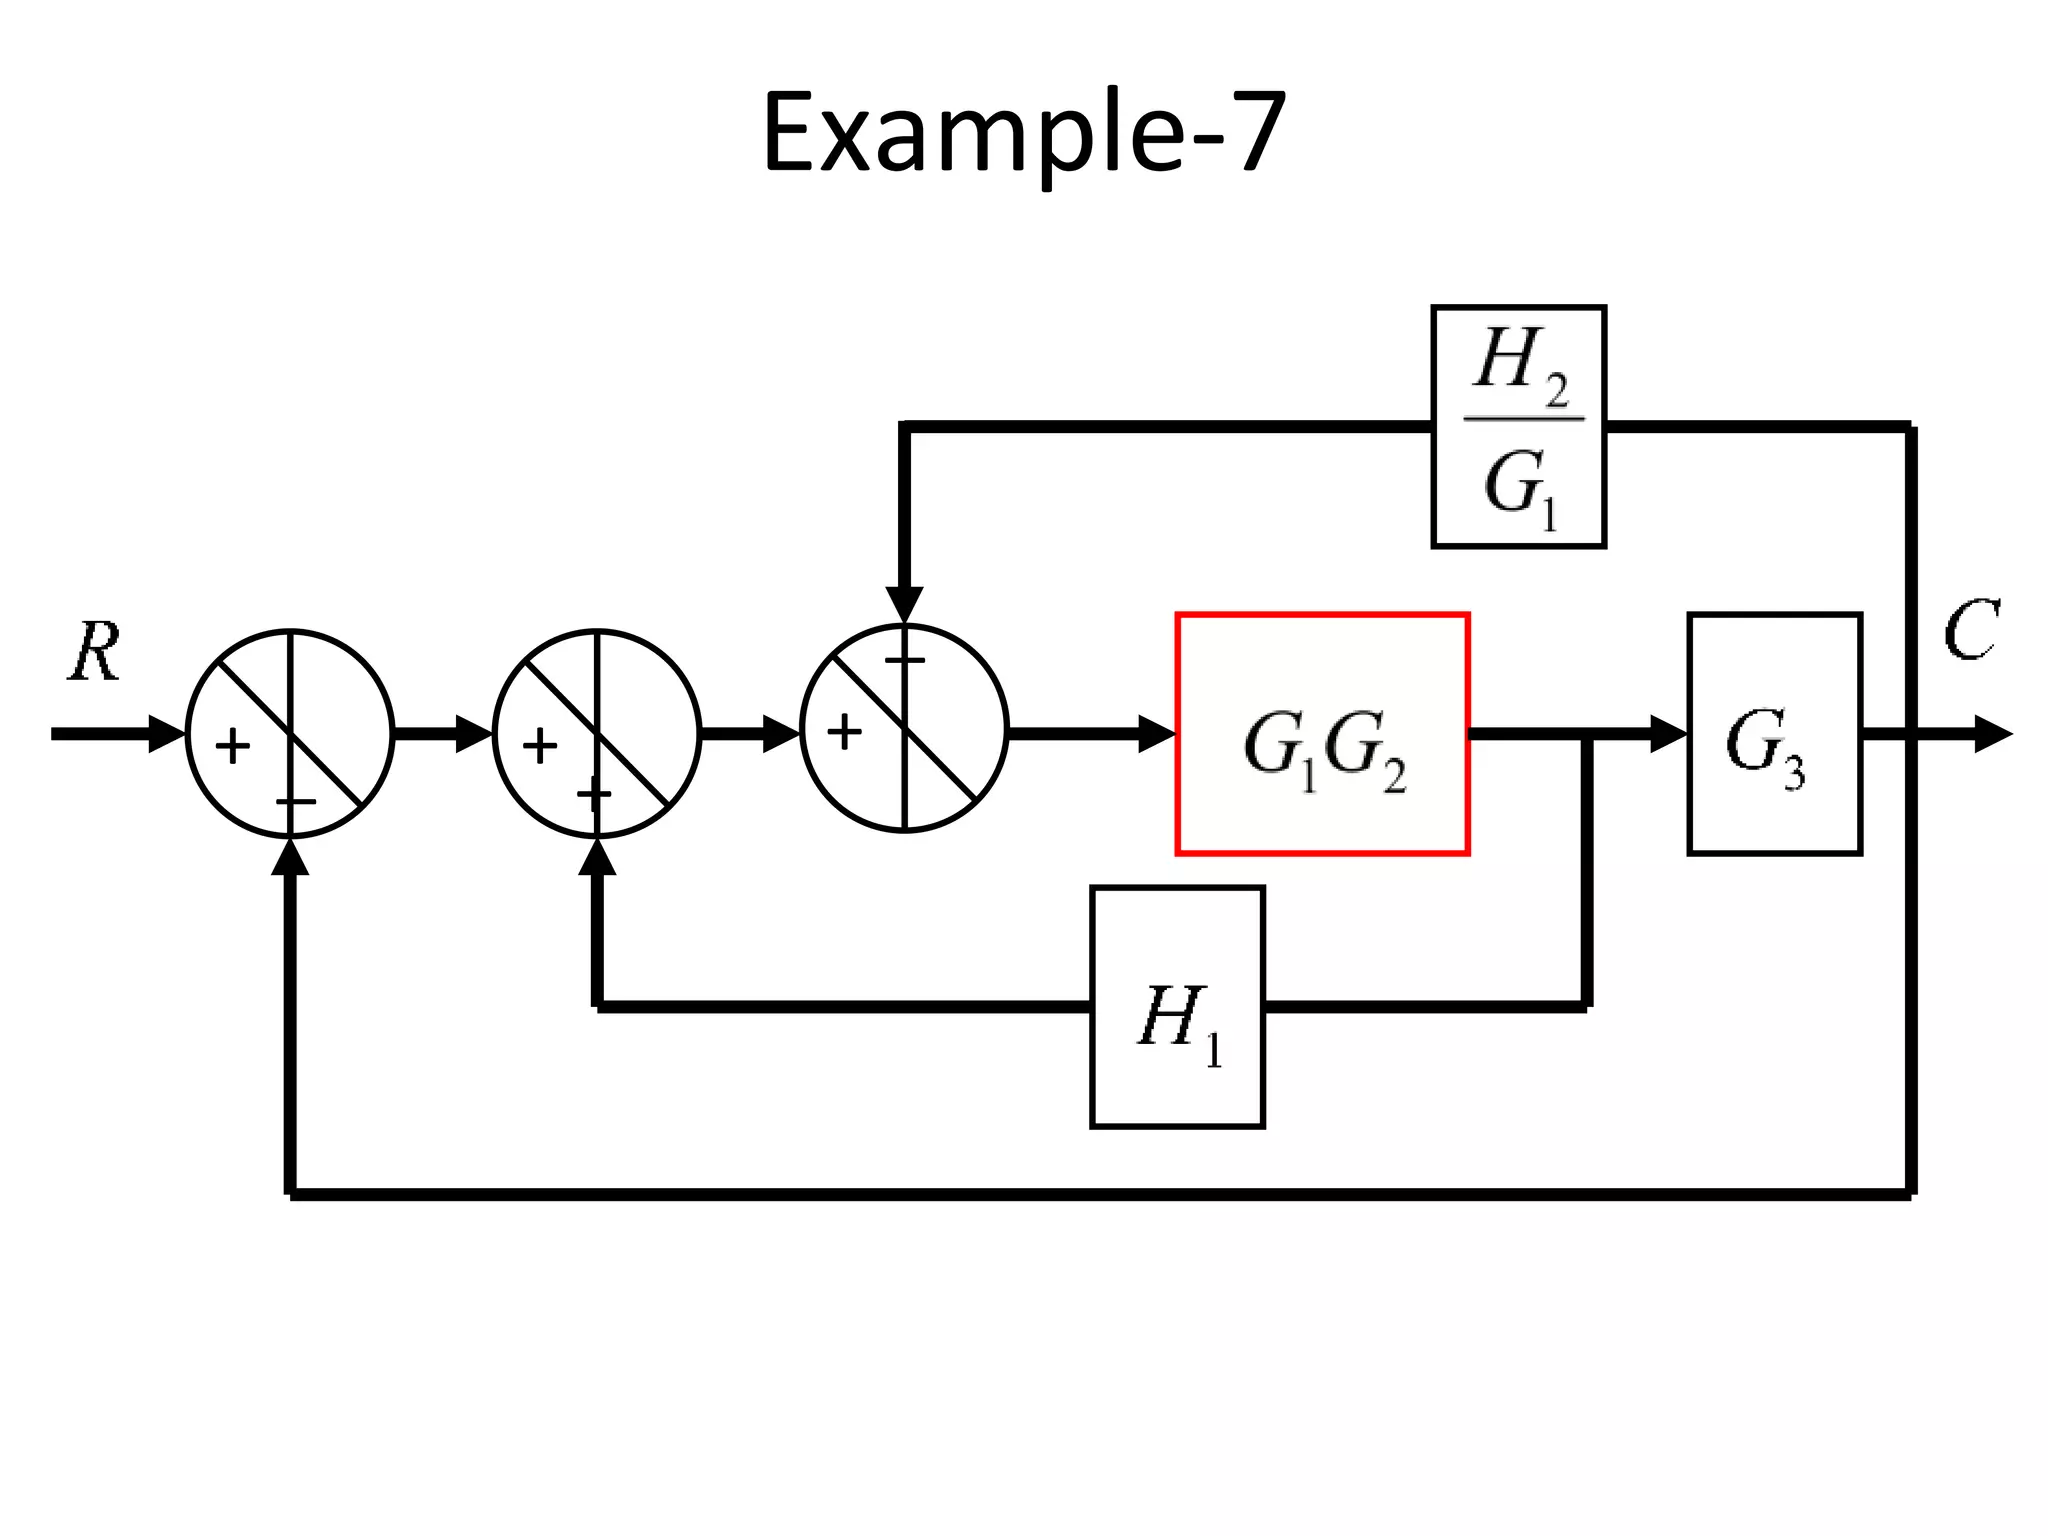
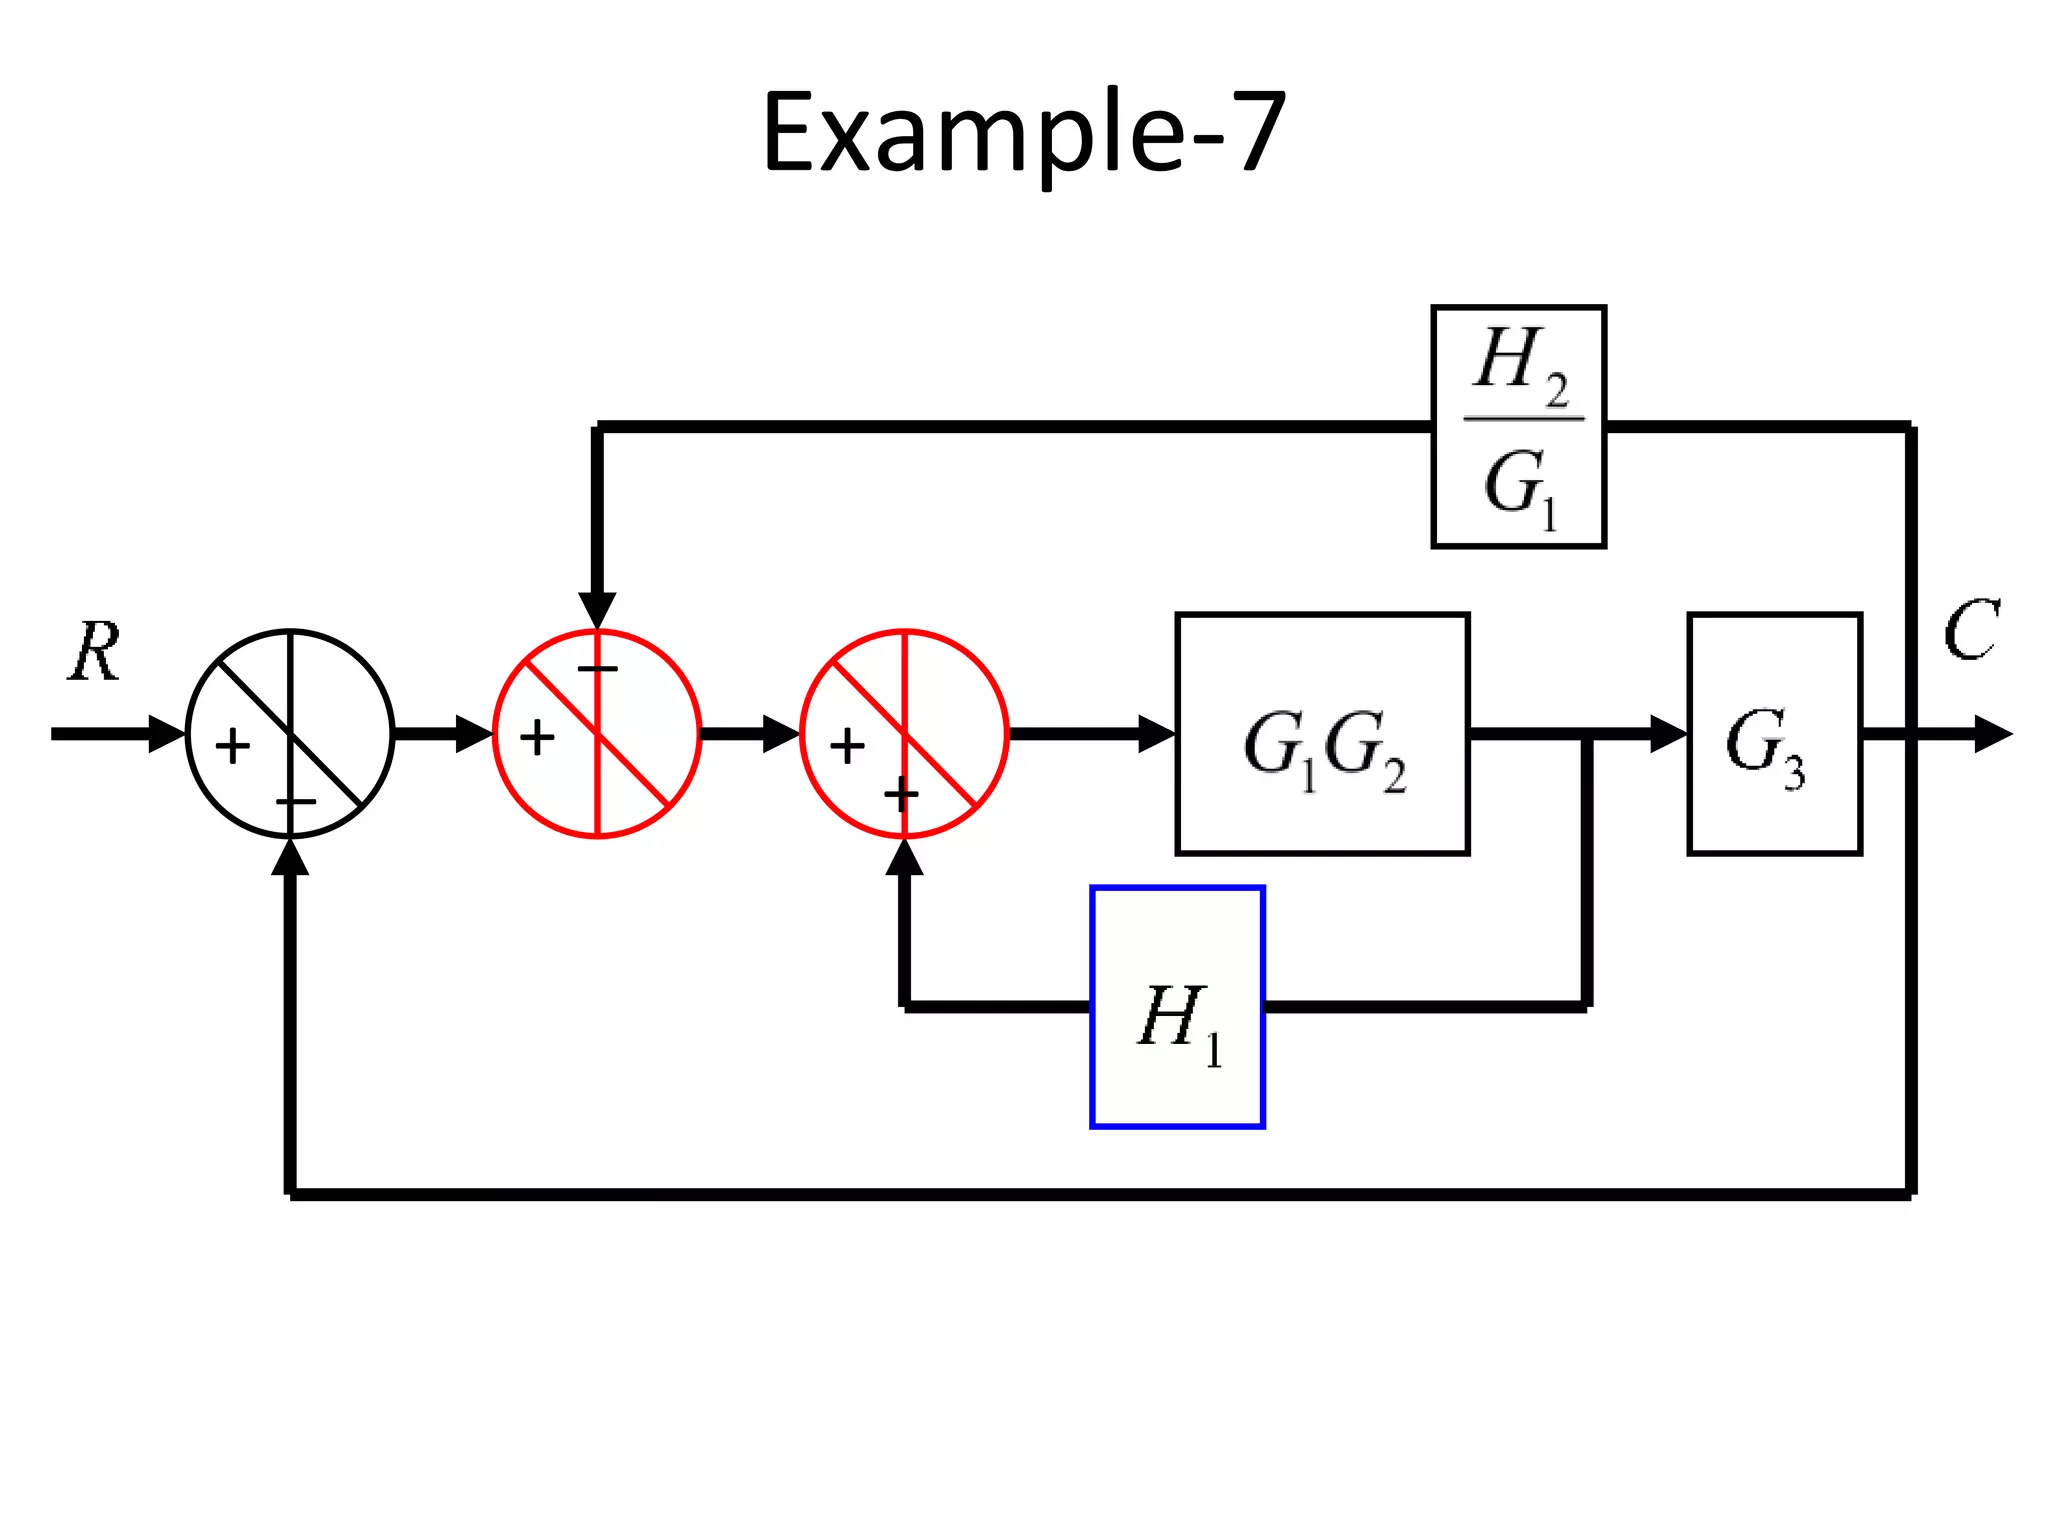
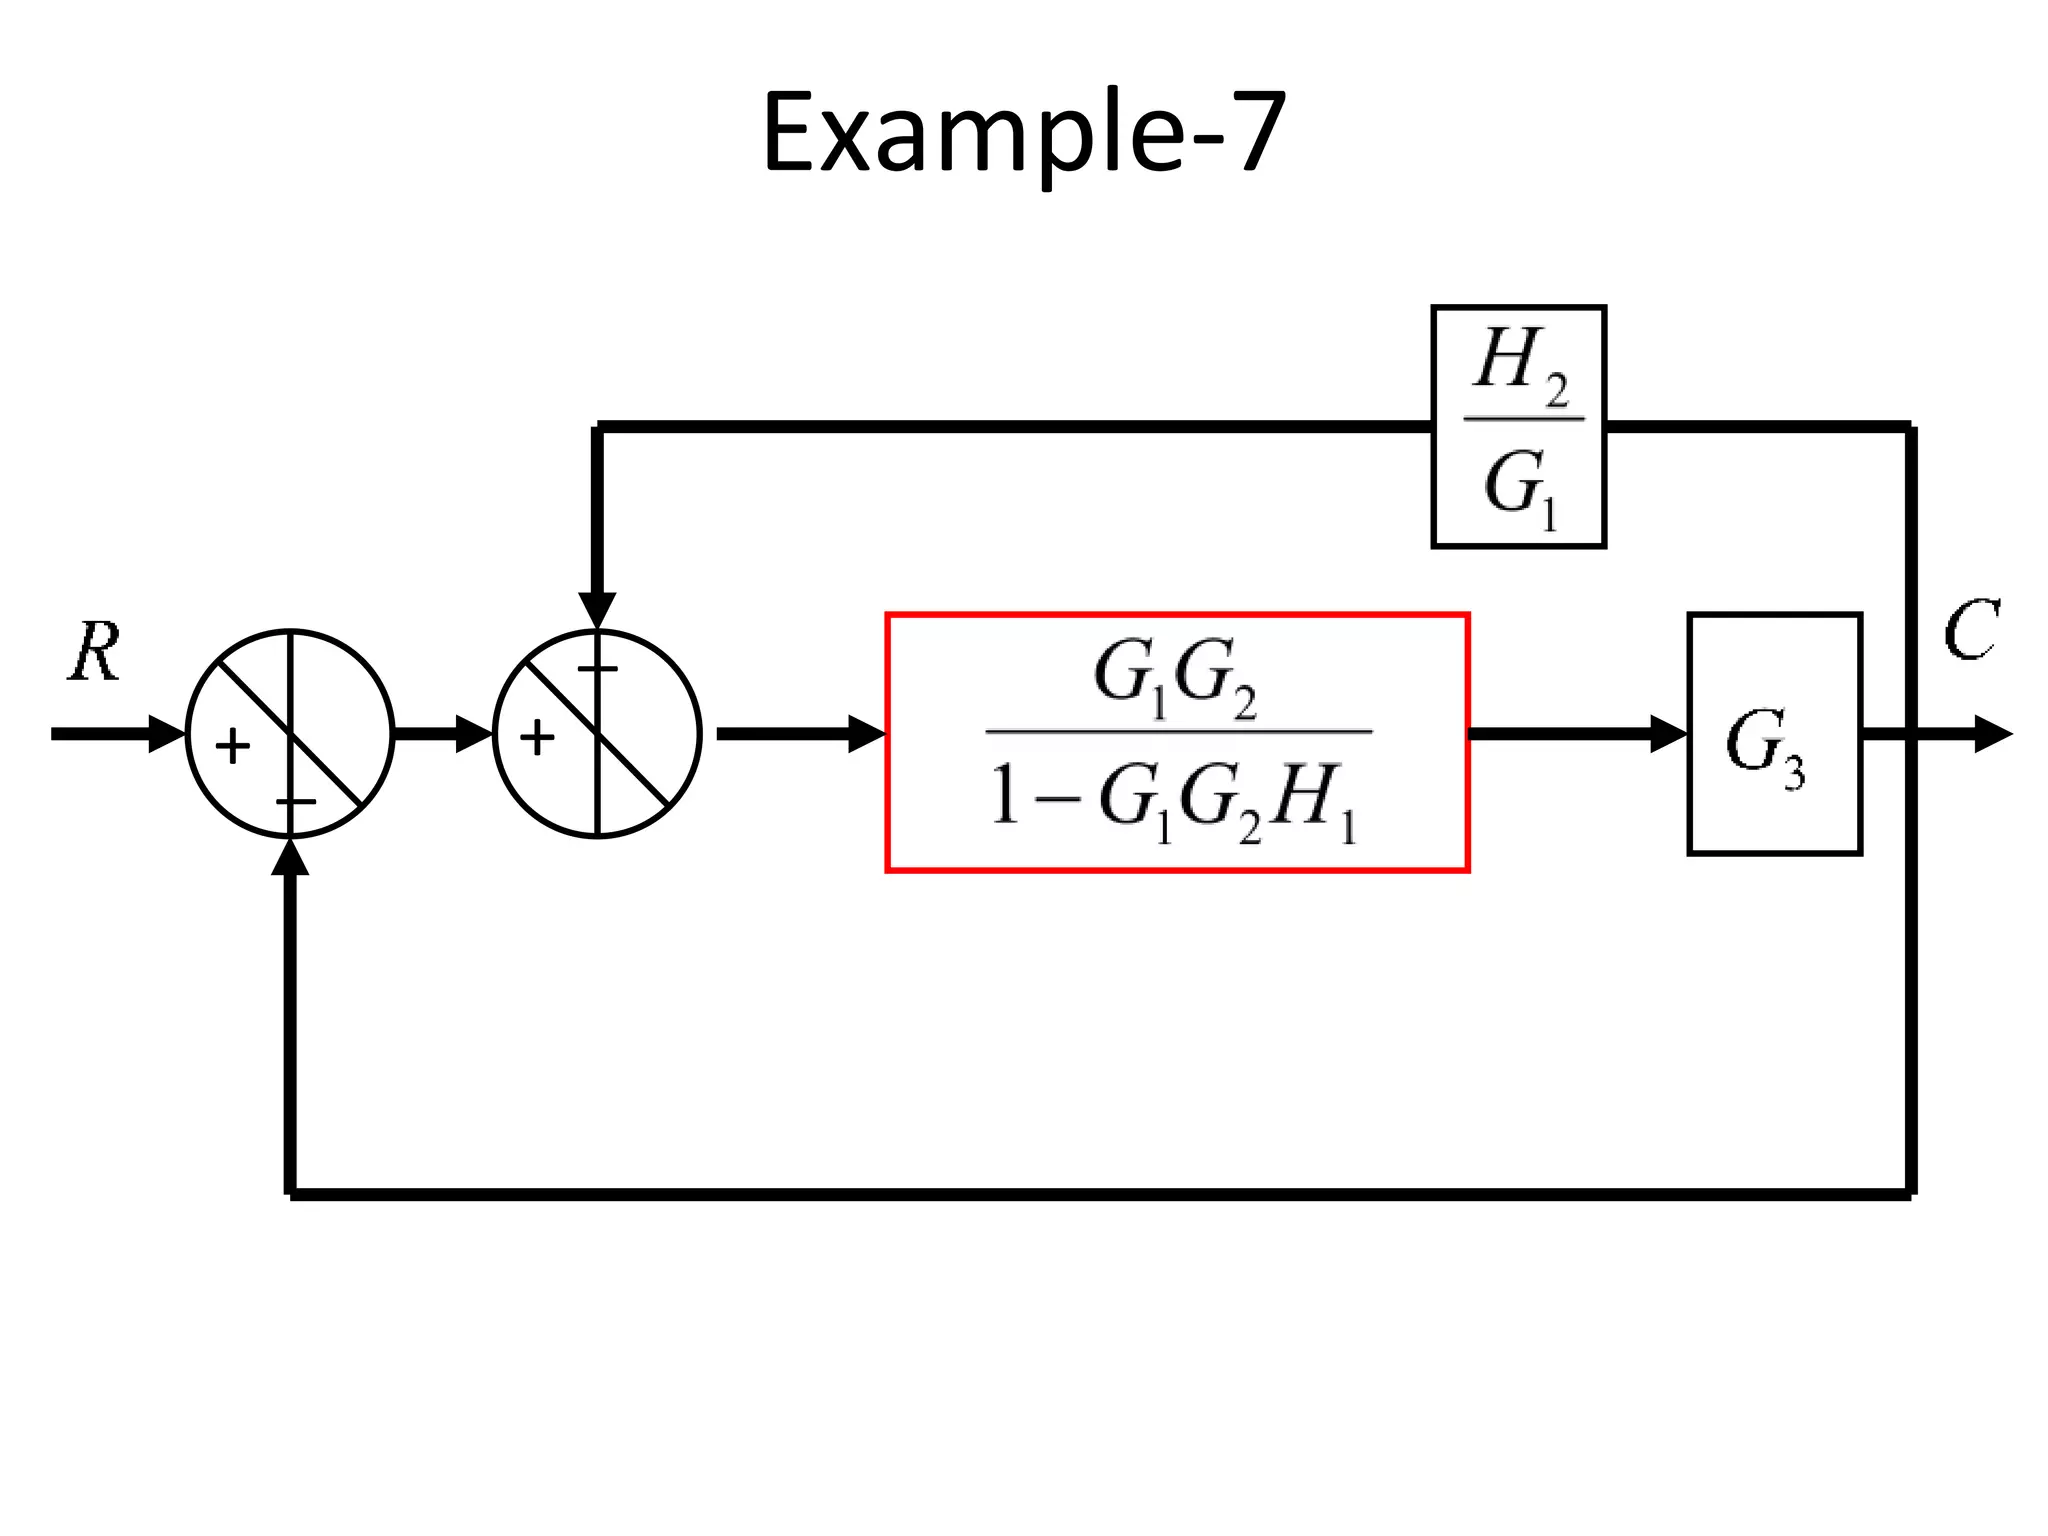
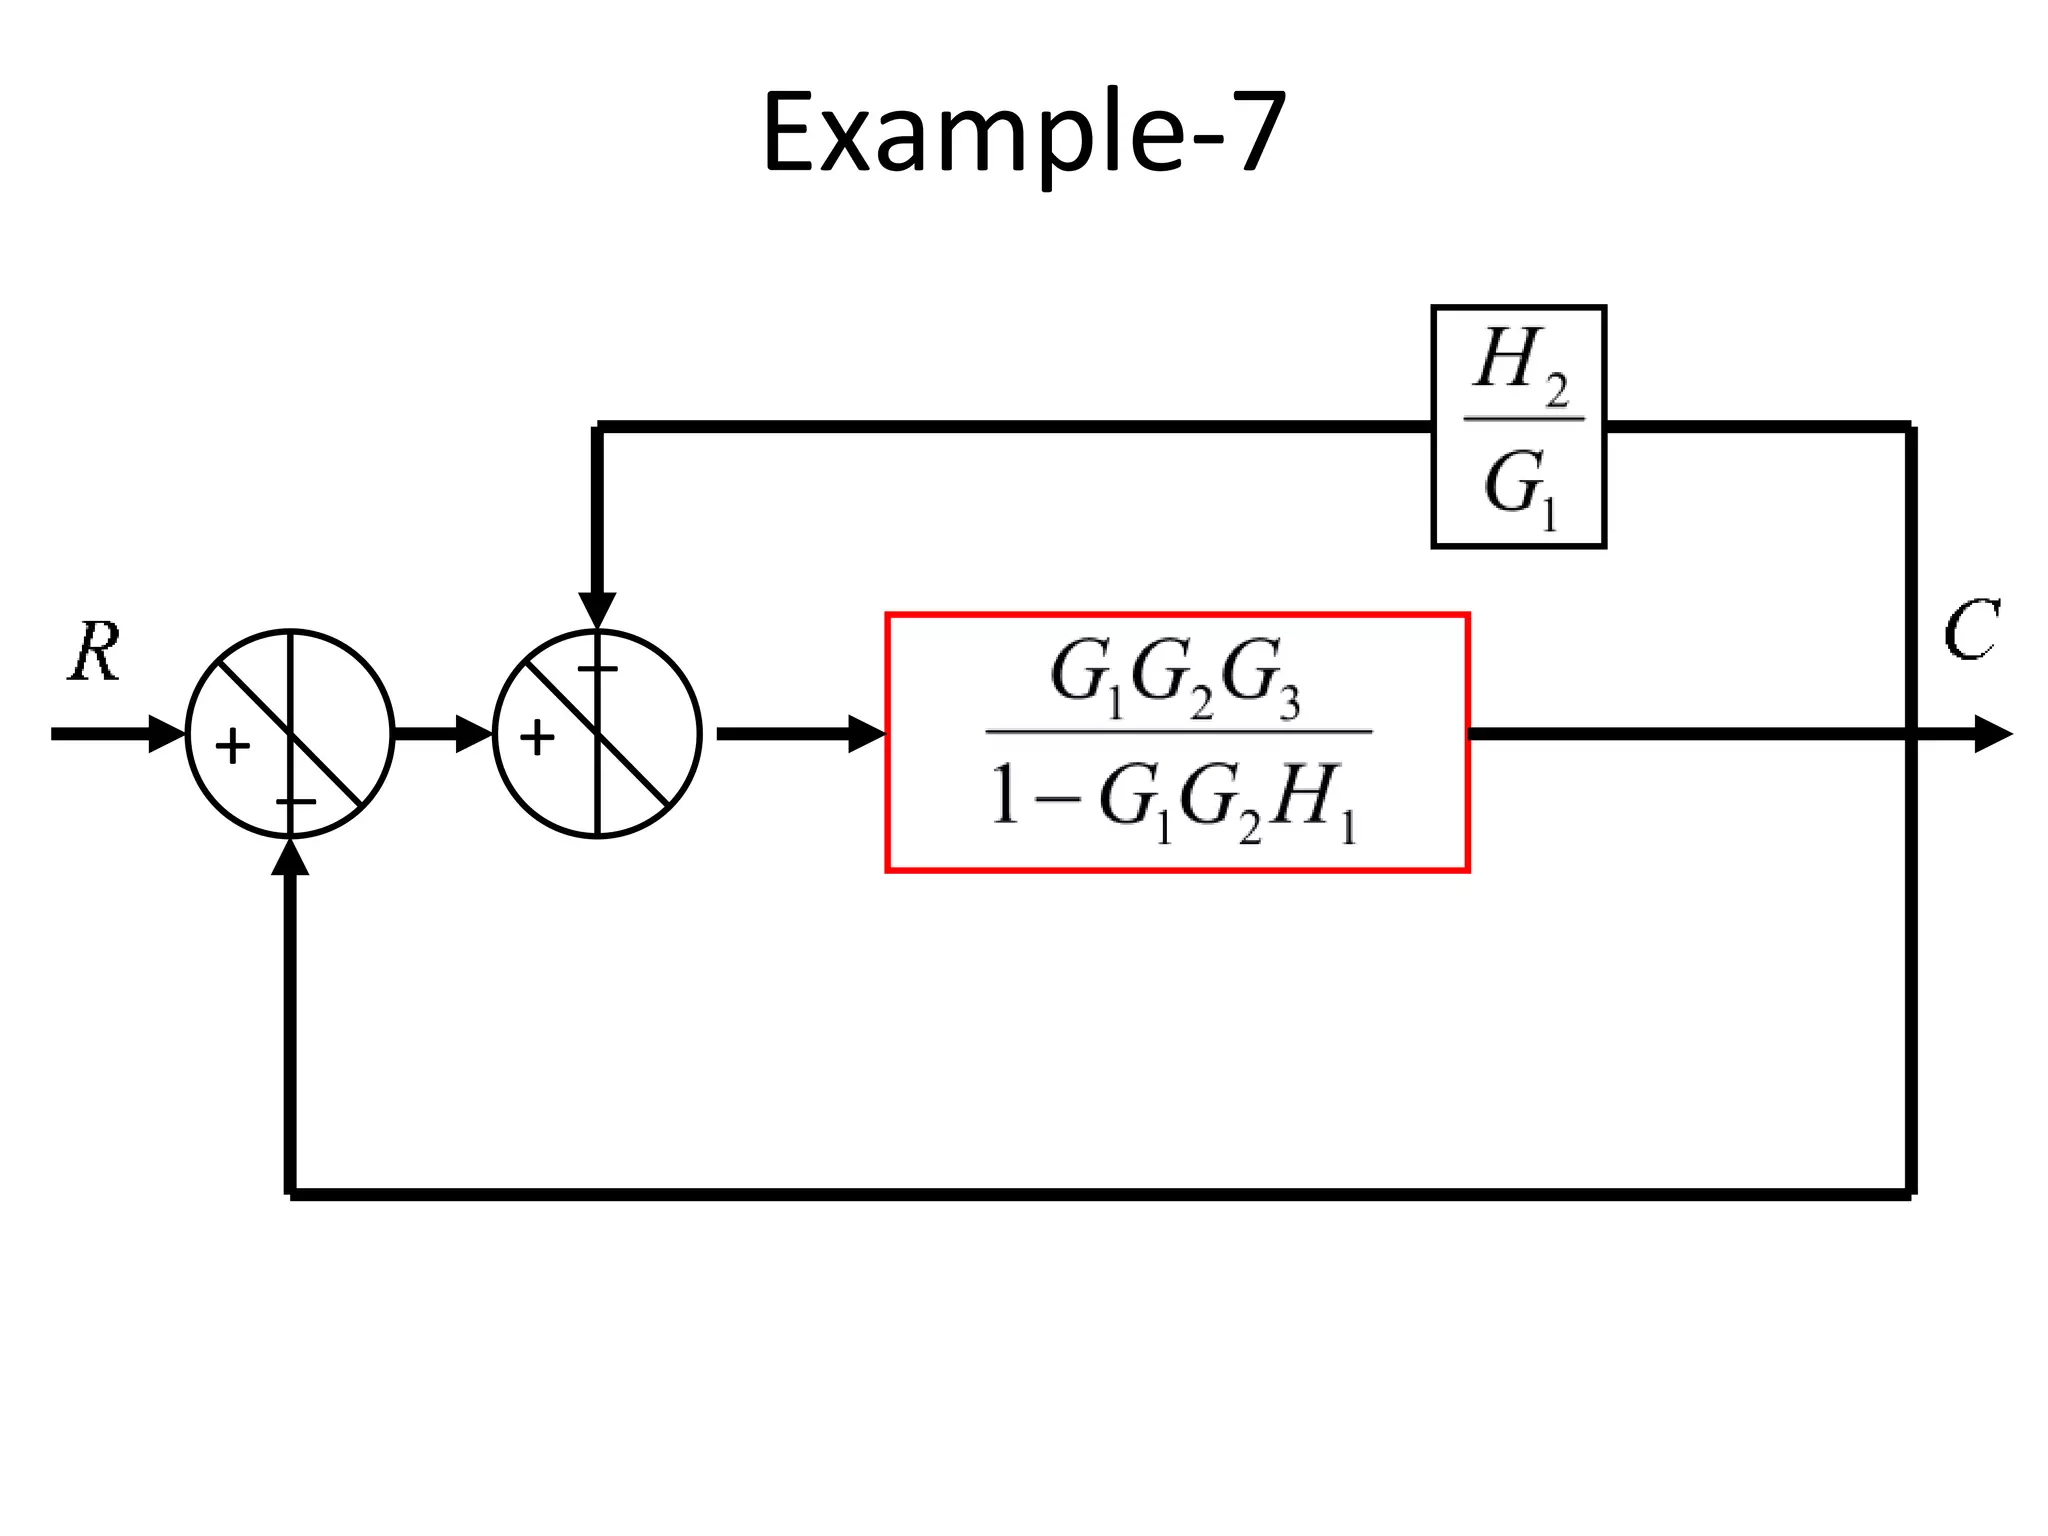
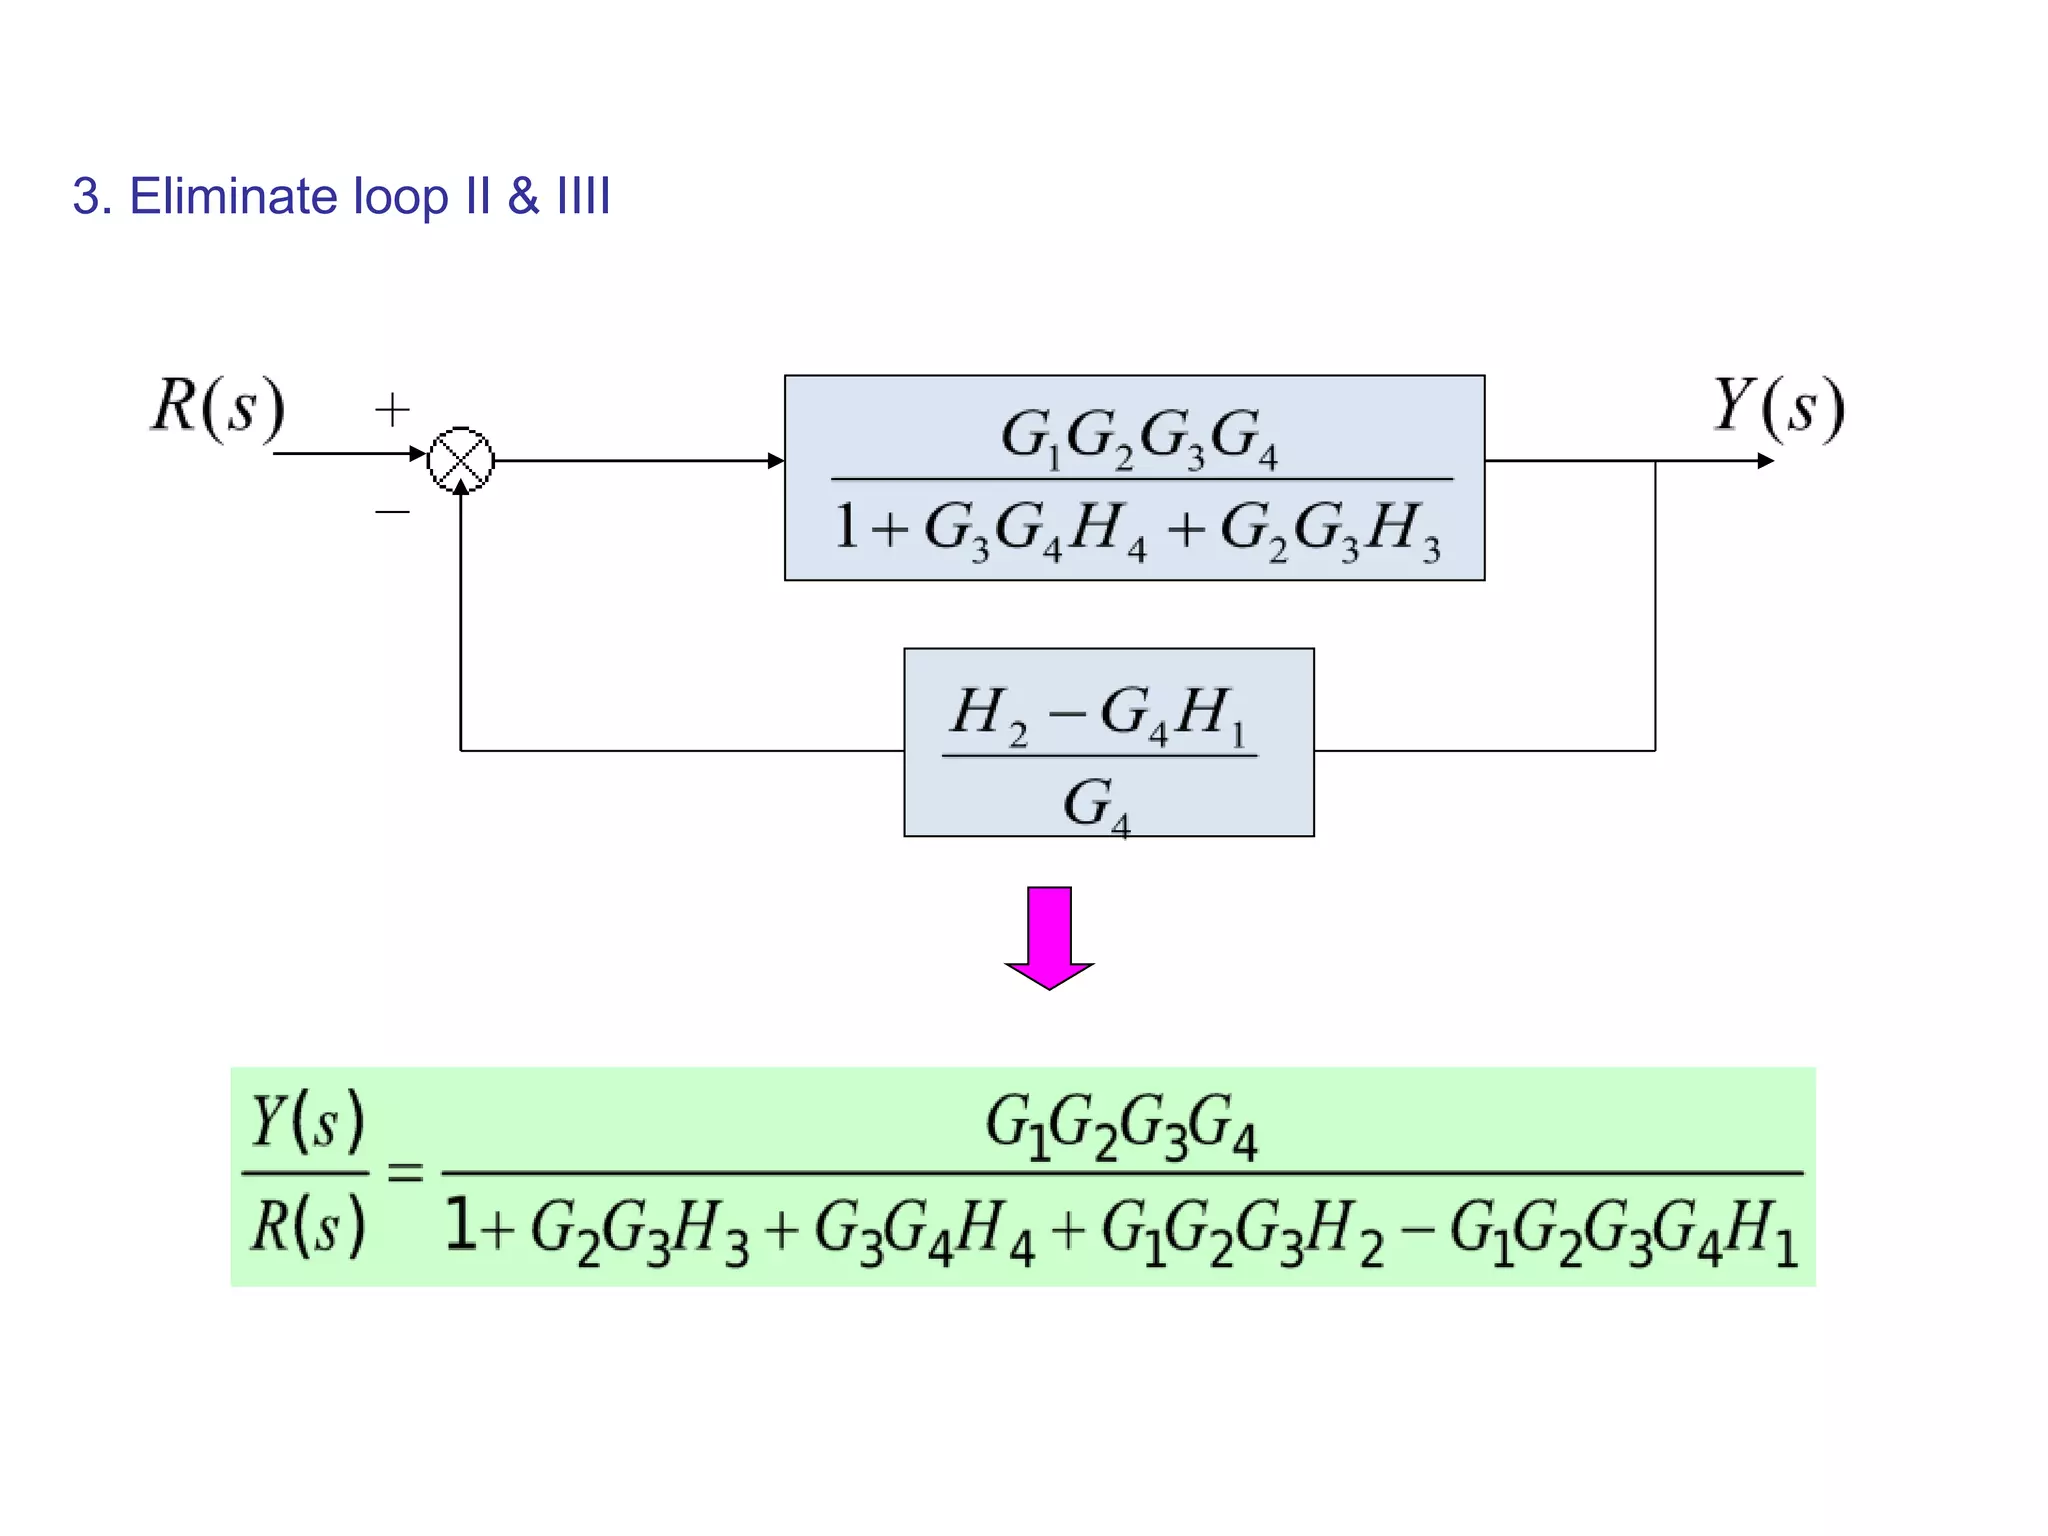
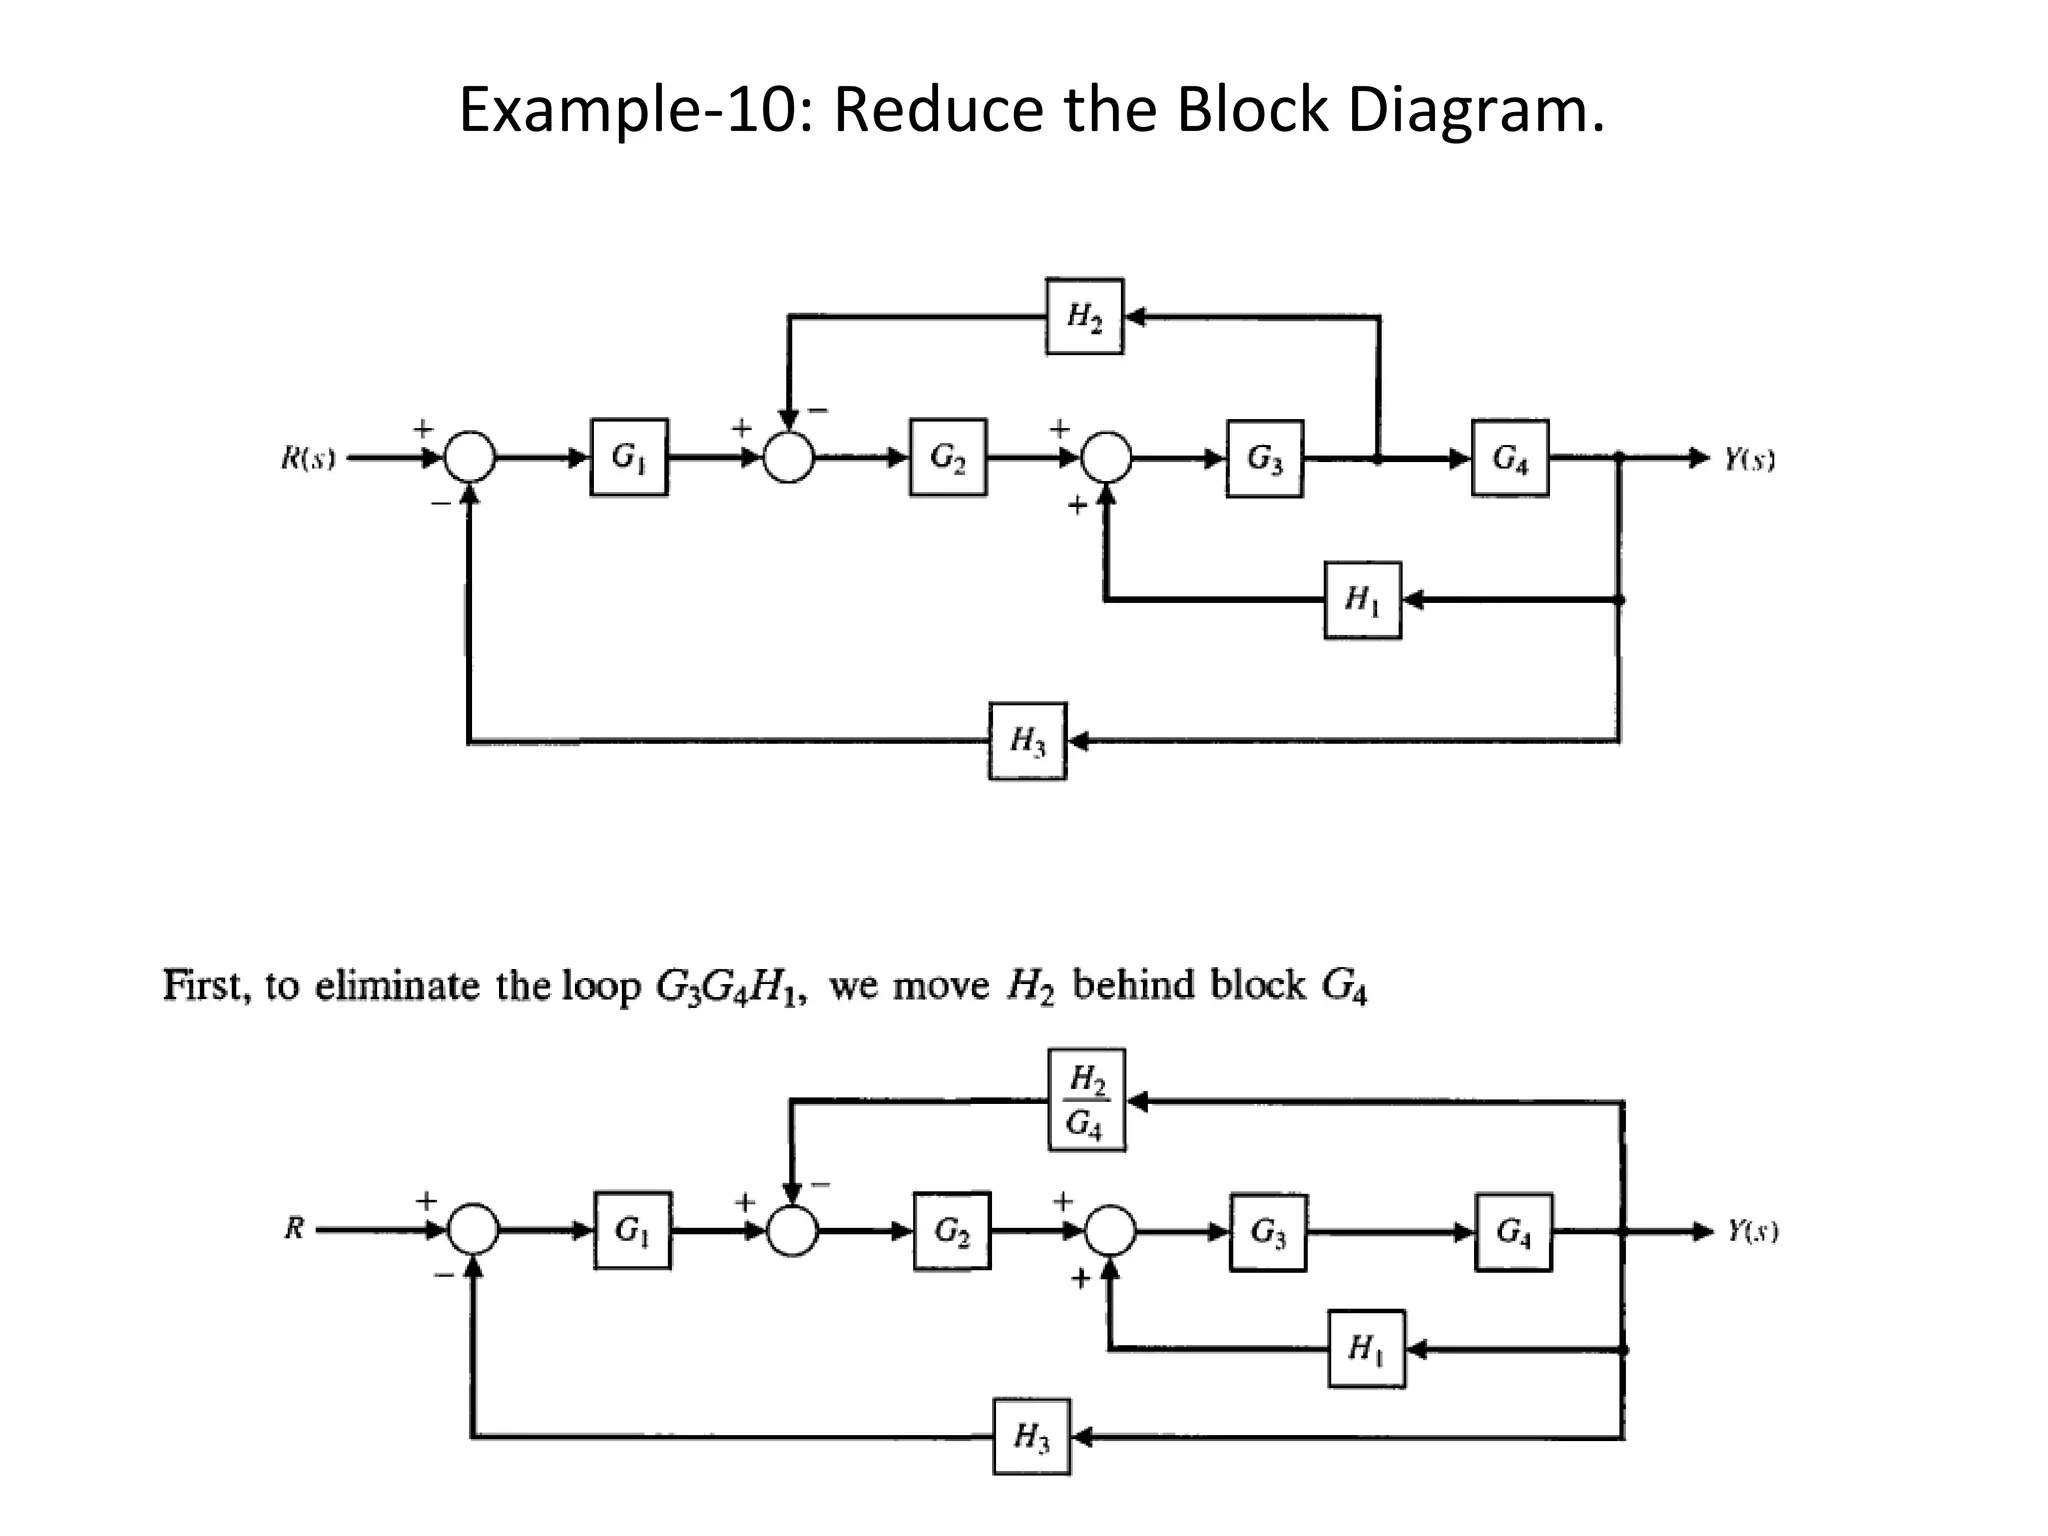
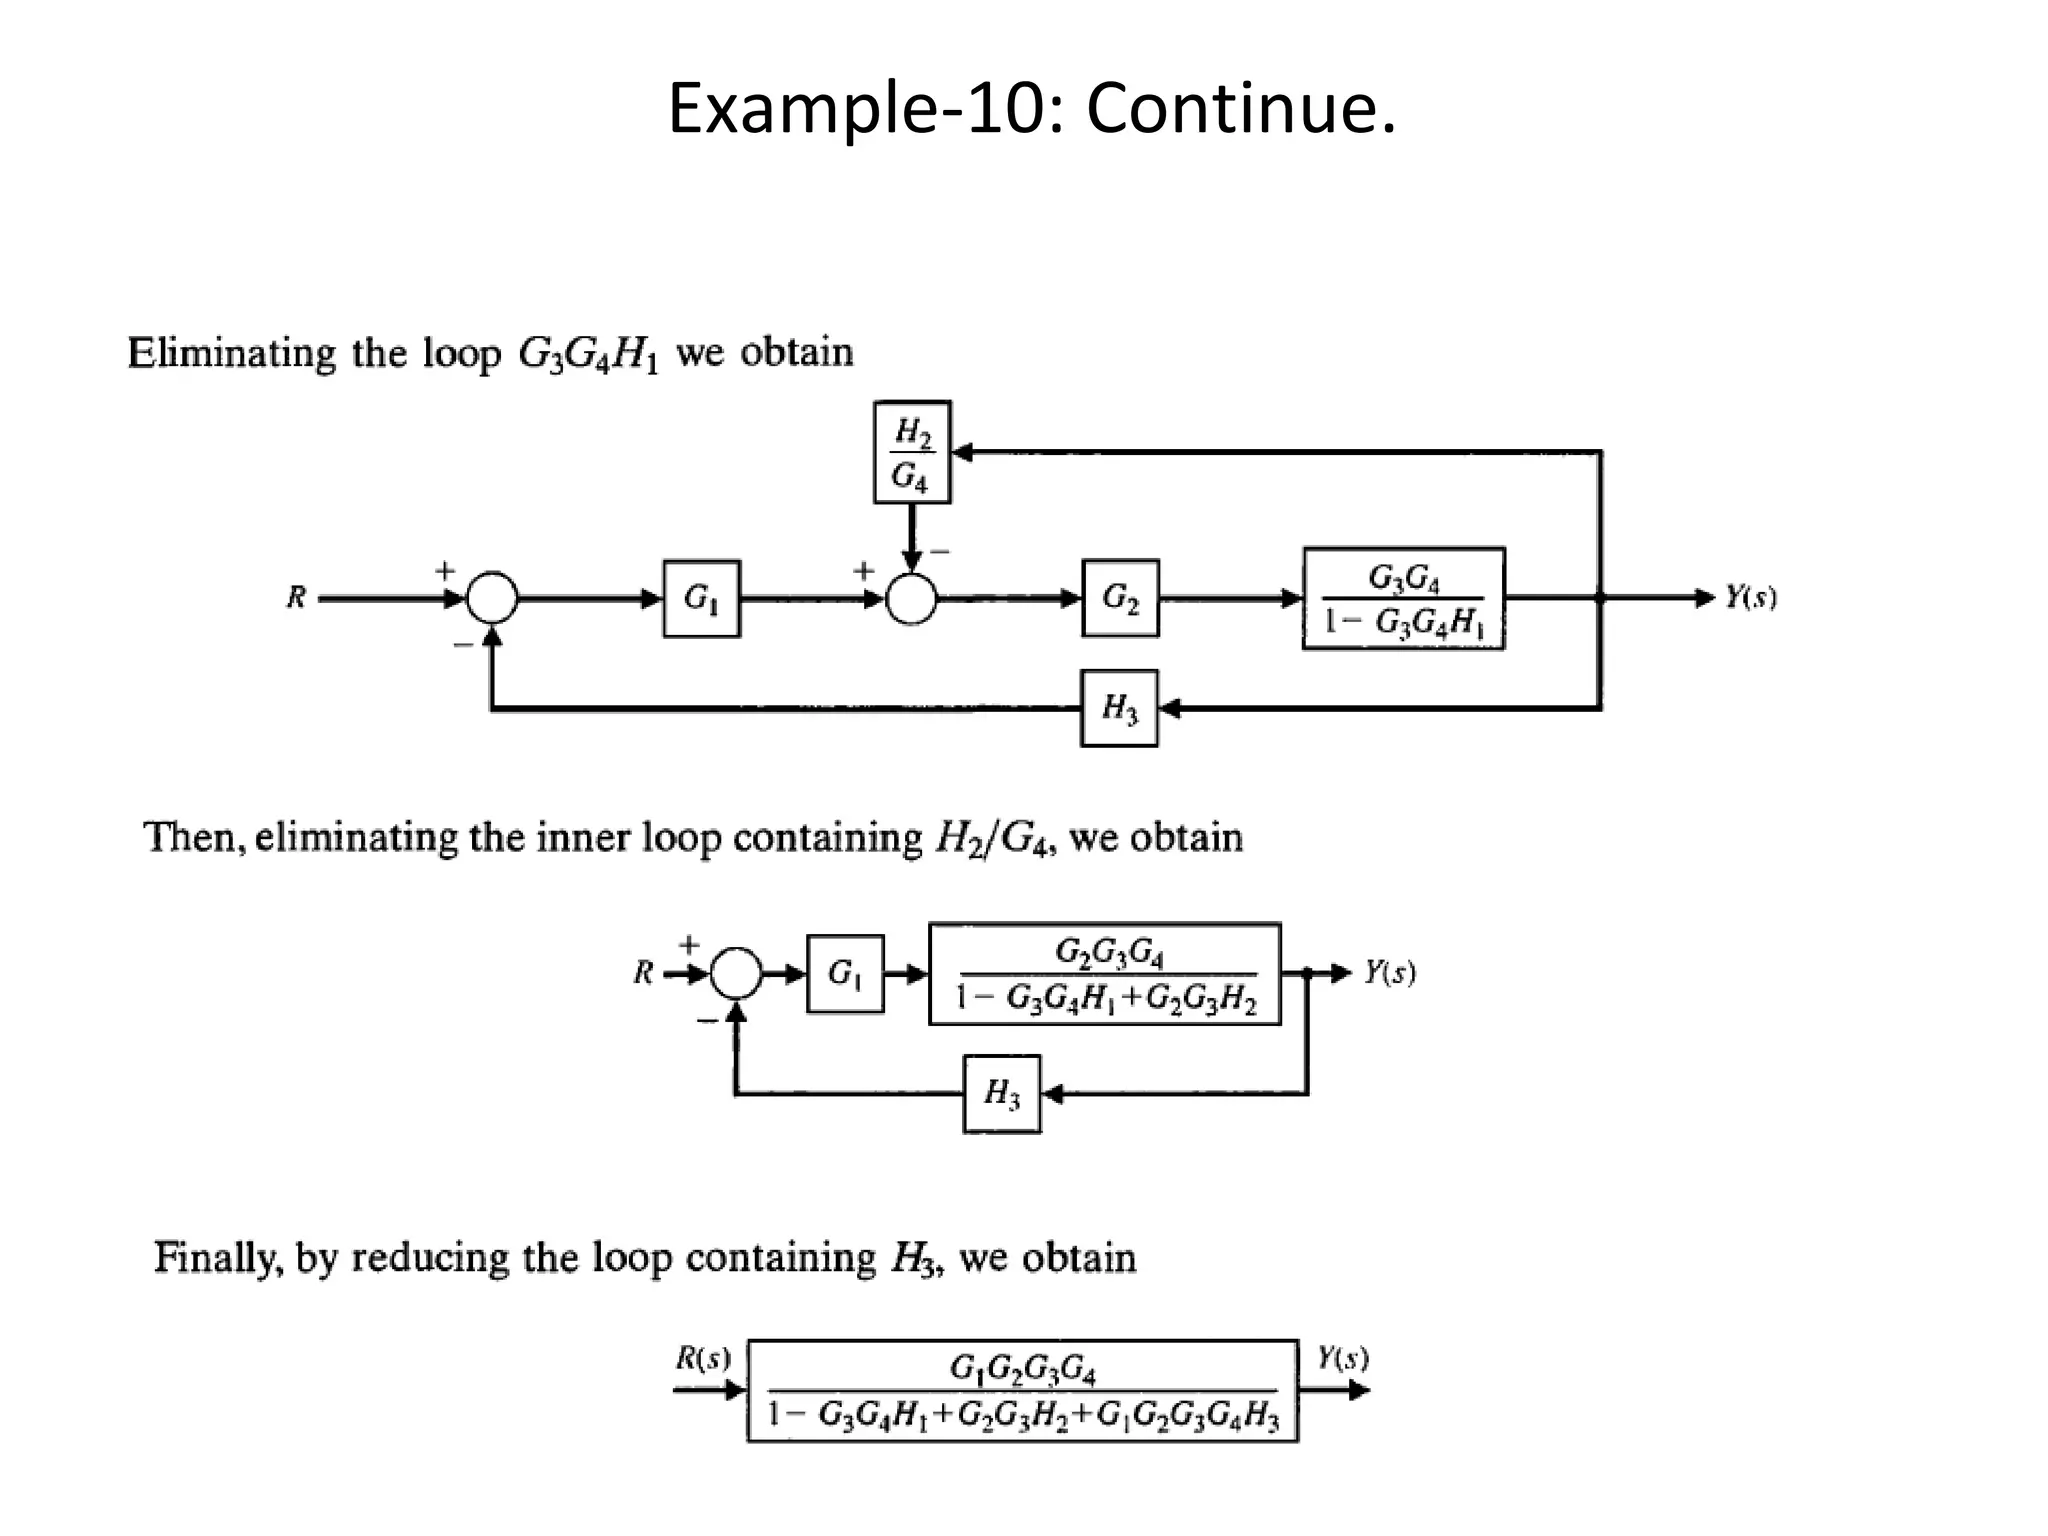
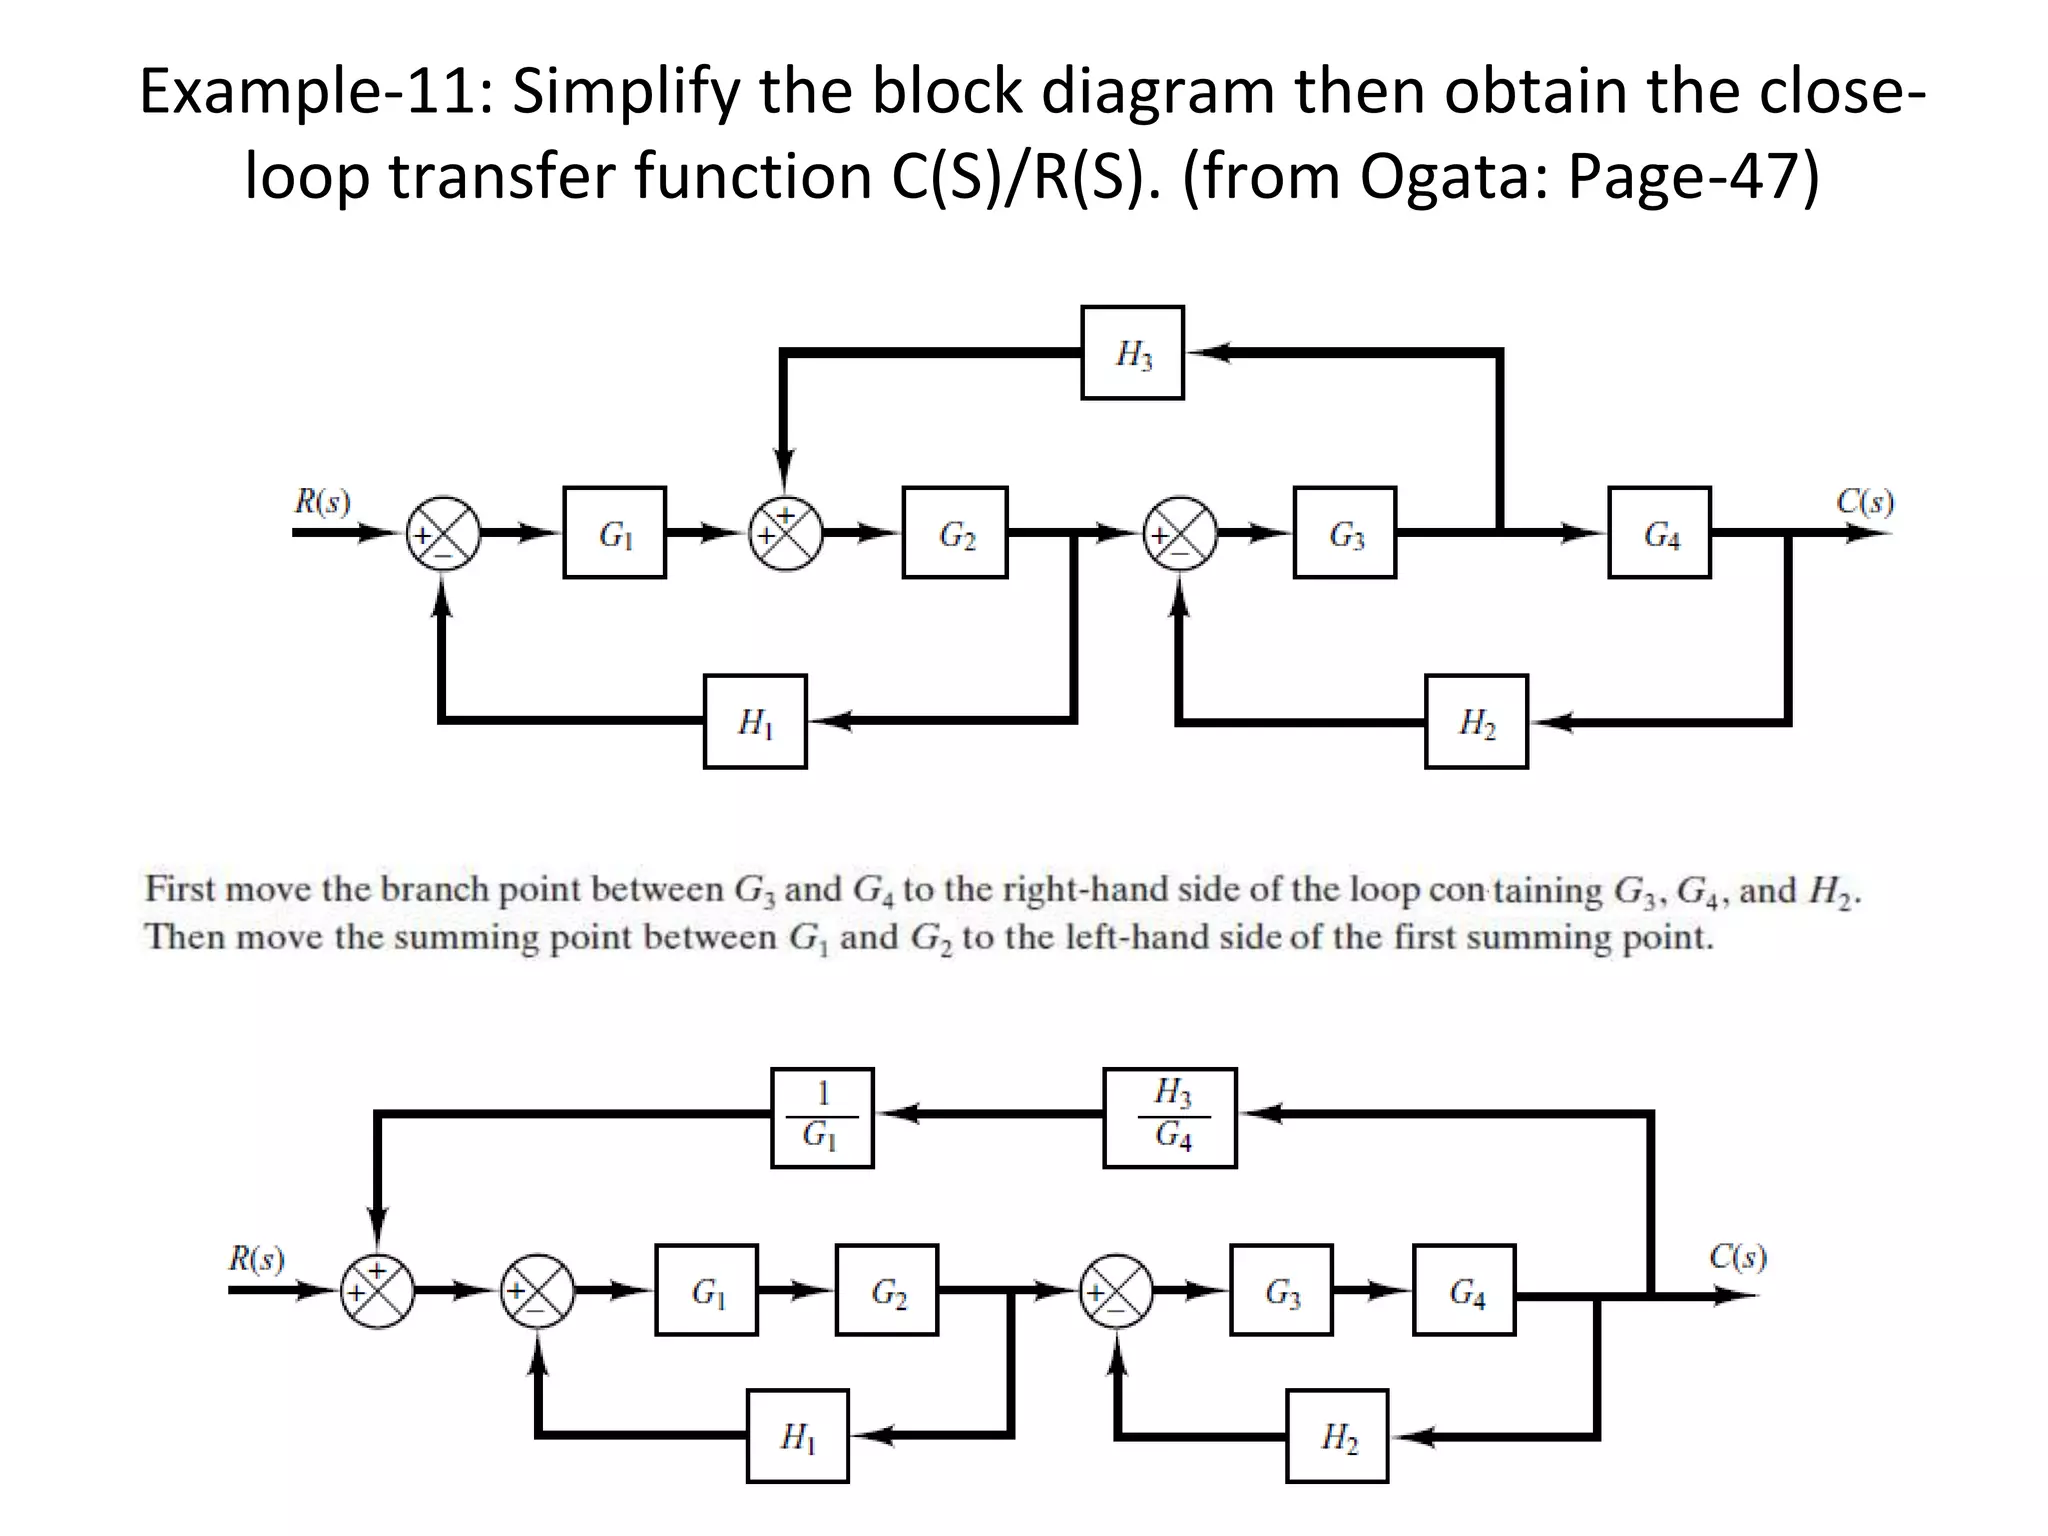
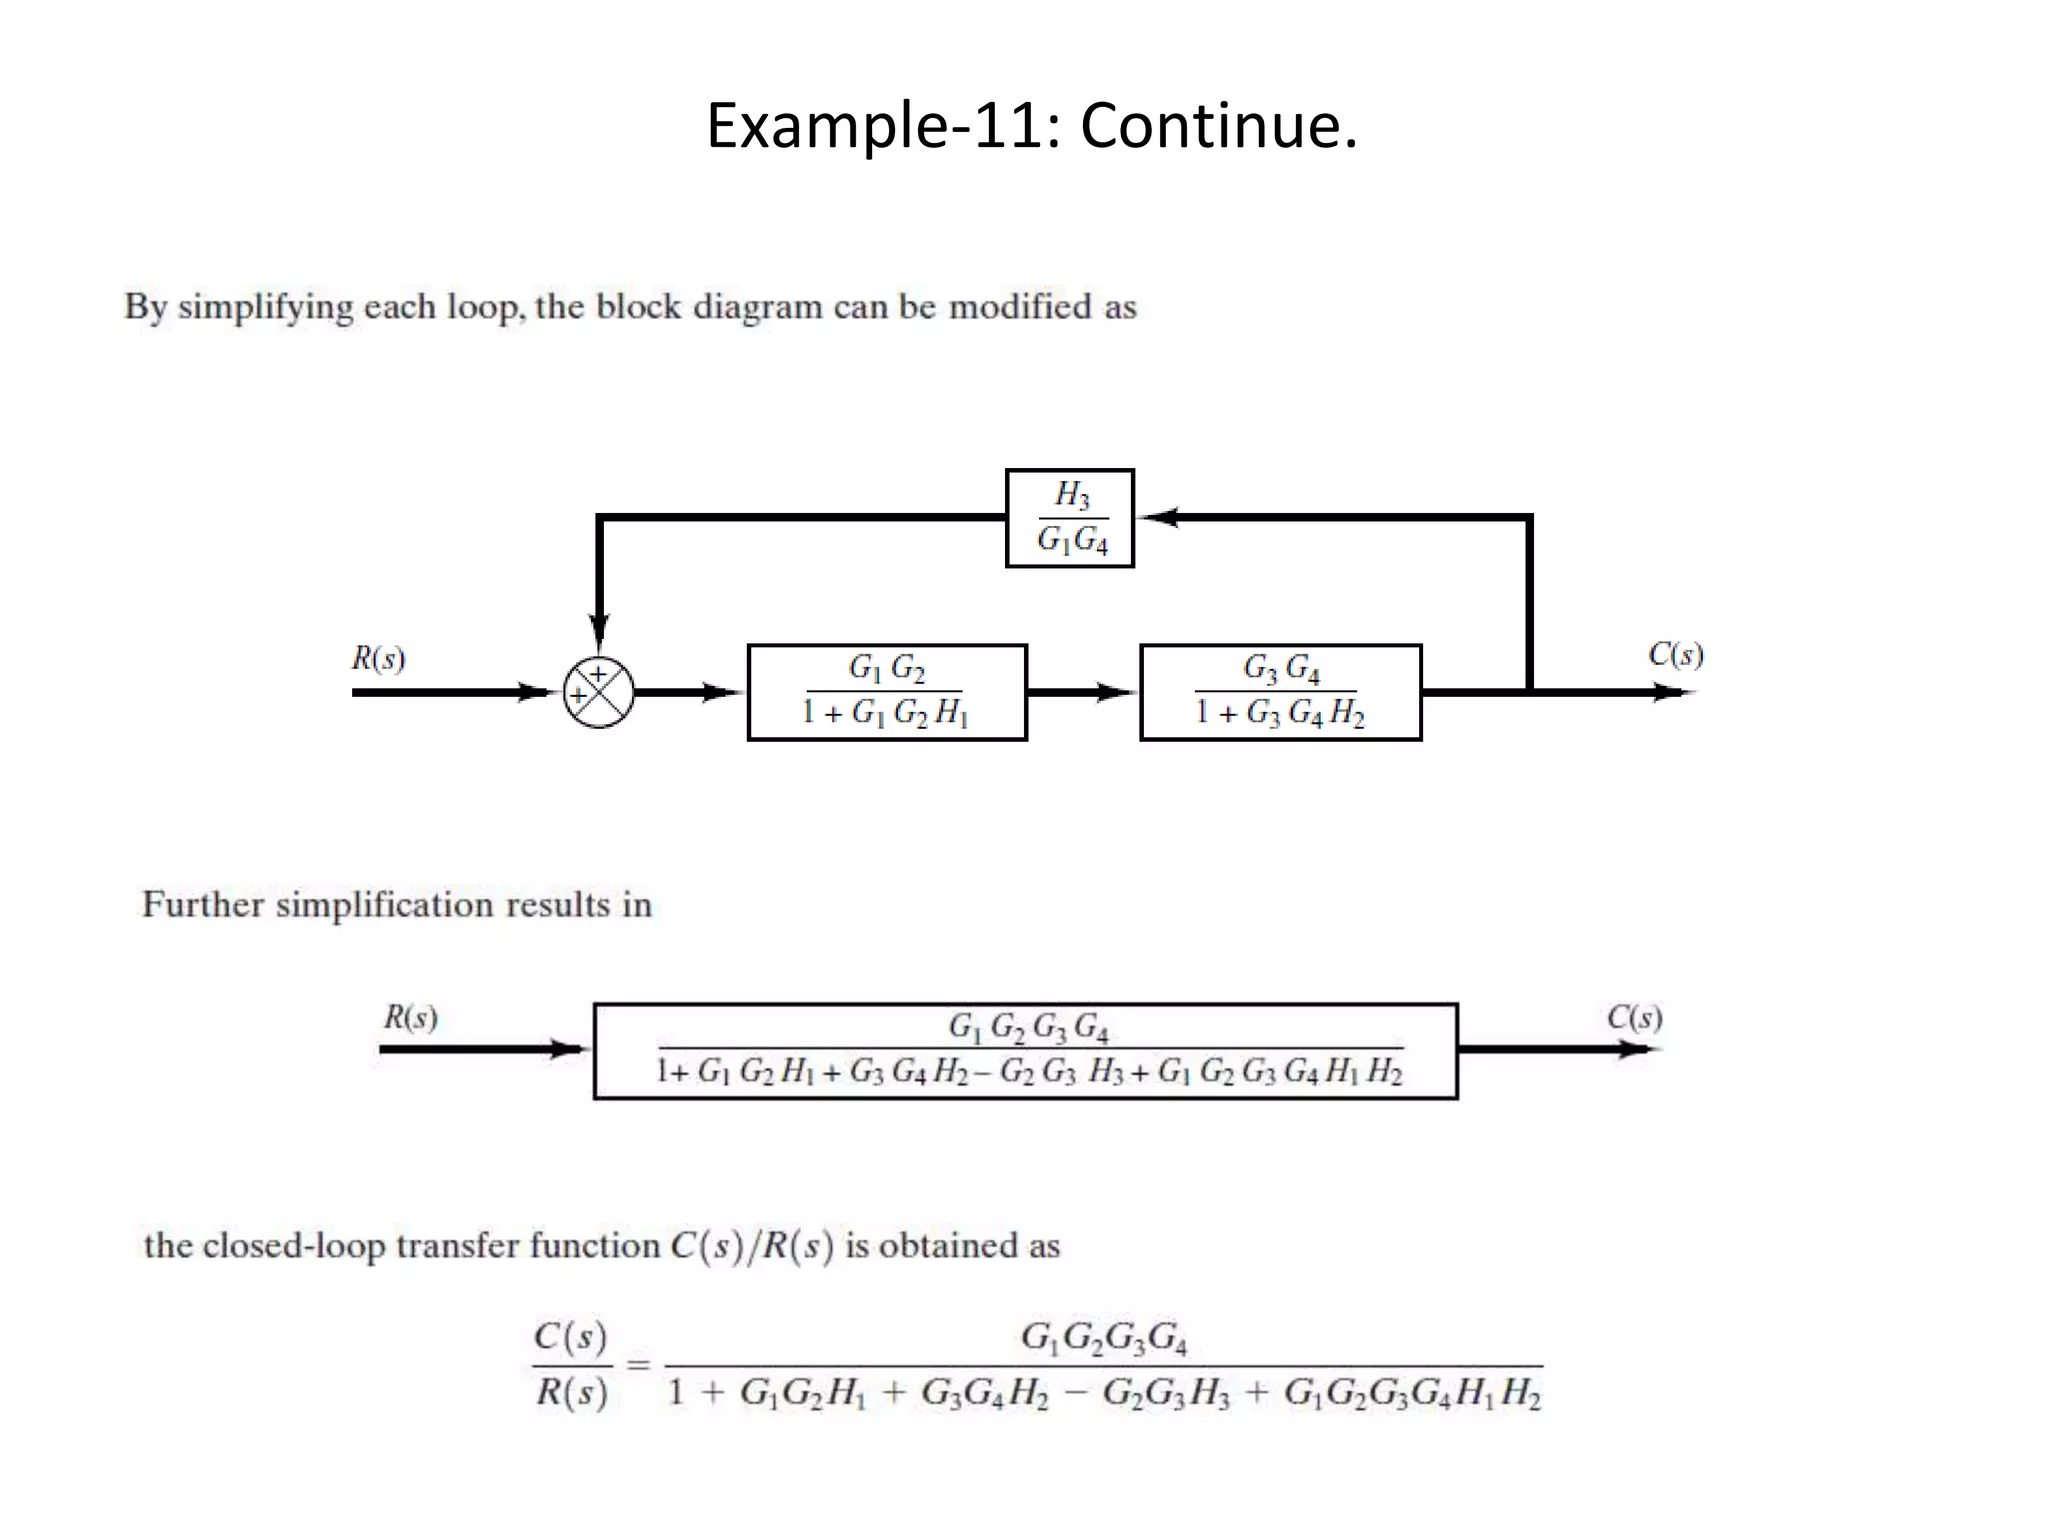
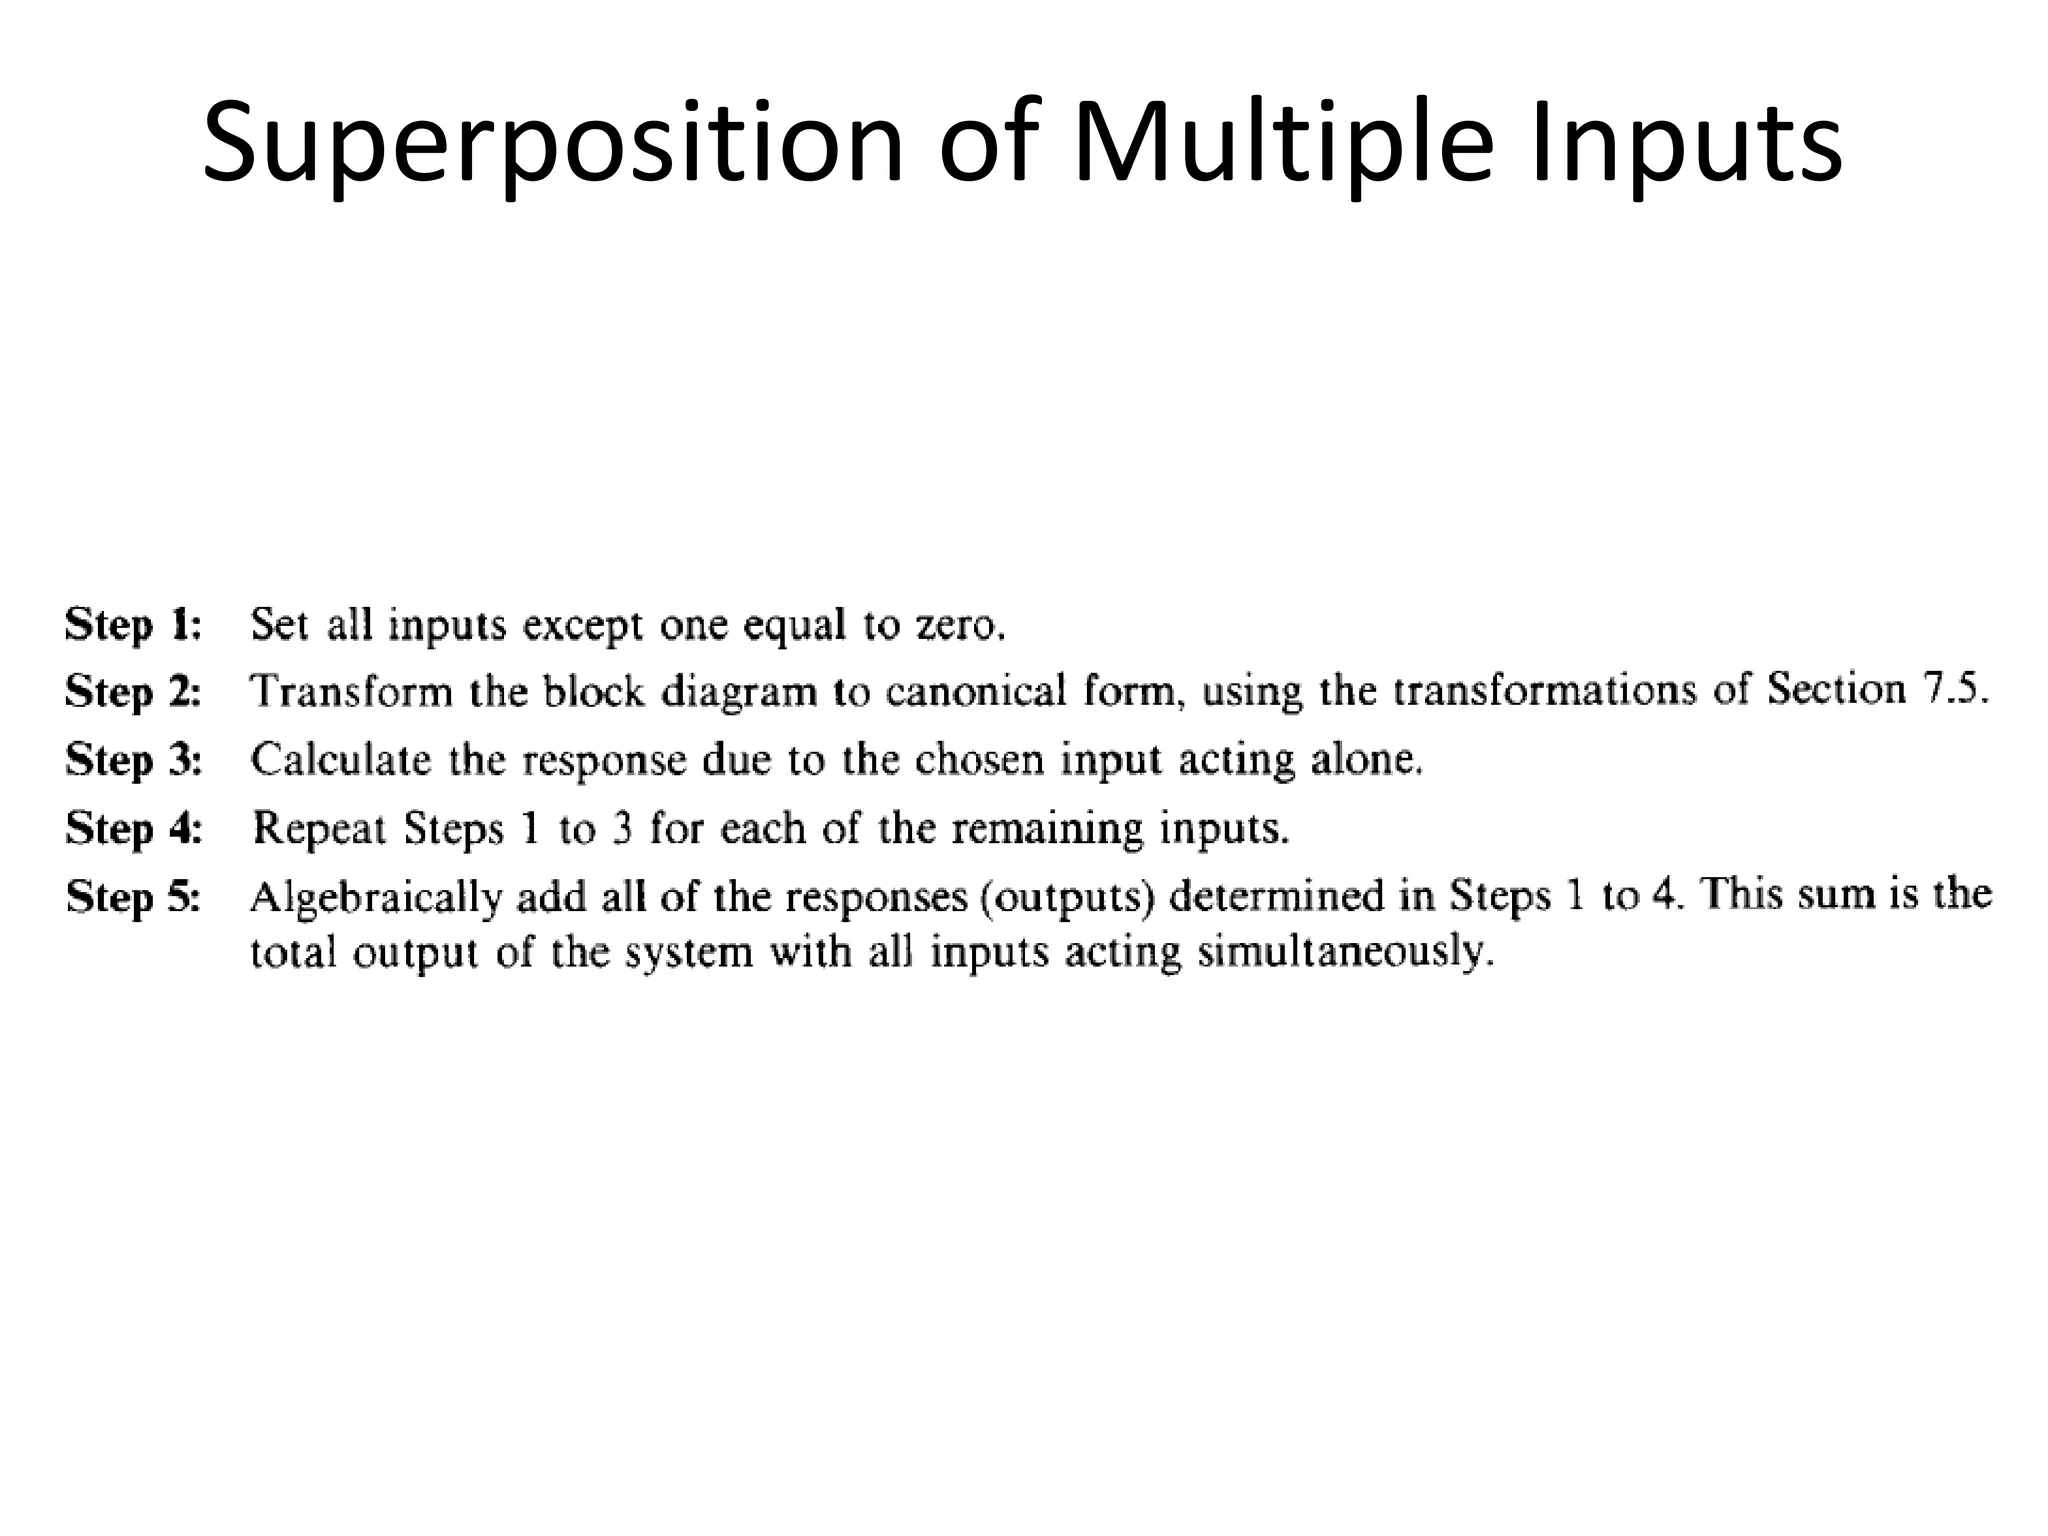
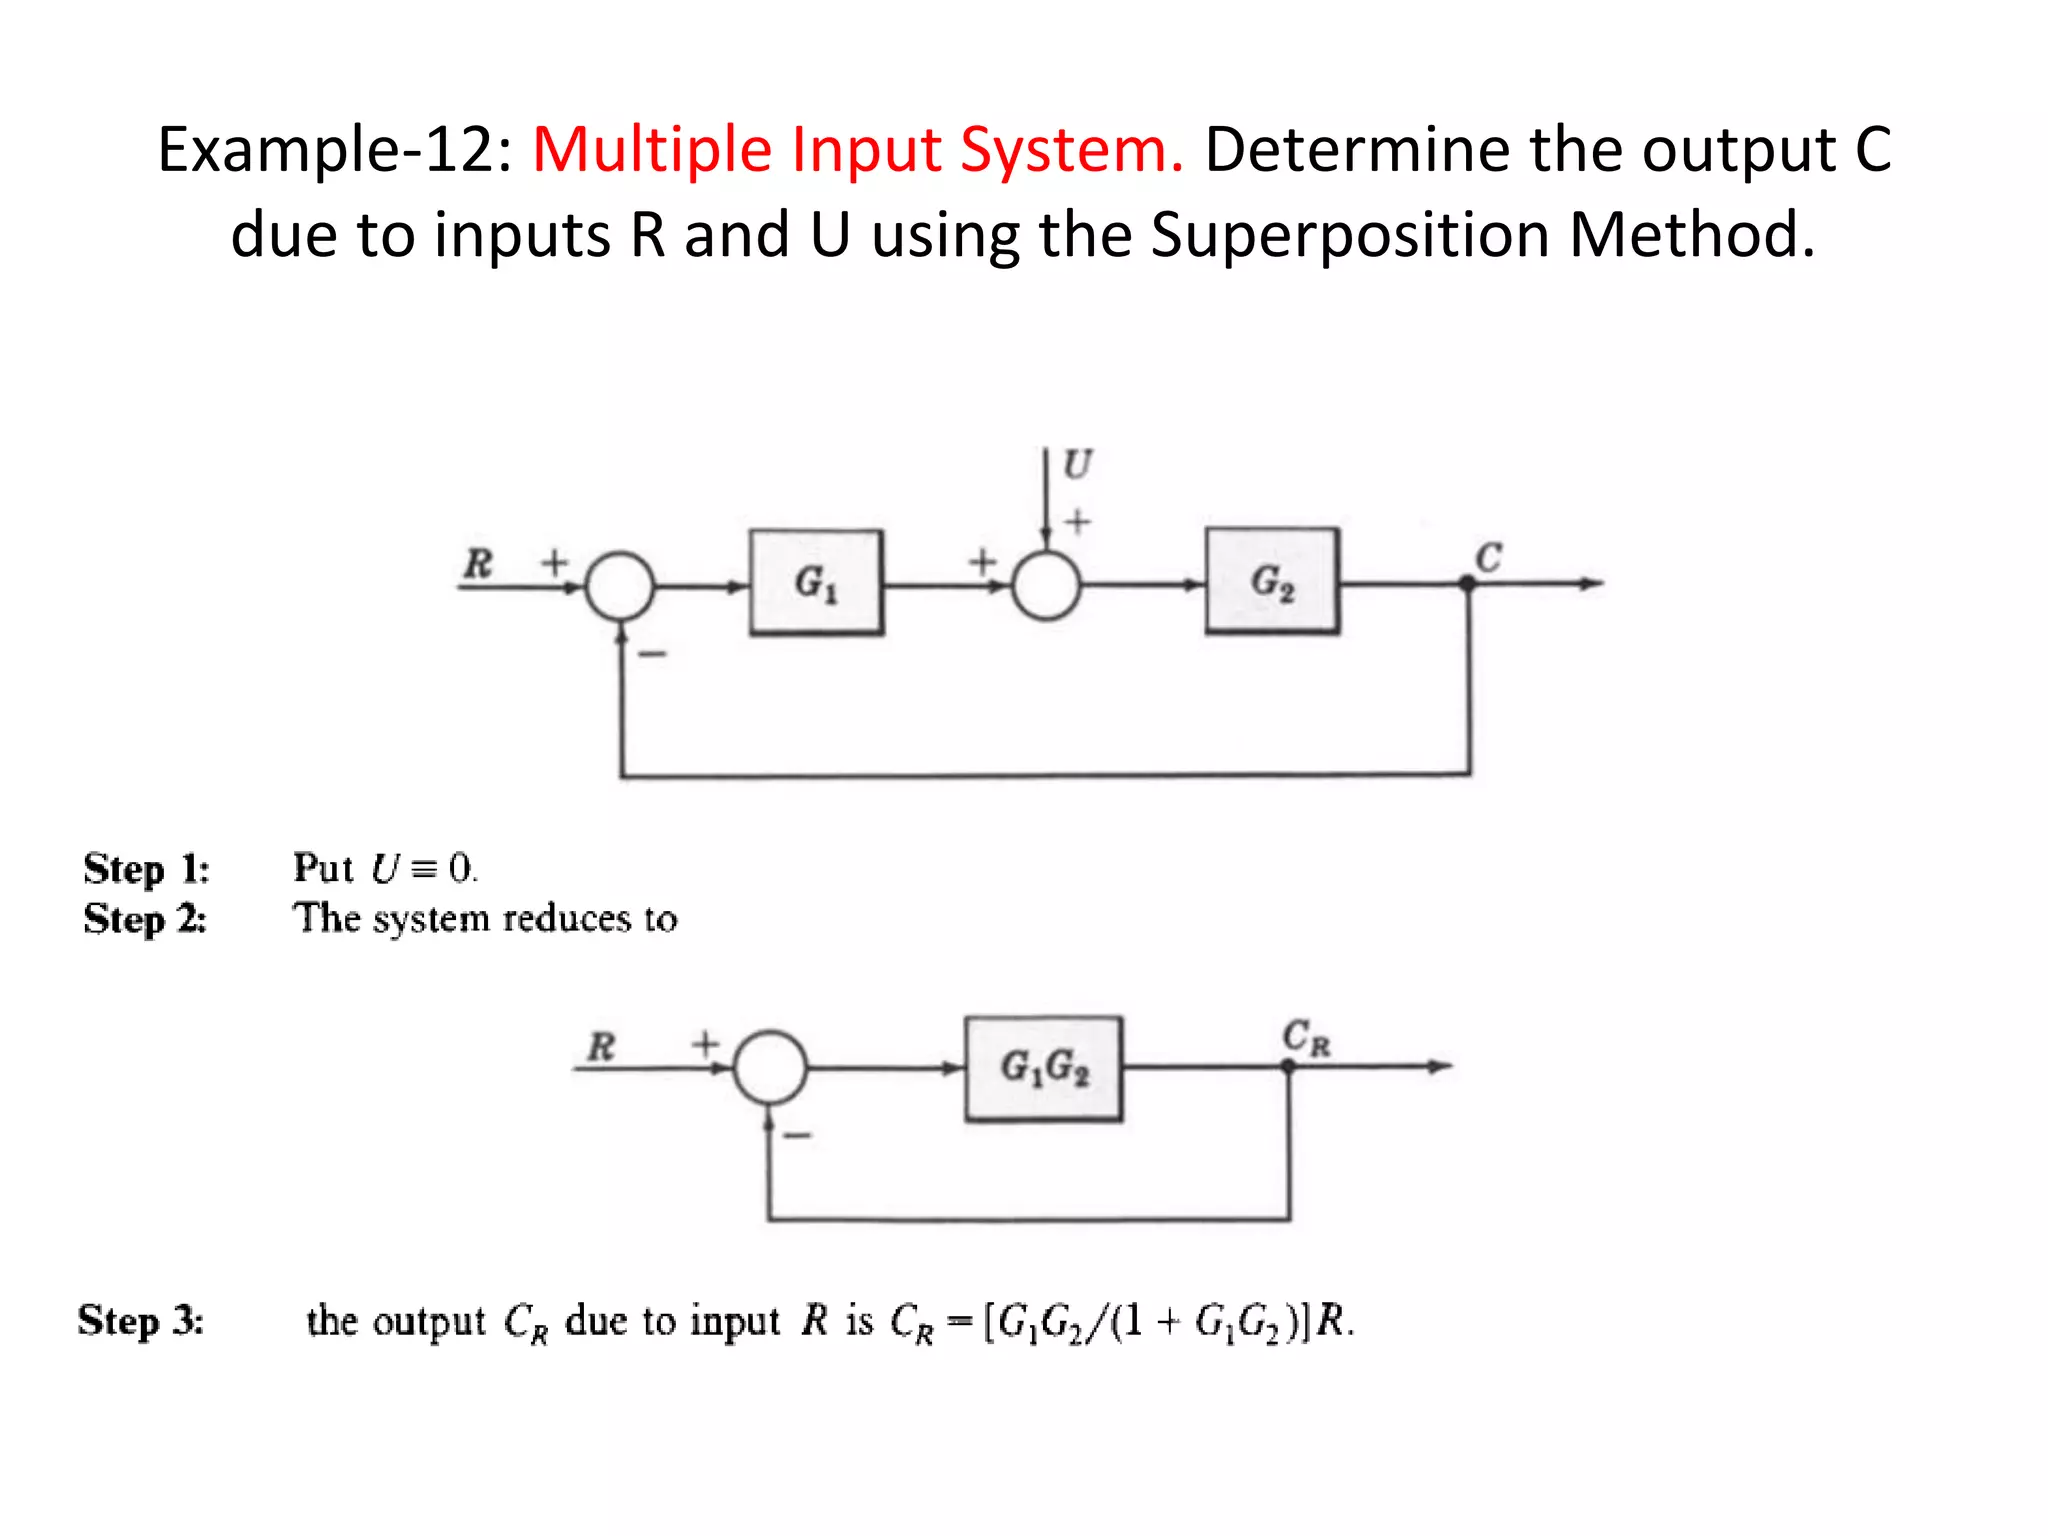
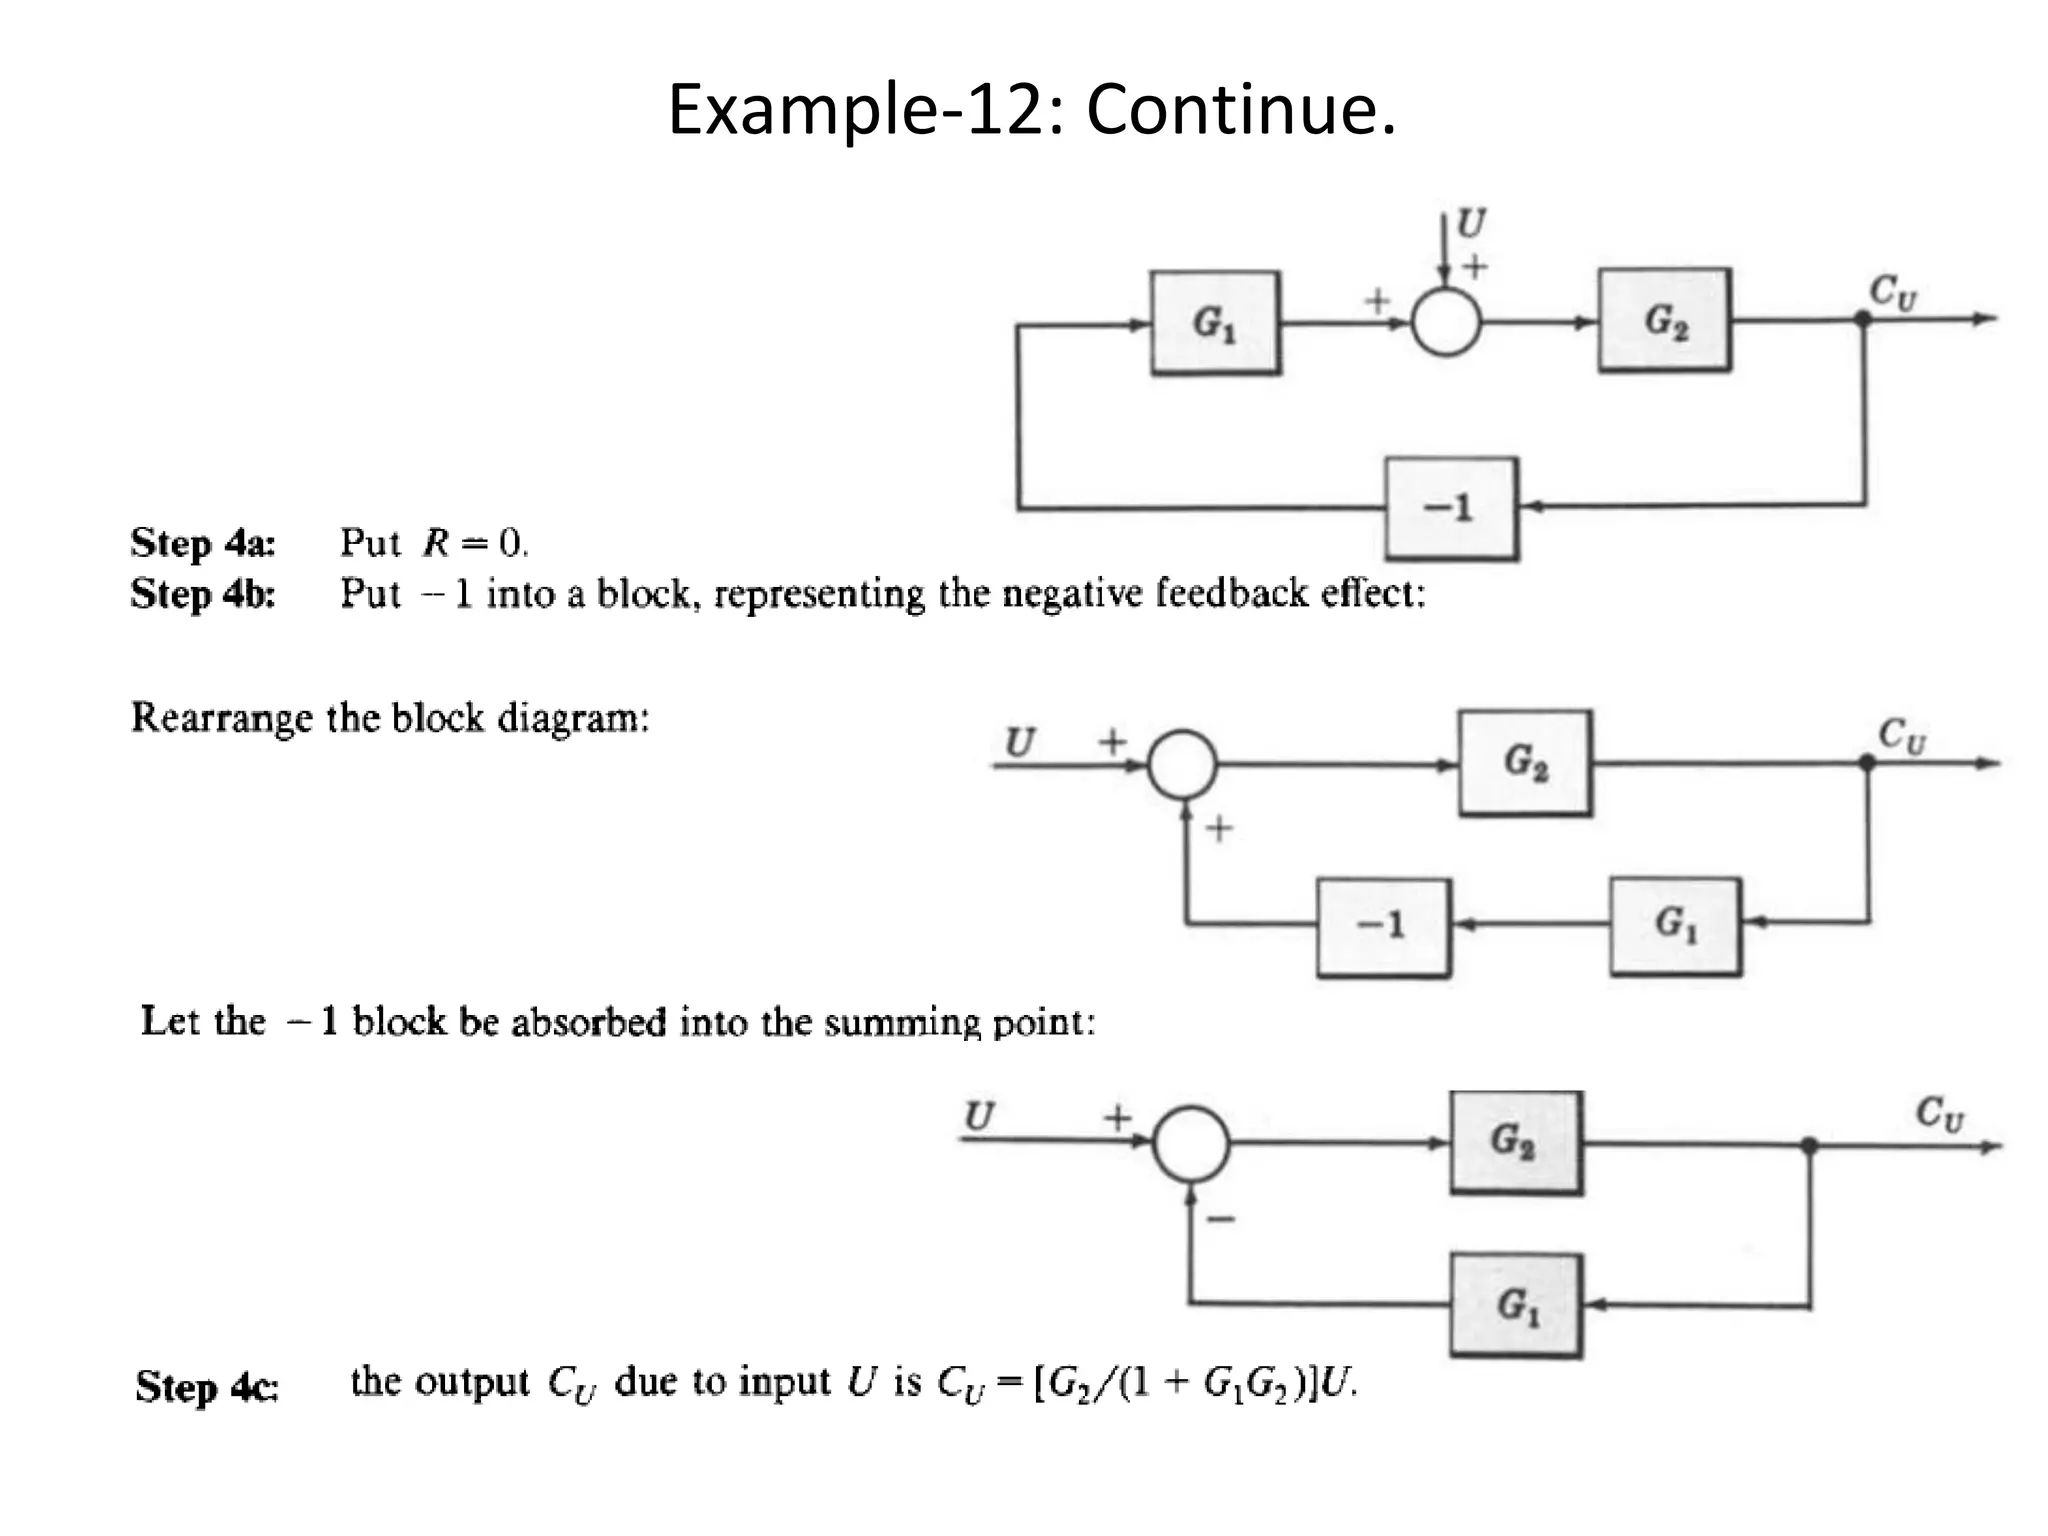
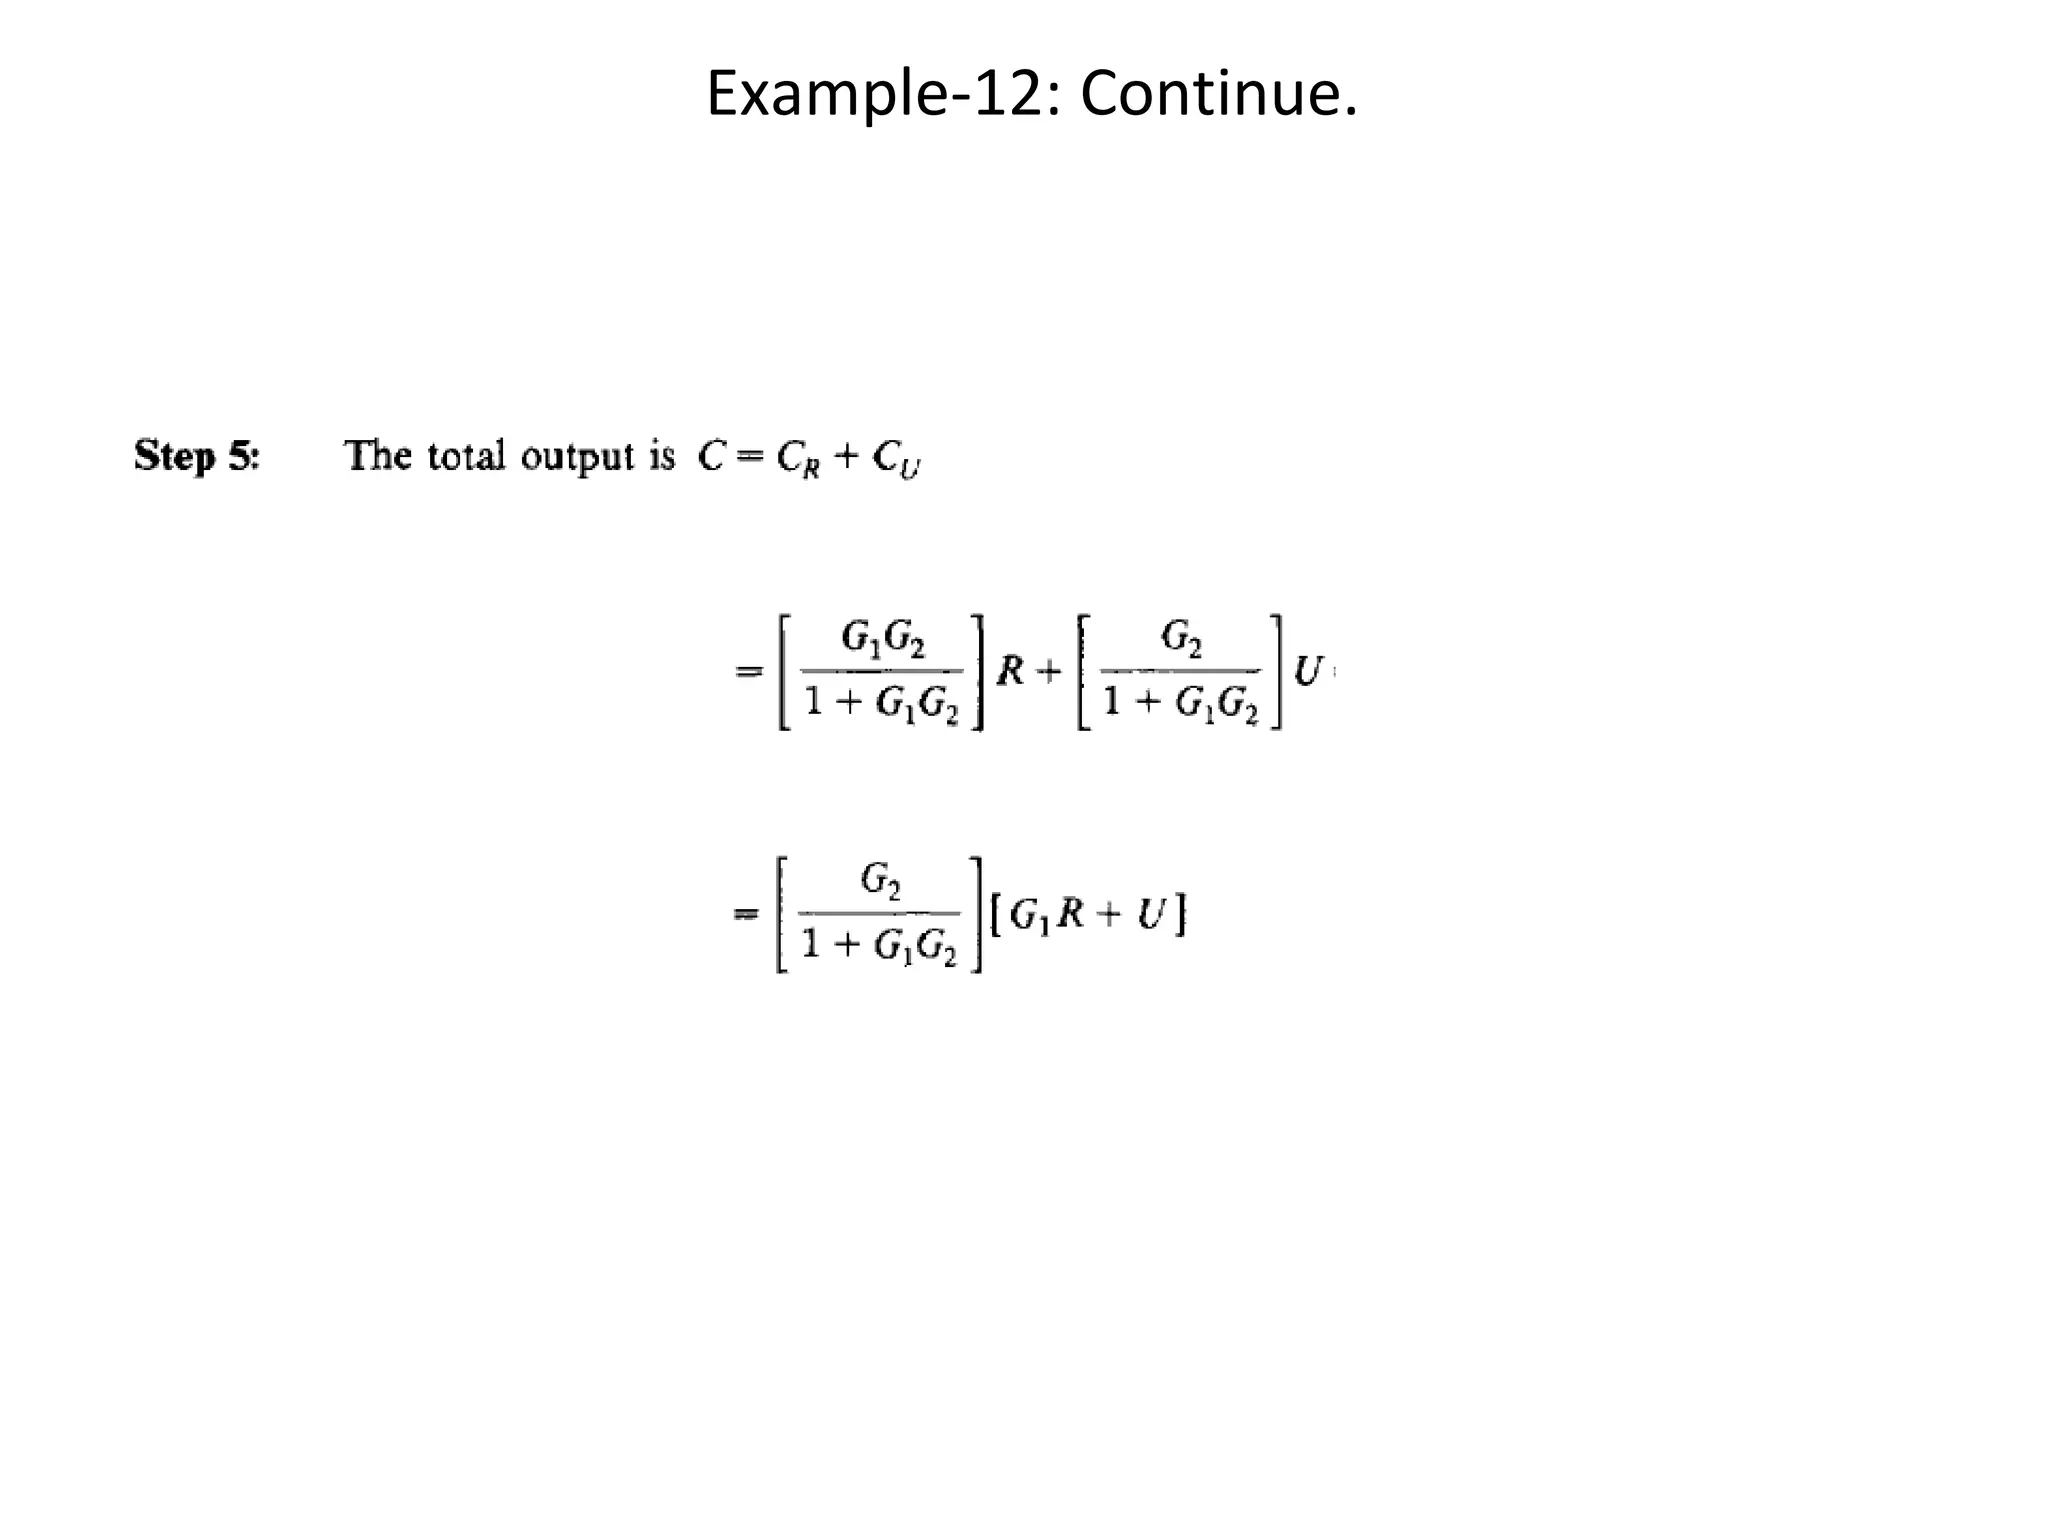
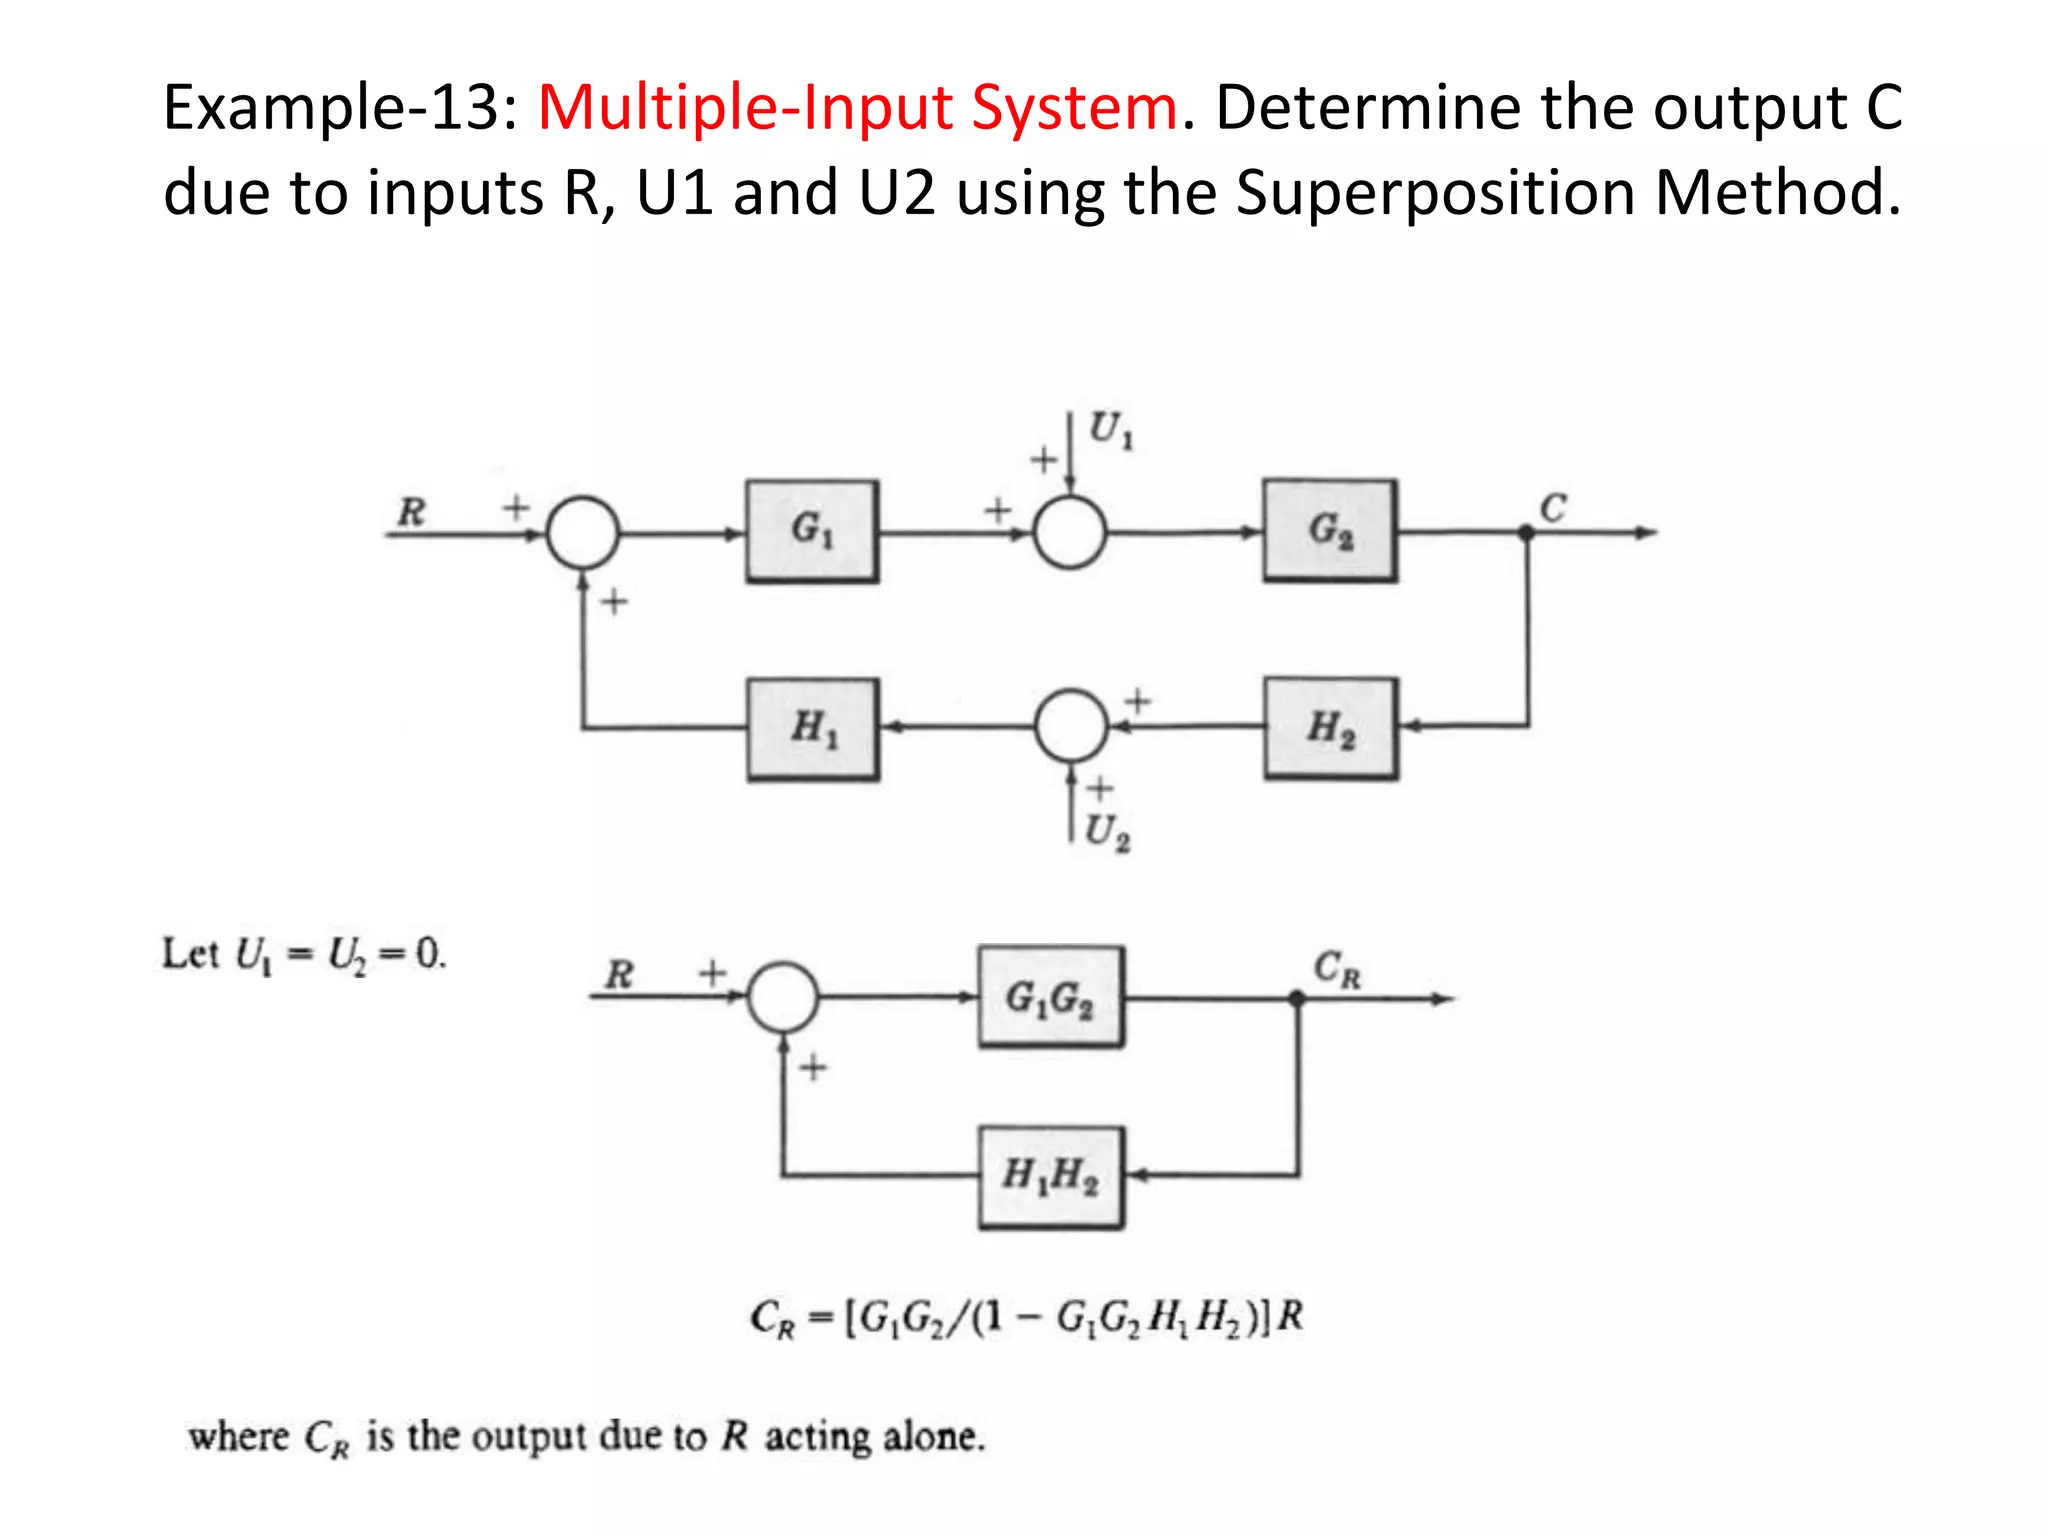
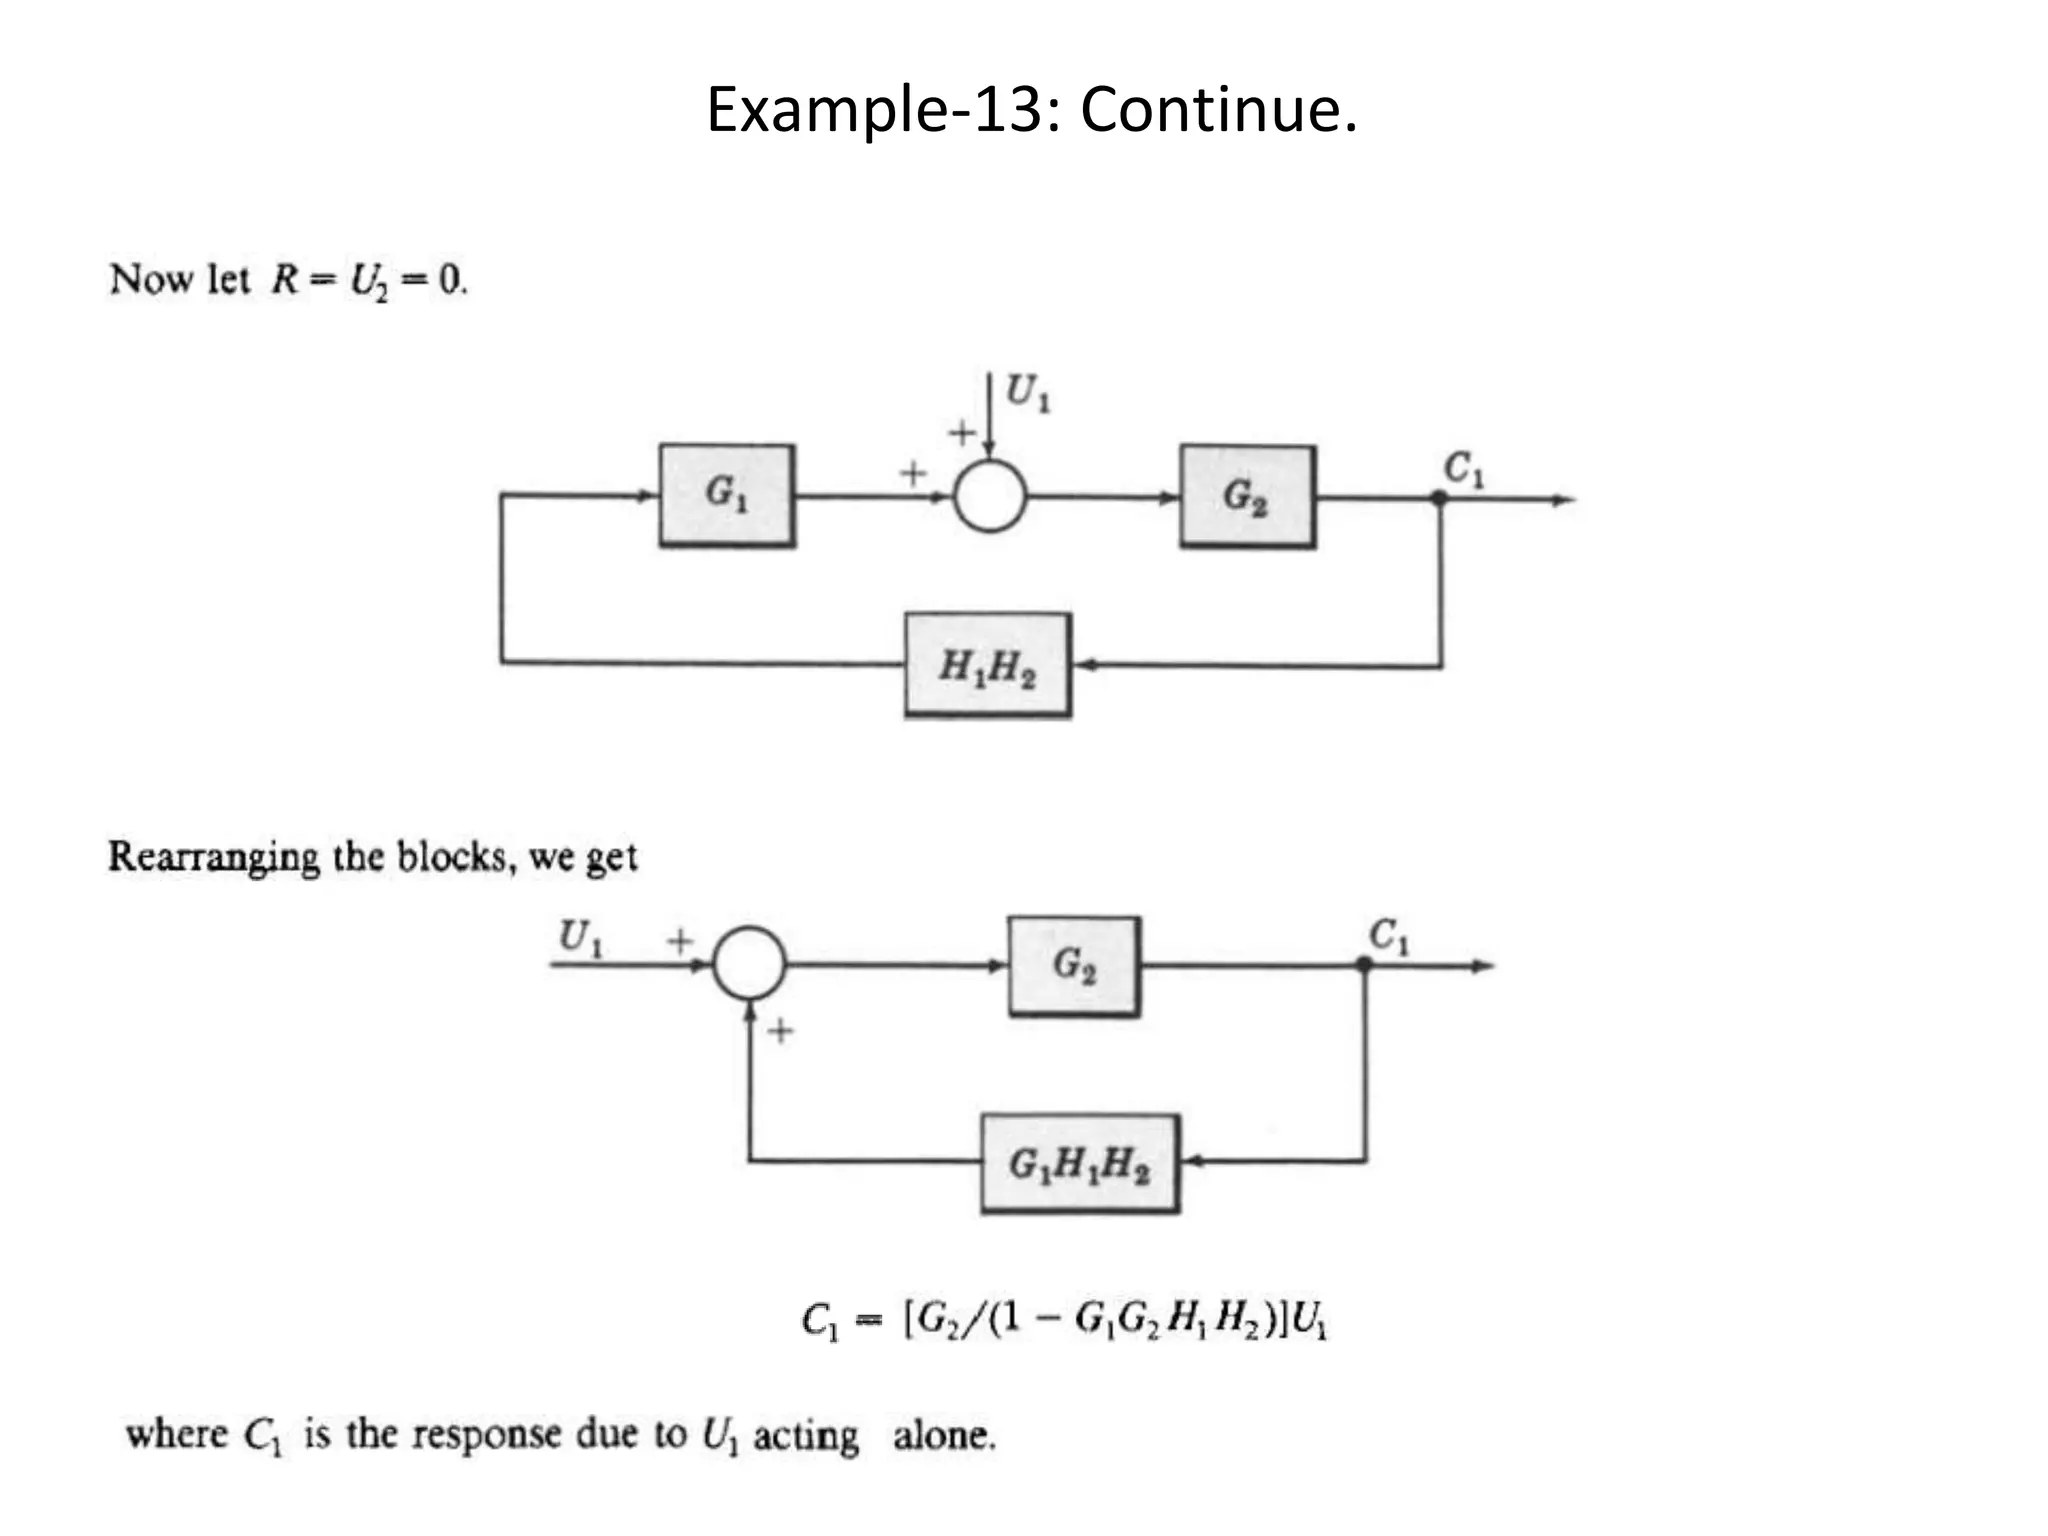
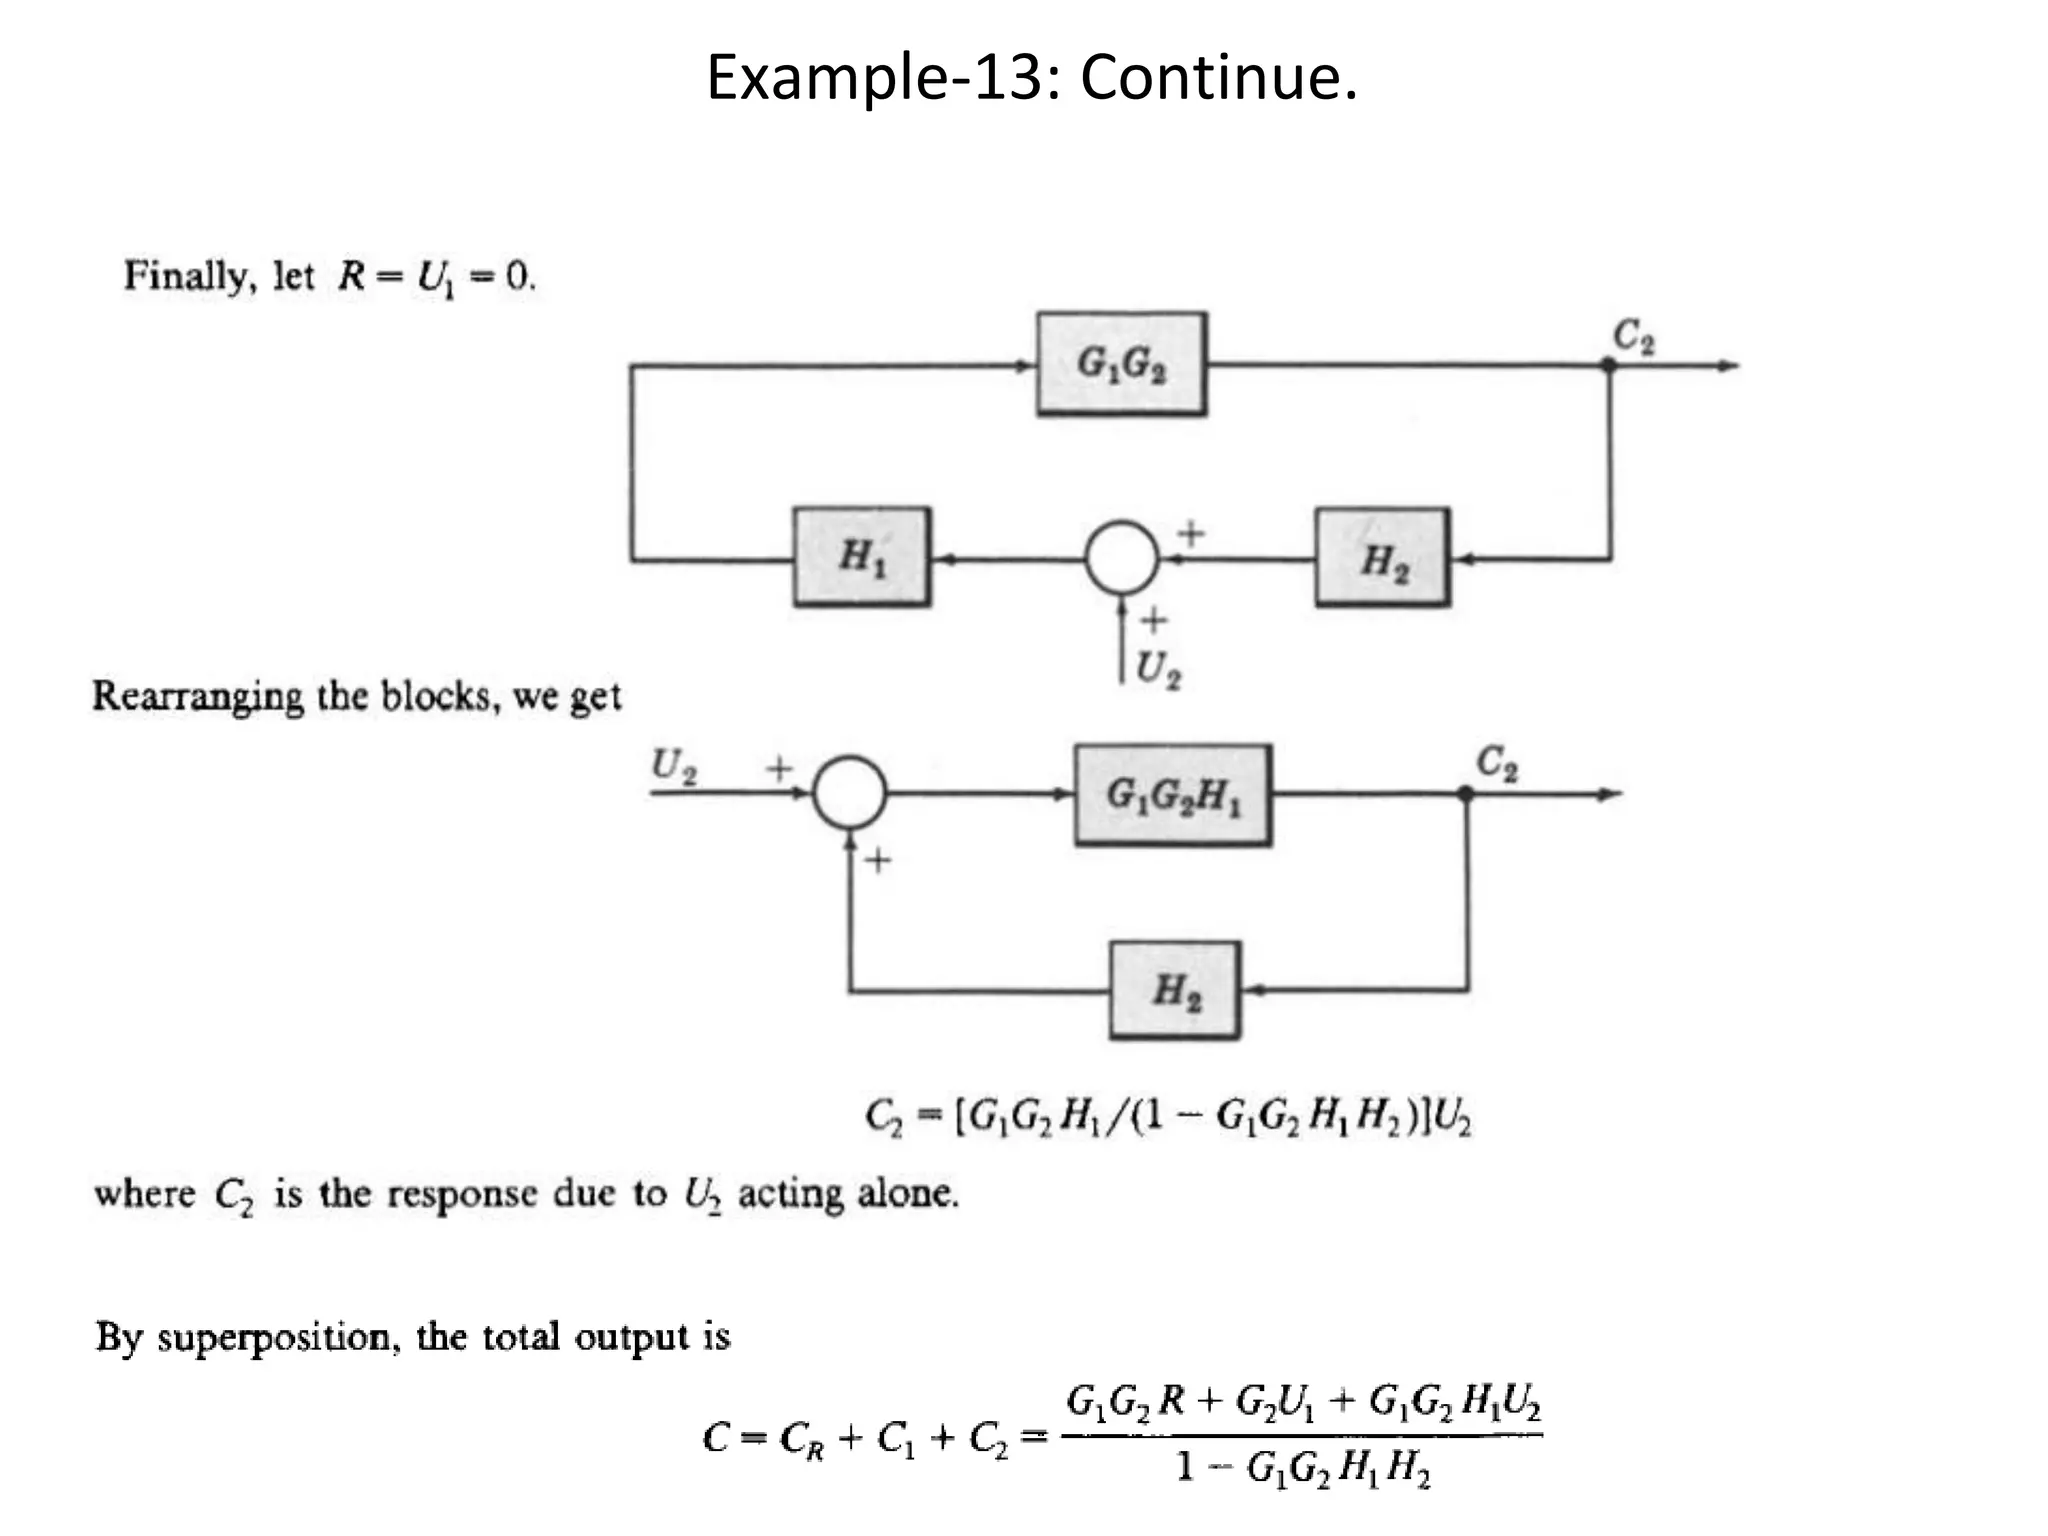
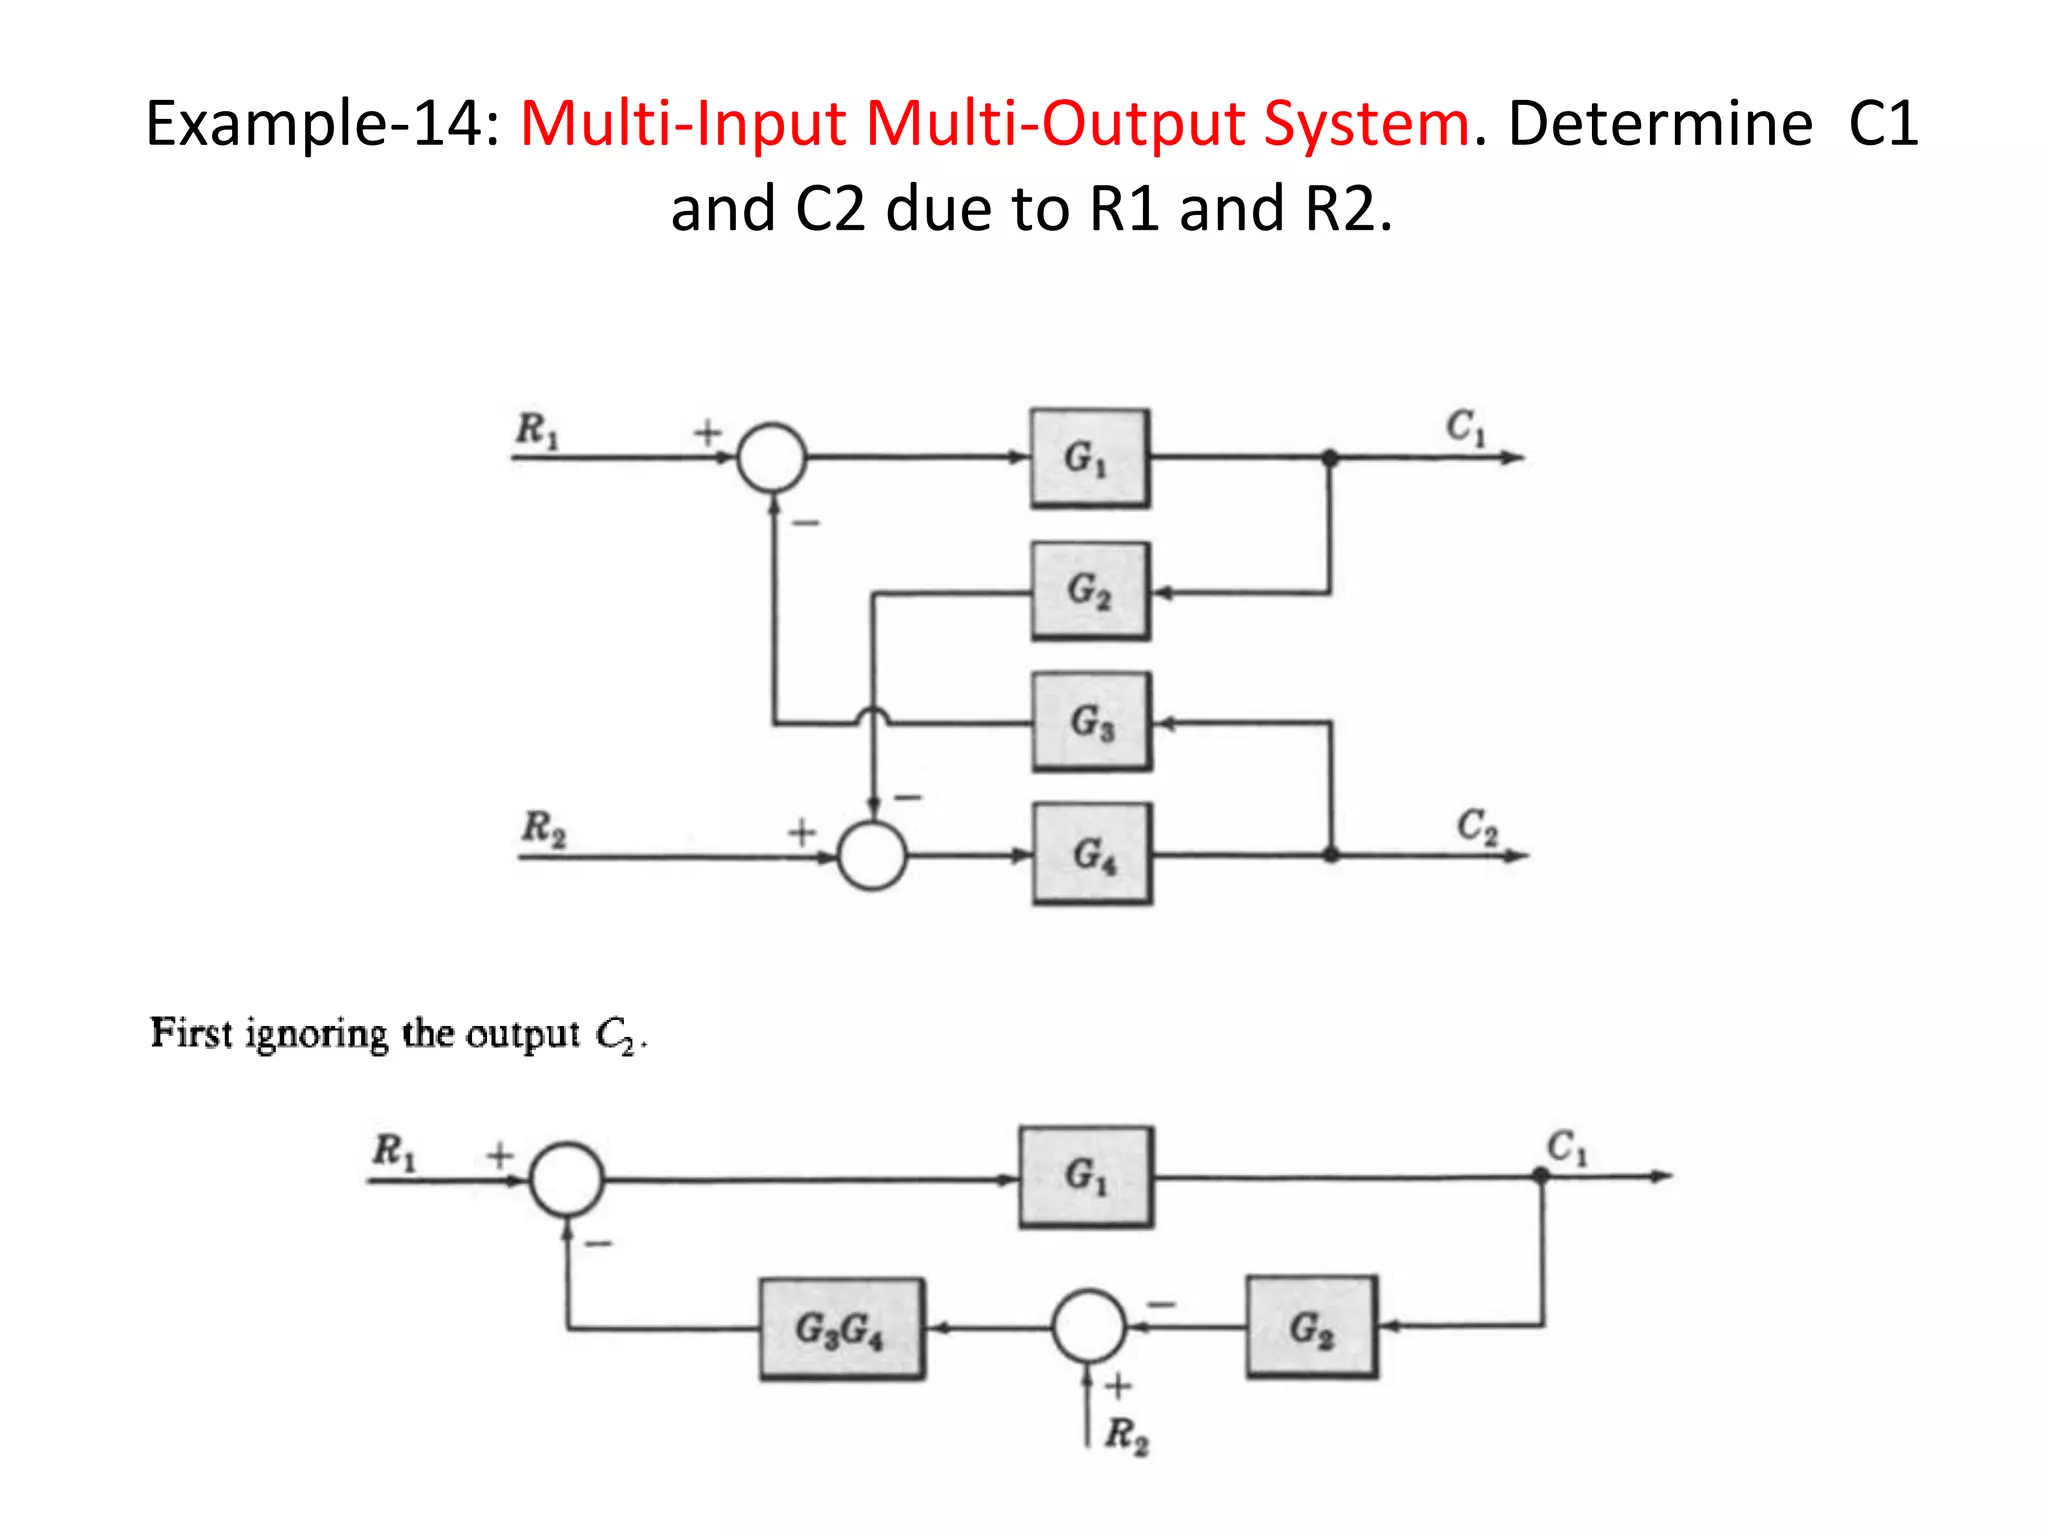
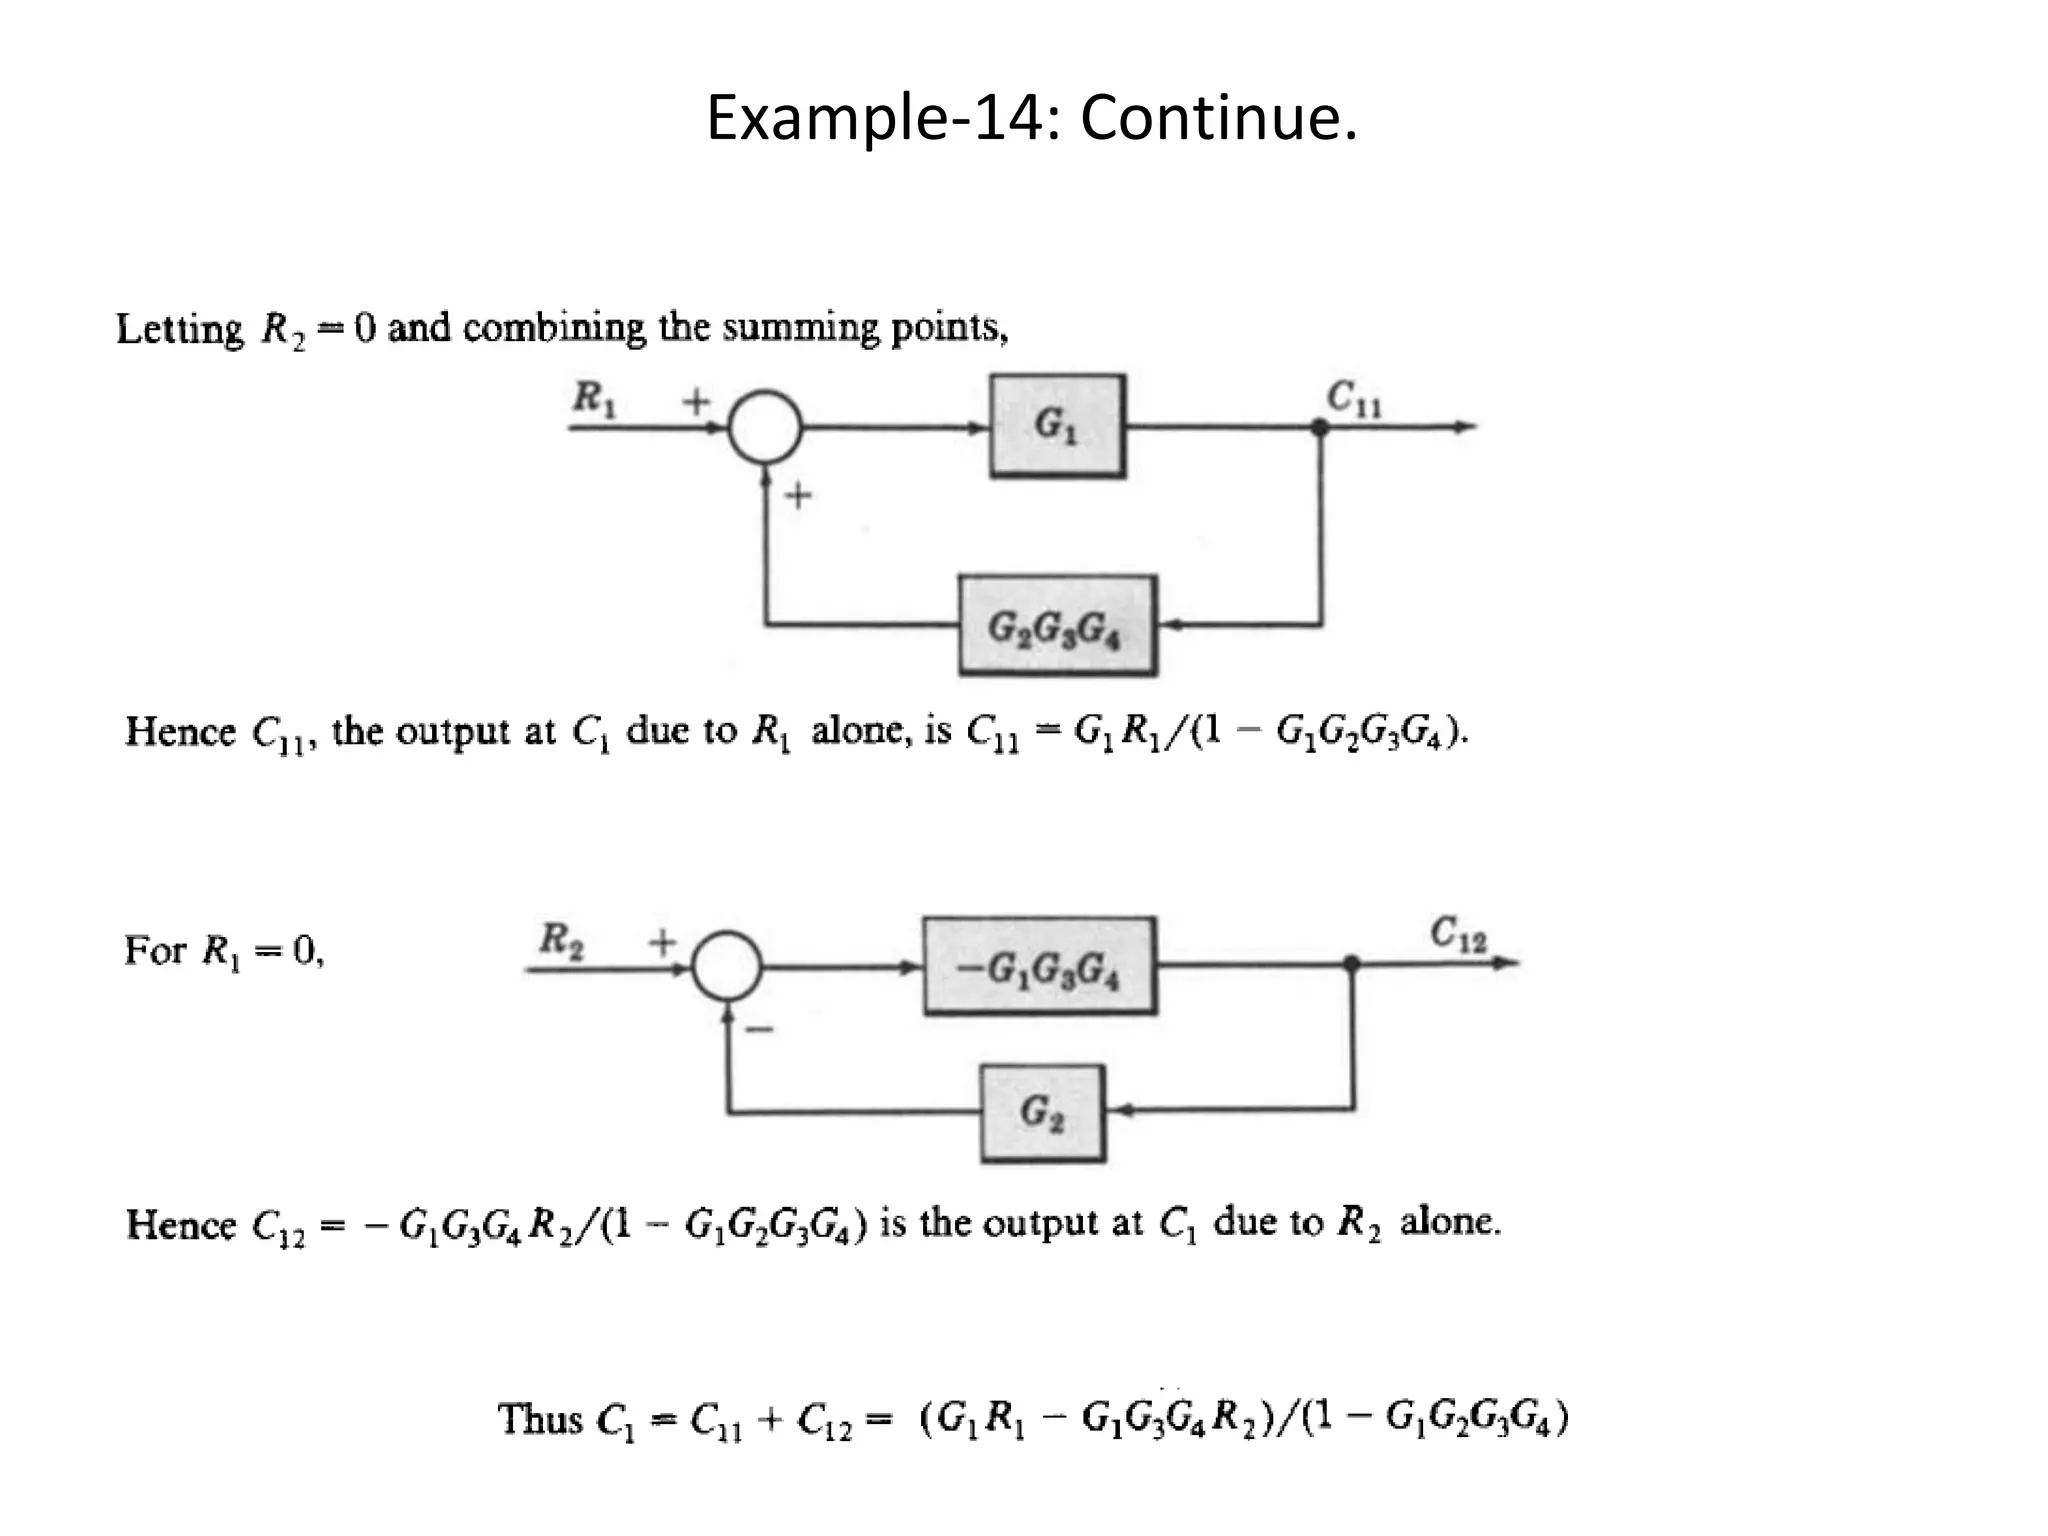
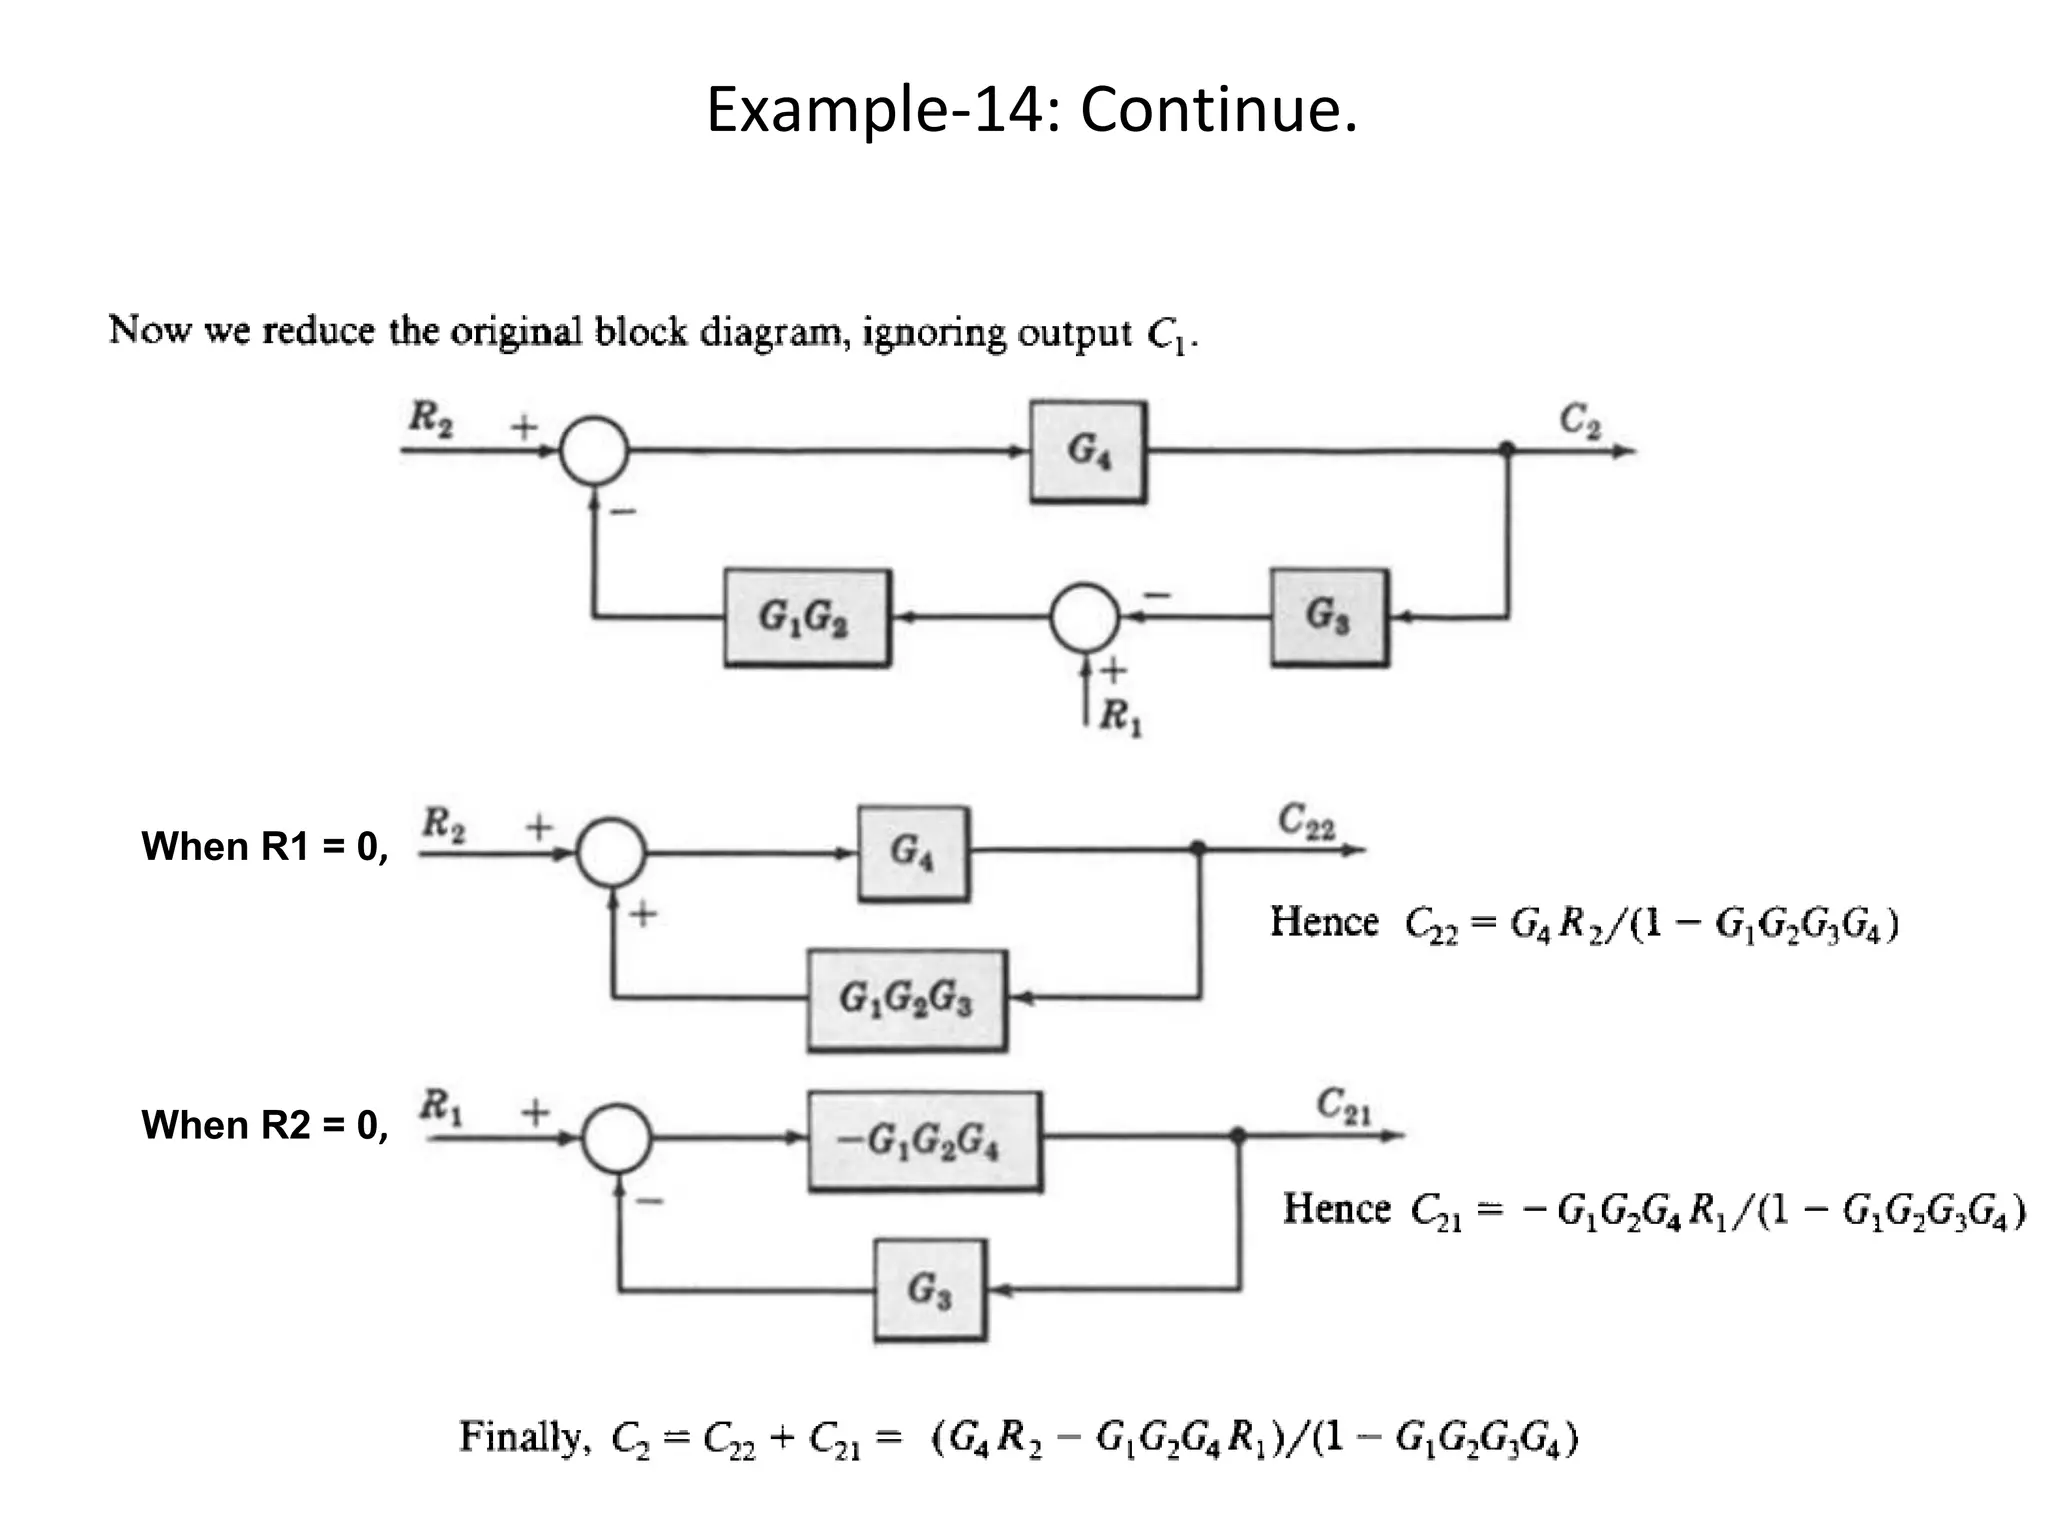
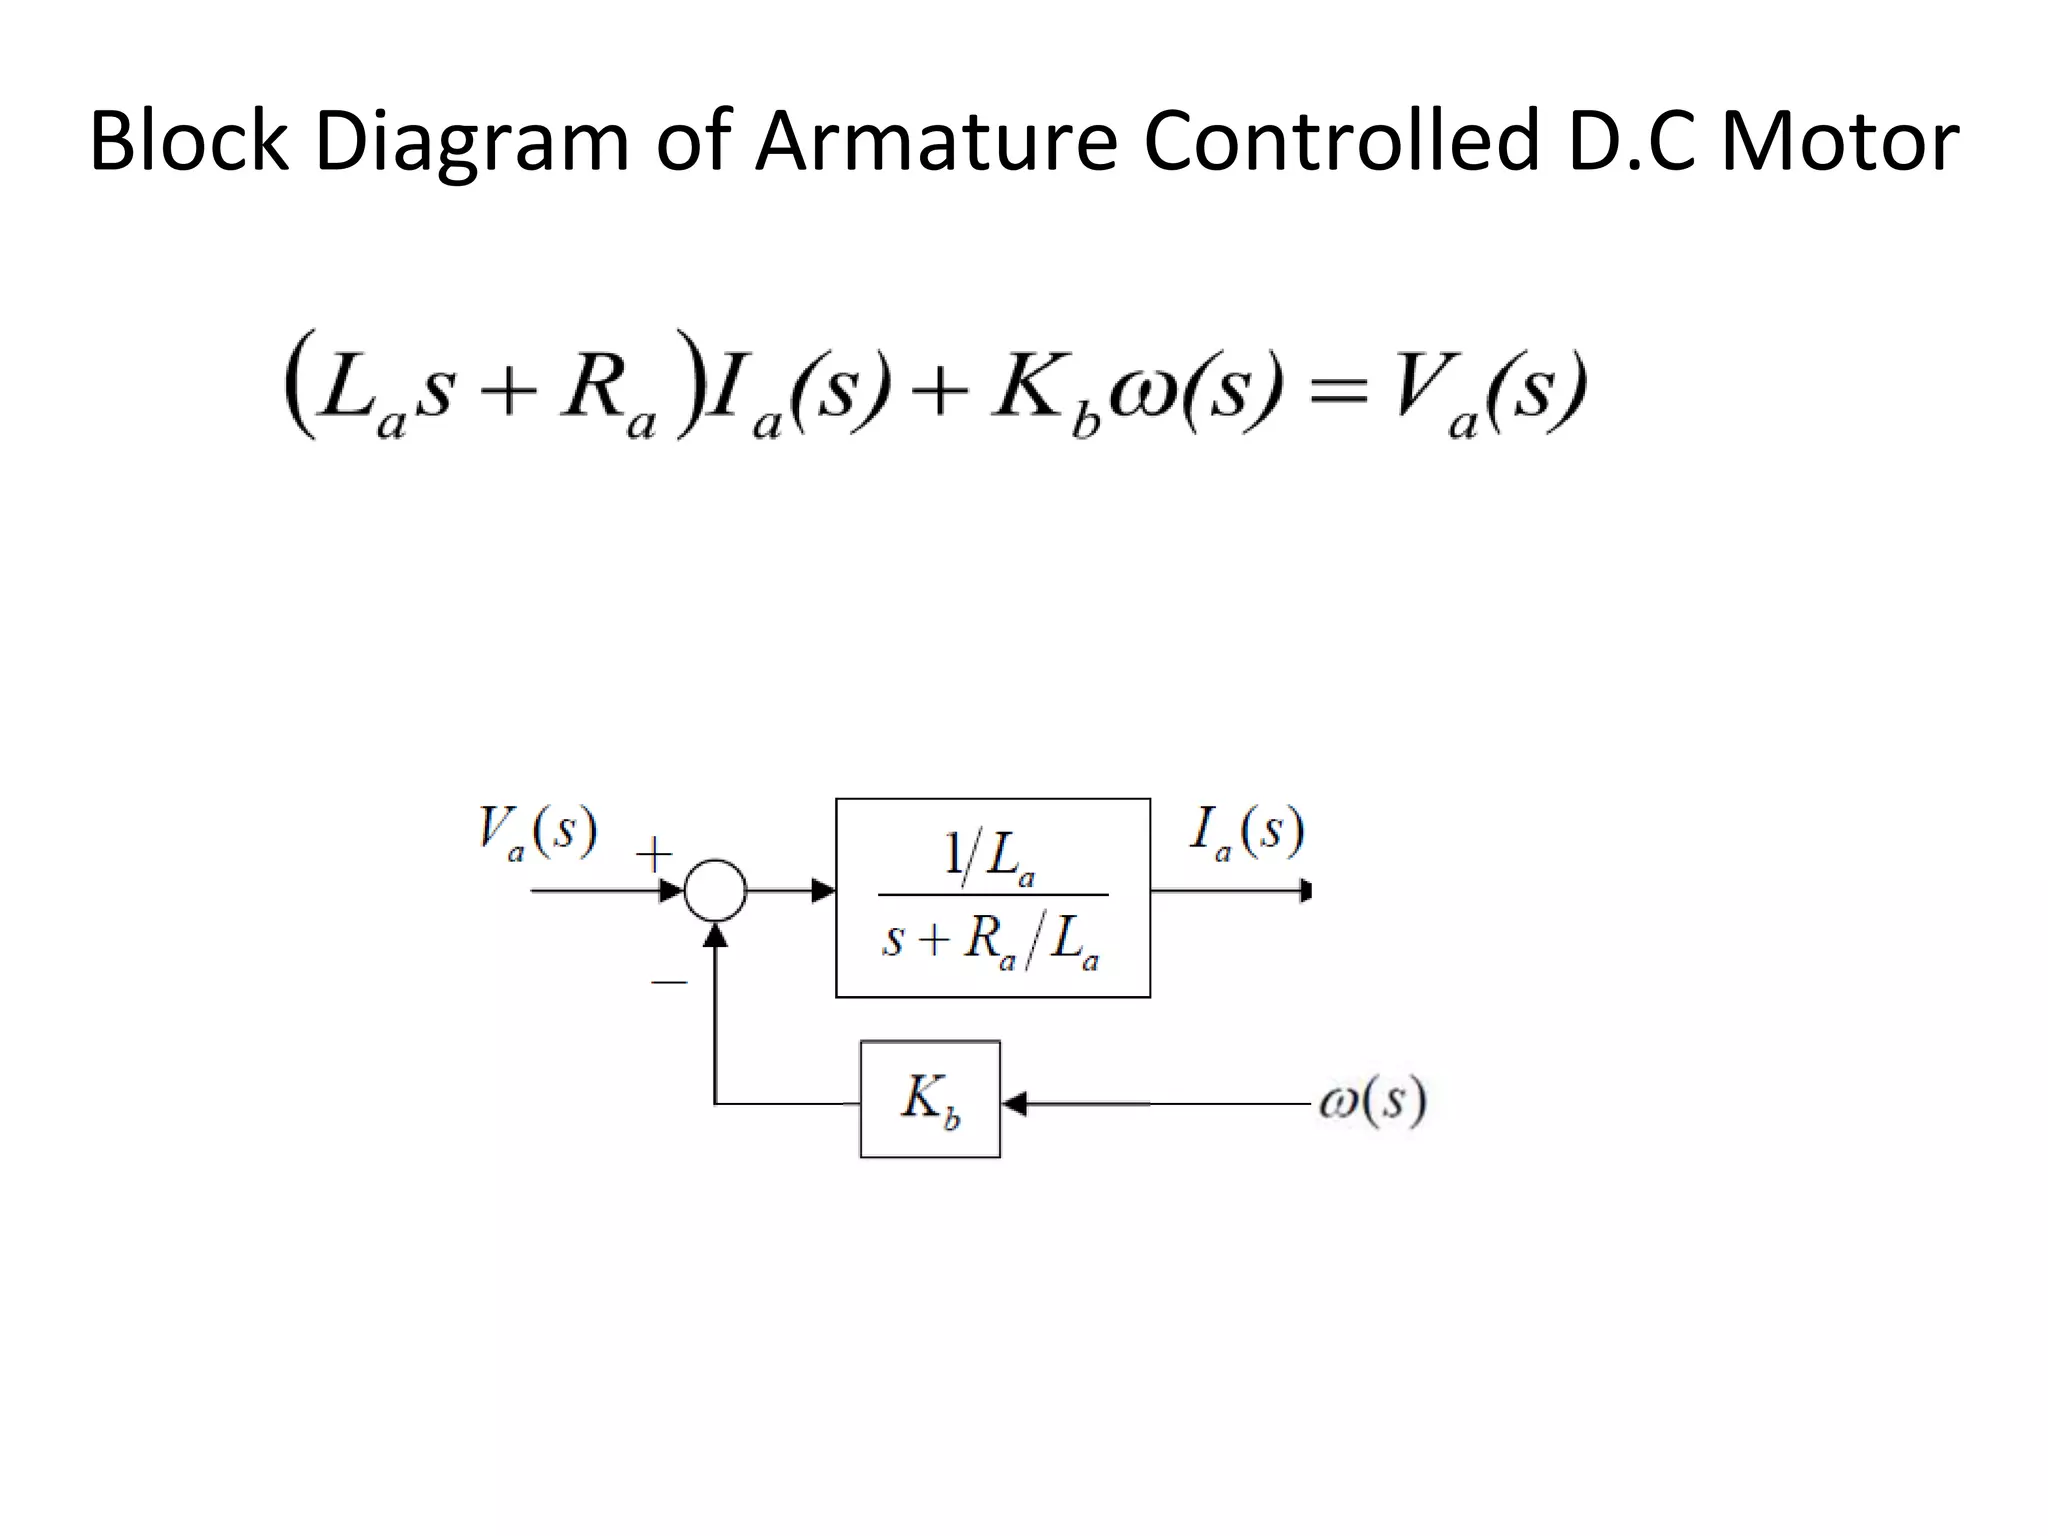
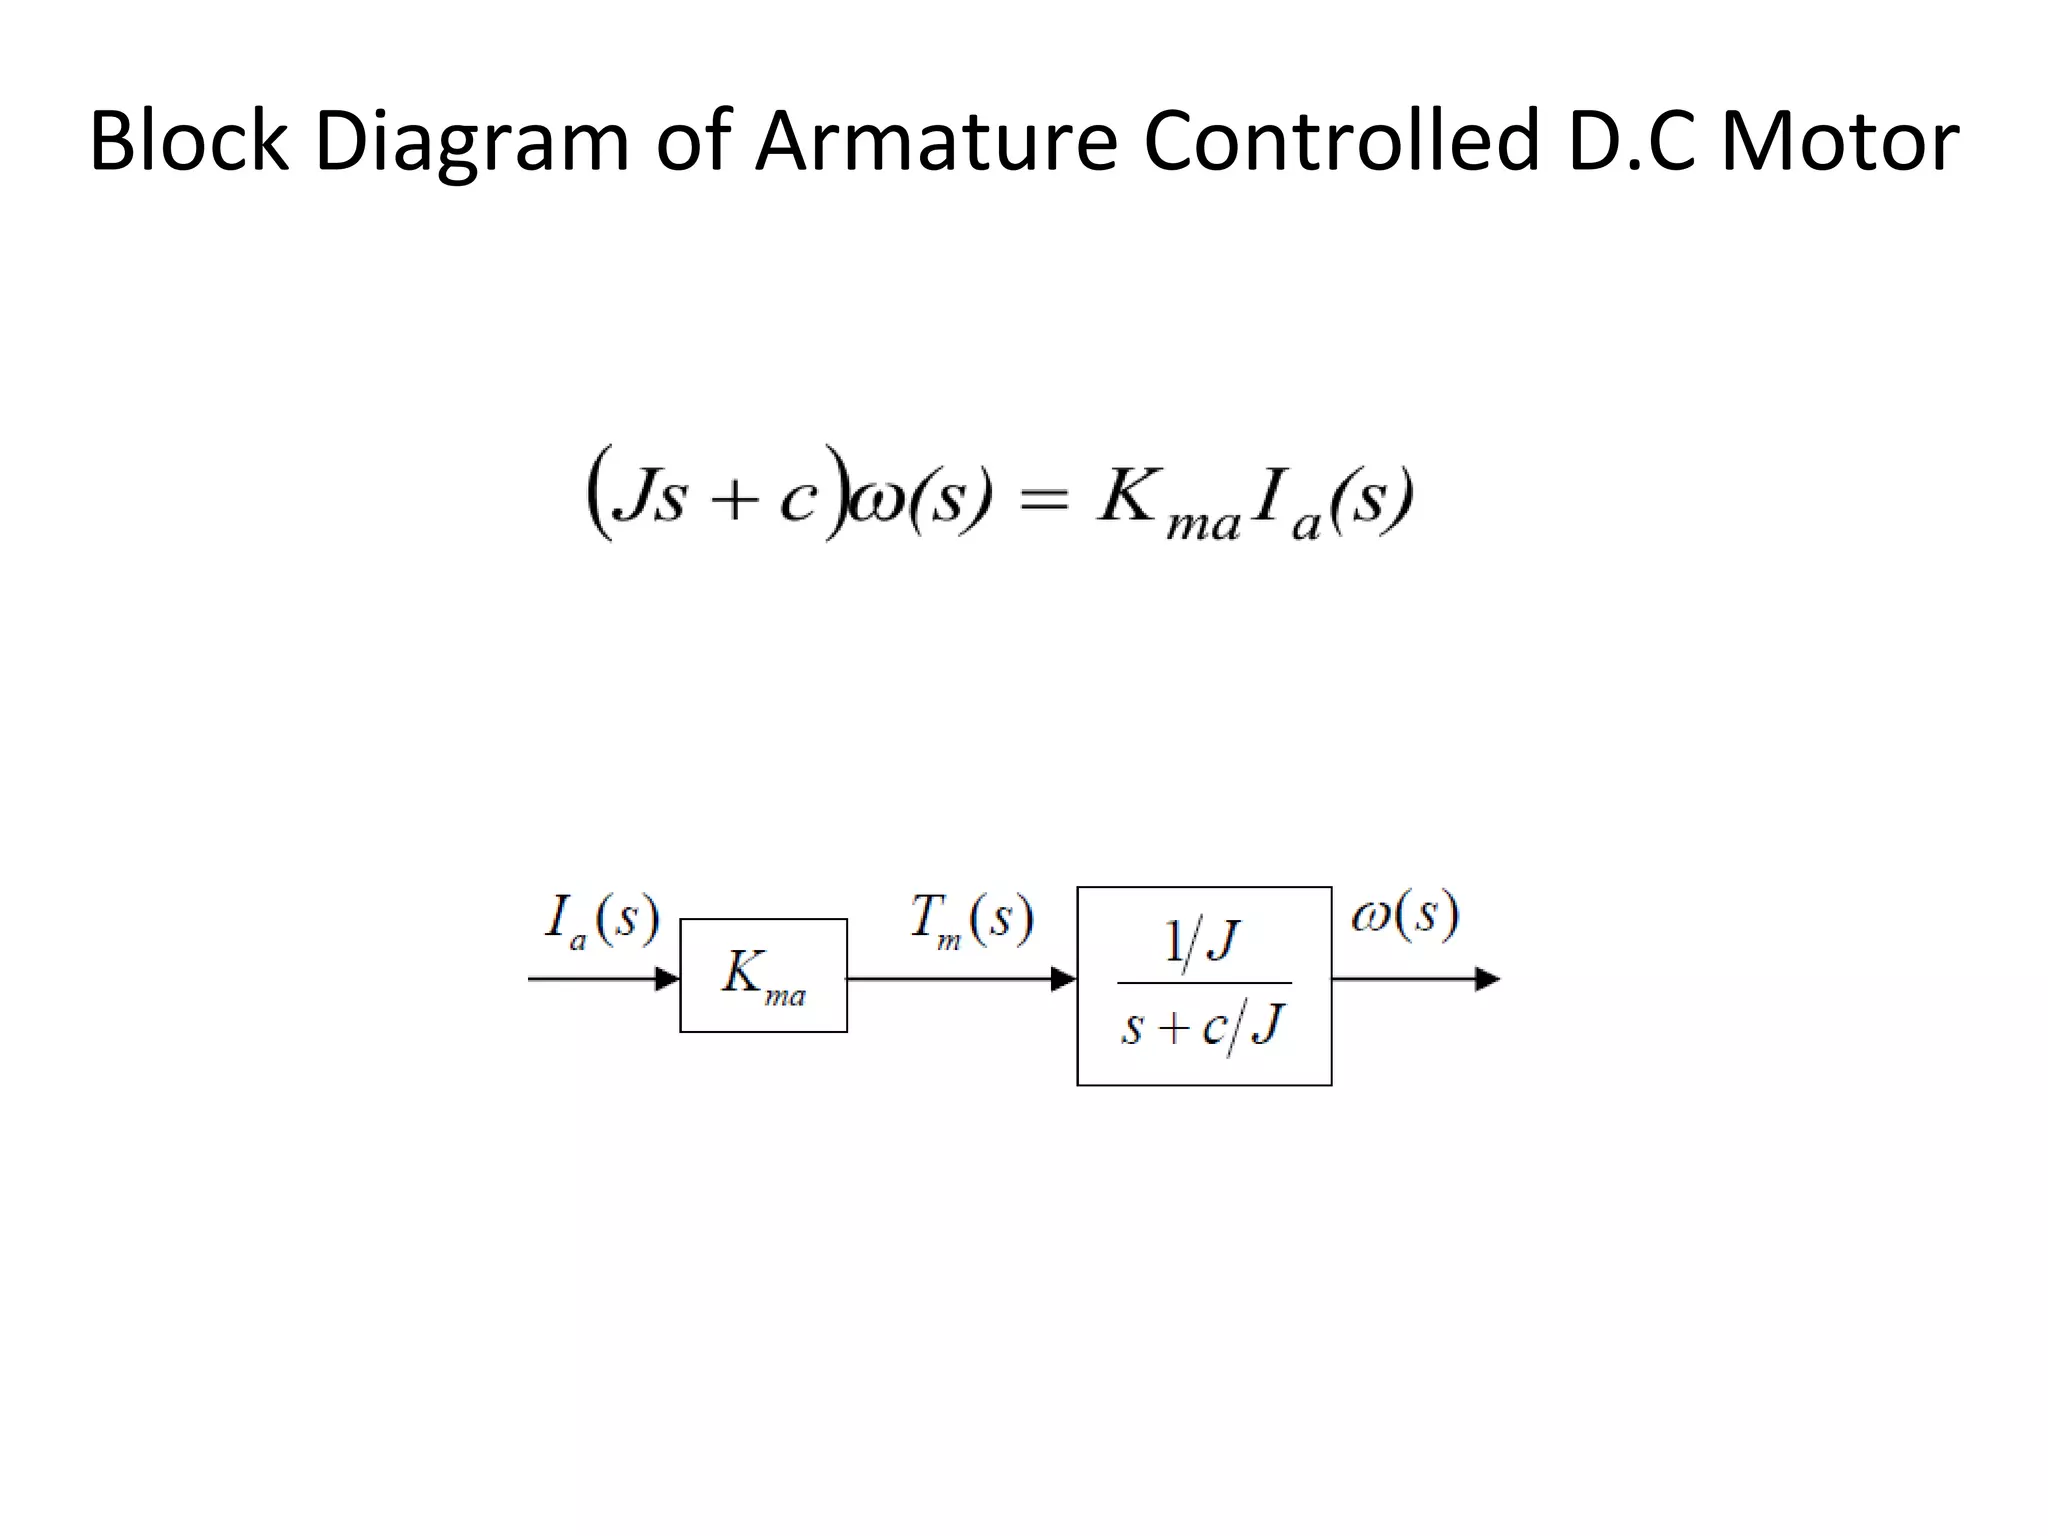
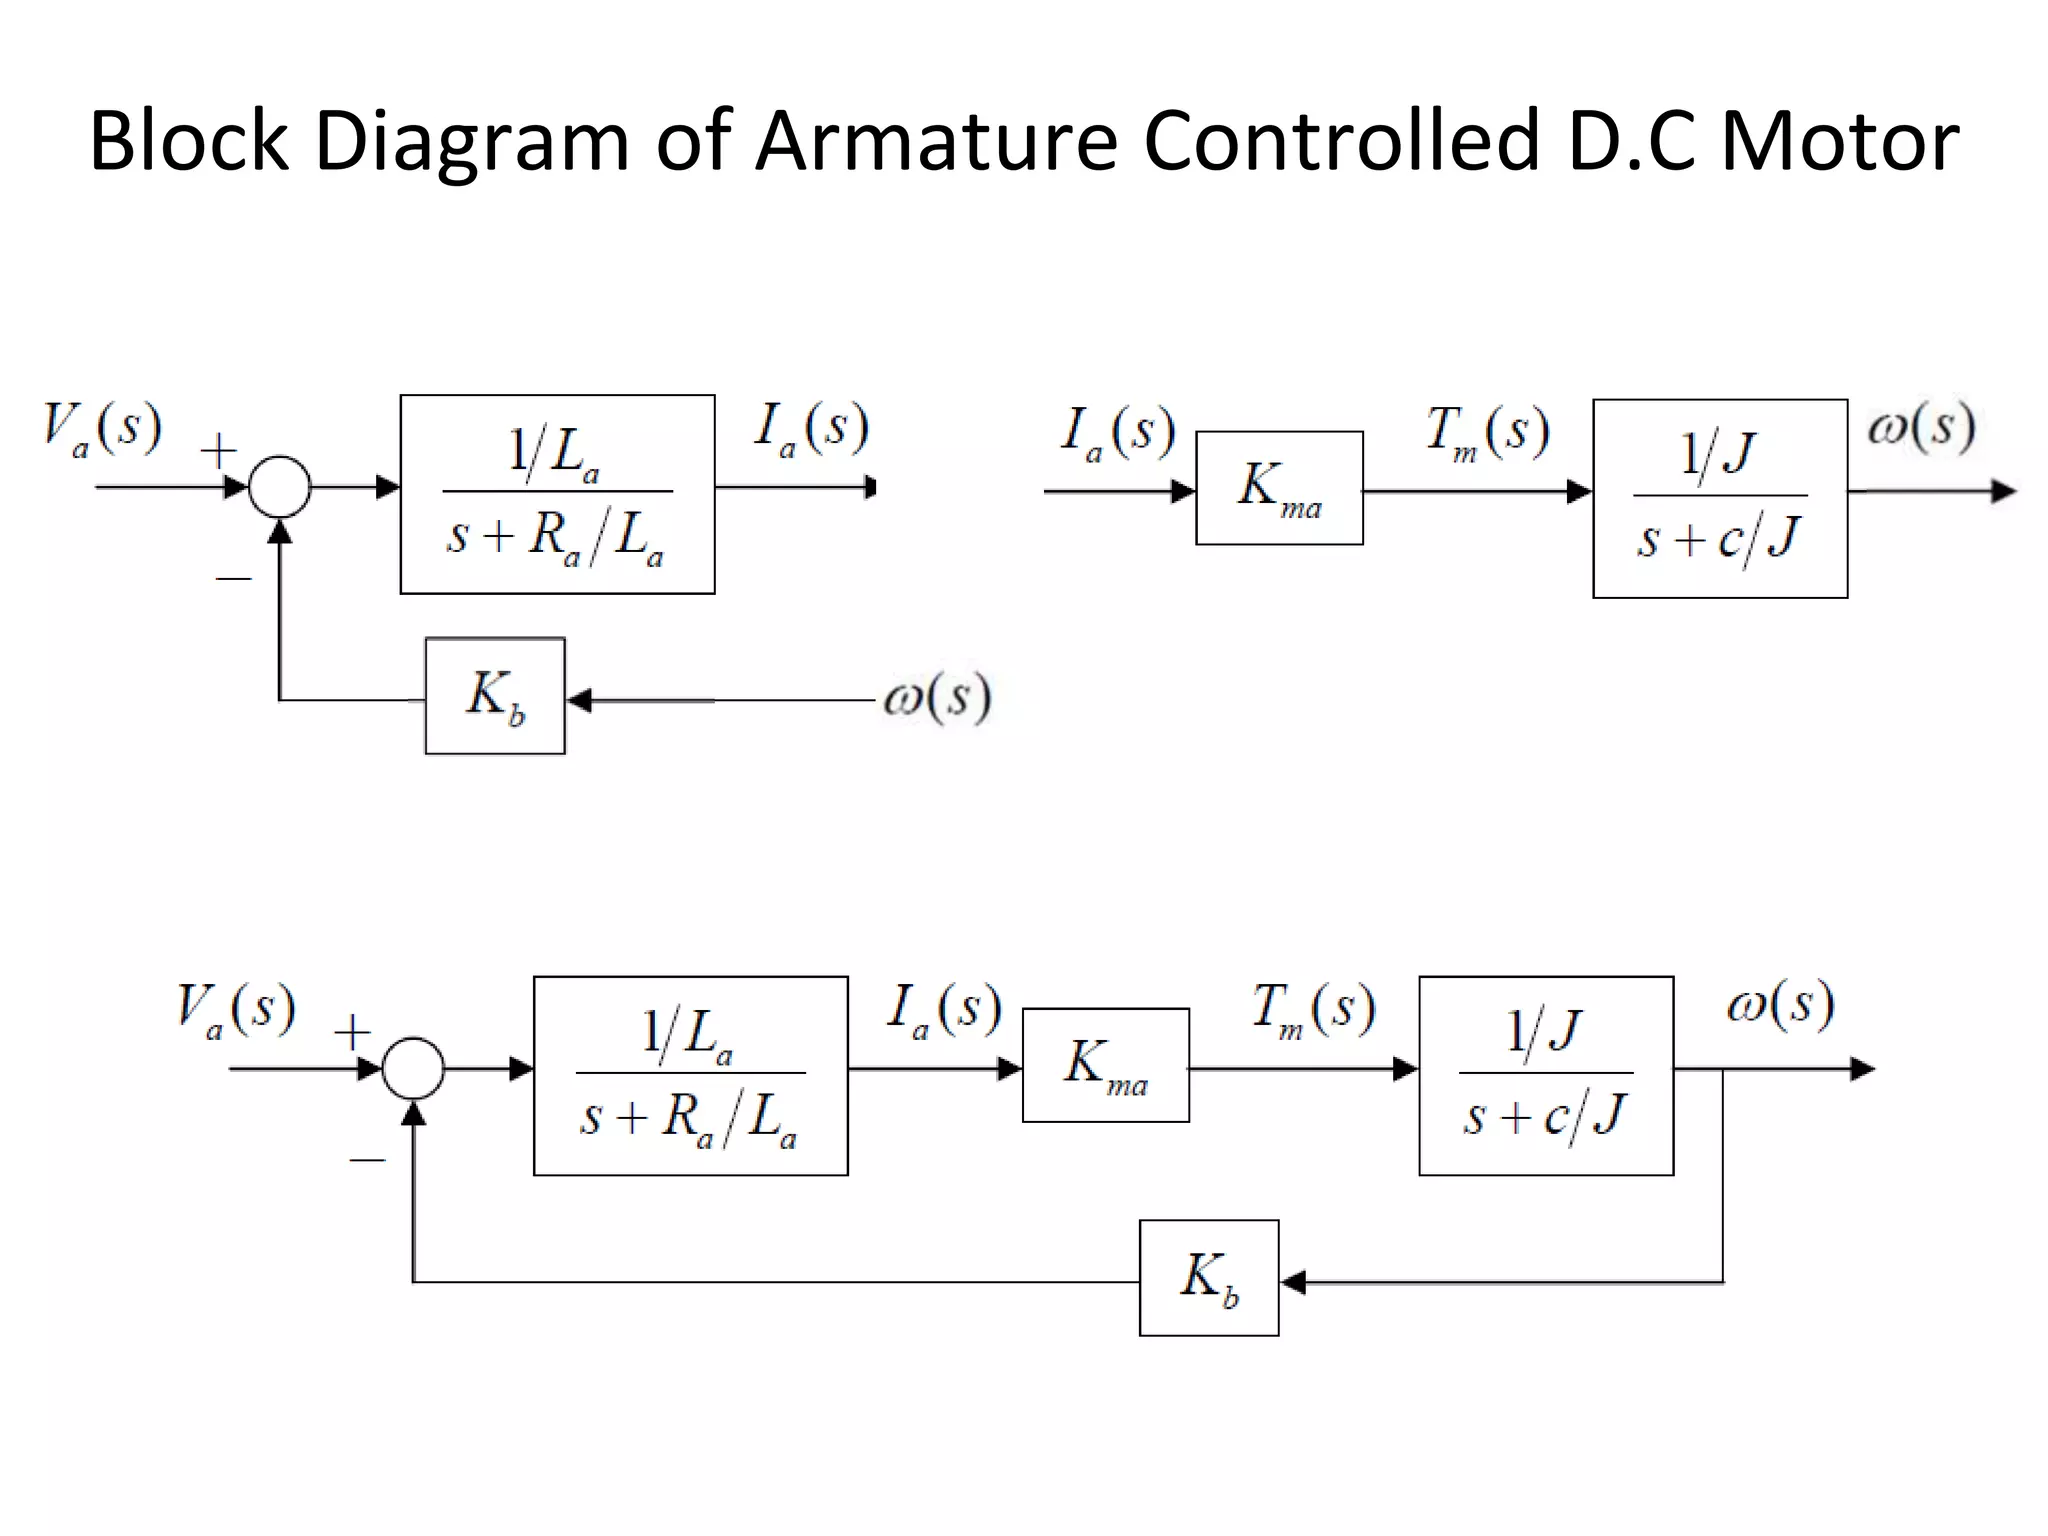
BLOCK DIAGRAM REPRESENTATION OF CONTROL SYSTEMS
Introduction
‱ A Block Diagram is a shorthand pictorial representation of
the cause-and-effect relationship of a system.
‱ The interior of the rectangle representing the block usually
contains a description of or the name of the element, gain,
or the symbol for the mathematical operation to be
performed on the input to yield the output.
‱ The arrows represent the direction of information or signal
flow.
Introduction
‱ The operations of addition and subtraction have a special
representation.
‱ The block becomes a small circle, called a summing point, with
the appropriate plus or minus sign associated with the arrows
entering the circle.
‱ The output is the algebraic sum of the inputs.
‱ Any number of inputs may enter a summing point.
‱ Some books put a cross in the circle.
Introduction
‱ In order to have the same signal or variable be an input
to more than one block or summing point, a takeoff (or
pickoff) point is used.
‱ This permits the signal to proceed unaltered along
several different paths to several destinations.
Example-1
‱
Example-1
Example-2
‱ Draw the Block Diagrams of the following equations.
Canonical Form of A Feedback Control System
Characteristic Equation
‱ The control ratio is the closed loop transfer function of the system.
‱ The denominator of closed loop transfer function determines the
characteristic equation of the system.
‱ Which is usually determined as:
Example-3
1. loop transfer function
2. Feed Forward Transfer function
3. control ratio
4. feedback ratio
5. error ratio
6. closed loop transfer function
7. characteristic equation
8. Open loop poles and zeros if 9. closed loop poles and zeros if K=10.
Reduction techniques
1. Combining blocks in cascade
2. Combining blocks in parallel
3. Eliminating a feedback loop
Example-4: Reduce the Block Diagram to Canonical Form.
Example-4: Continue.
Example-5
‱ For the system represented by the following block diagram
determine:
1. Open loop transfer function
2. Feed Forward Transfer function
3. control ratio
4. feedback ratio
5. error ratio
6. closed loop transfer function
7. characteristic equation
8. closed loop poles and zeros if K=10.
Example-5
– First we will reduce the given block diagram to canonical form
Example-5
Example-5 (see example-3)
1. Open loop transfer function
2. Feed Forward Transfer function
3. control ratio
4. feedback ratio
5. error ratio
6. closed loop transfer function
7. characteristic equation
8. closed loop poles and zeros if K=10.
Example-6
‱ For the system represented by the following block diagram
determine:
1. Open loop transfer function
2. Feed Forward Transfer function
3. control ratio
4. feedback ratio
5. error ratio
6. closed loop transfer function
7. characteristic equation
8. closed loop poles and zeros if K=100.
Reduction techniques
4. Moving a summing point behind a block
5. Moving a summing point ahead a block
7. Moving a pickoff point ahead of a block
6. Moving a pickoff point behind a block
8. Swap with two neighboring summing points
Example-7
_
+
_
+
+
+
‱ Reduce the following block diagram to canonical form.
Example-7
_
+
_
+
+
+
Example-7
_
+
_
+
+
+
Example-7
_
+
_
+ +
+
_
+
_
+
Example-7
_
+
_
+
Example-7
_
+
Example-7
Example 8
Find the transfer function of the following block diagram
)
(s
R
1. Moving pickoff point A ahead of block
2. Eliminate loop I & simplify
Solution:
3. Moving pickoff point B behind block
4. Eliminate loop III
Example 9
Find the transfer function of the following block diagrams
Solution:
1. Moving pickoff point A behind block
2. Eliminate loop I and Simplify
Not feedback
feedback
3. Eliminate loop II & IIII
Example-10: Reduce the Block Diagram.
Example-10: Continue.
Example-11: Simplify the block diagram then obtain the close-
loop transfer function C(S)/R(S). (from Ogata: Page-47)
Example-11: Continue.
Superposition of Multiple Inputs
Example-12: Multiple Input System. Determine the output C
due to inputs R and U using the Superposition Method.
Example-12: Continue.
Example-13: Multiple-Input System. Determine the output C
due to inputs R, U1 and U2 using the Superposition Method.
Example-13: Continue.
Example-14: Multi-Input Multi-Output System. Determine C1
and C2 due to R1 and R2.
Example-14: Continue.
When R1 = 0,
When R2 = 0,
Block Diagram of Armature Controlled D.C Motor
Va
ia
T
Ra La
J
ω
c
eb
Block Diagram of Armature Controlled D.C Motor

Lecture 7