Downloaded 588 times
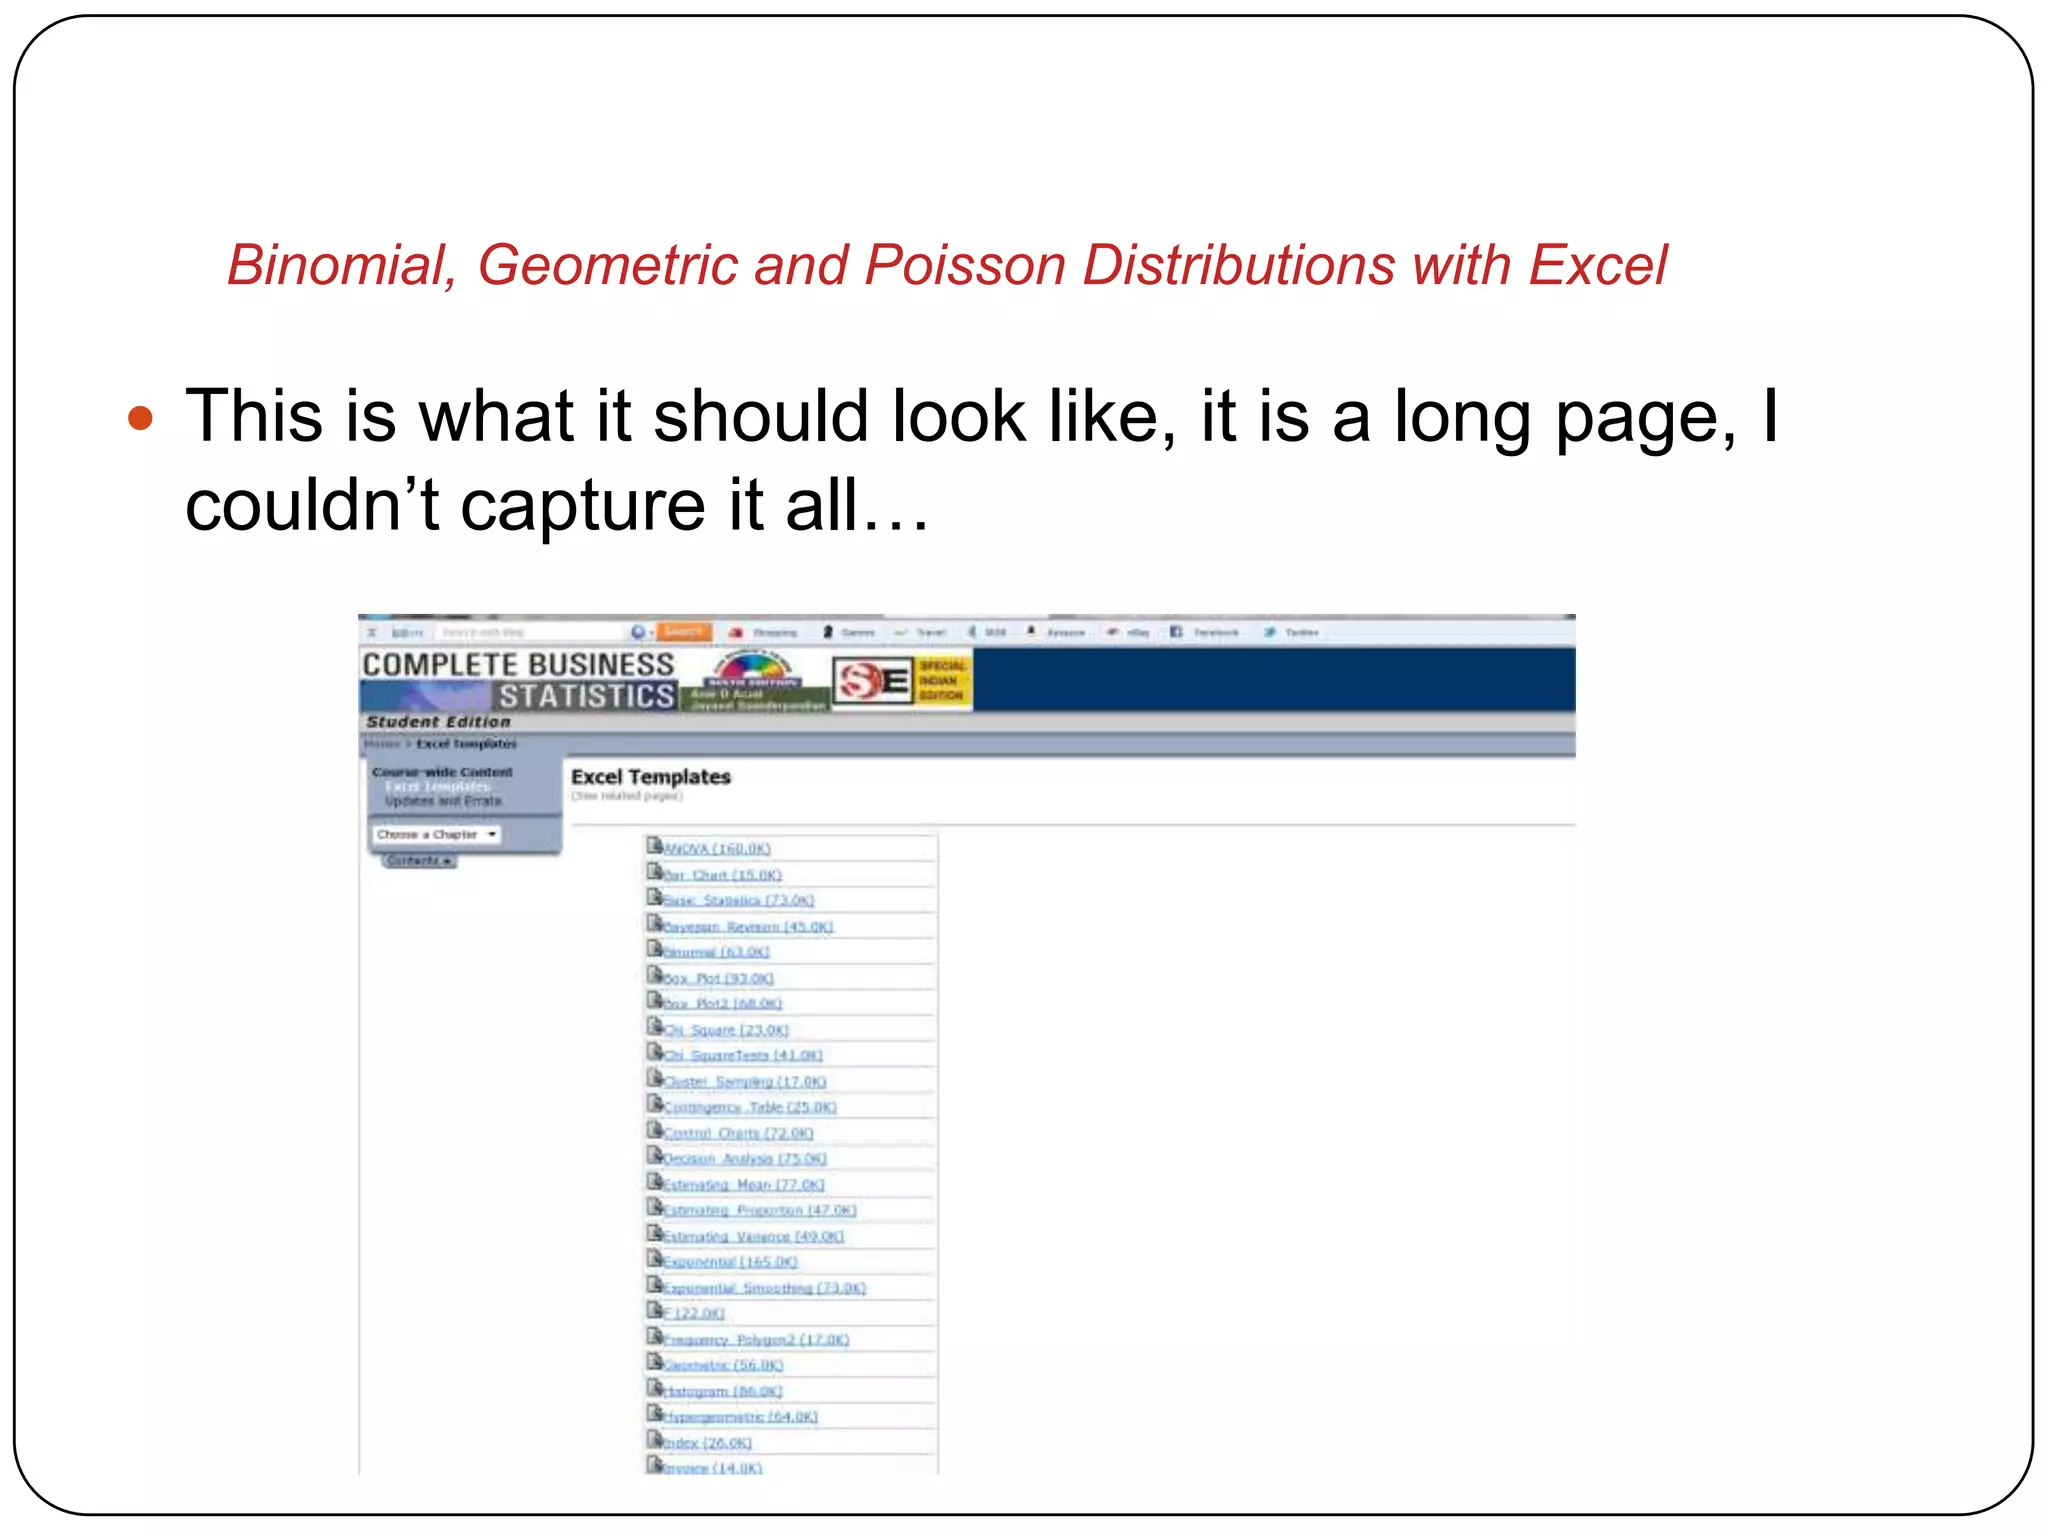
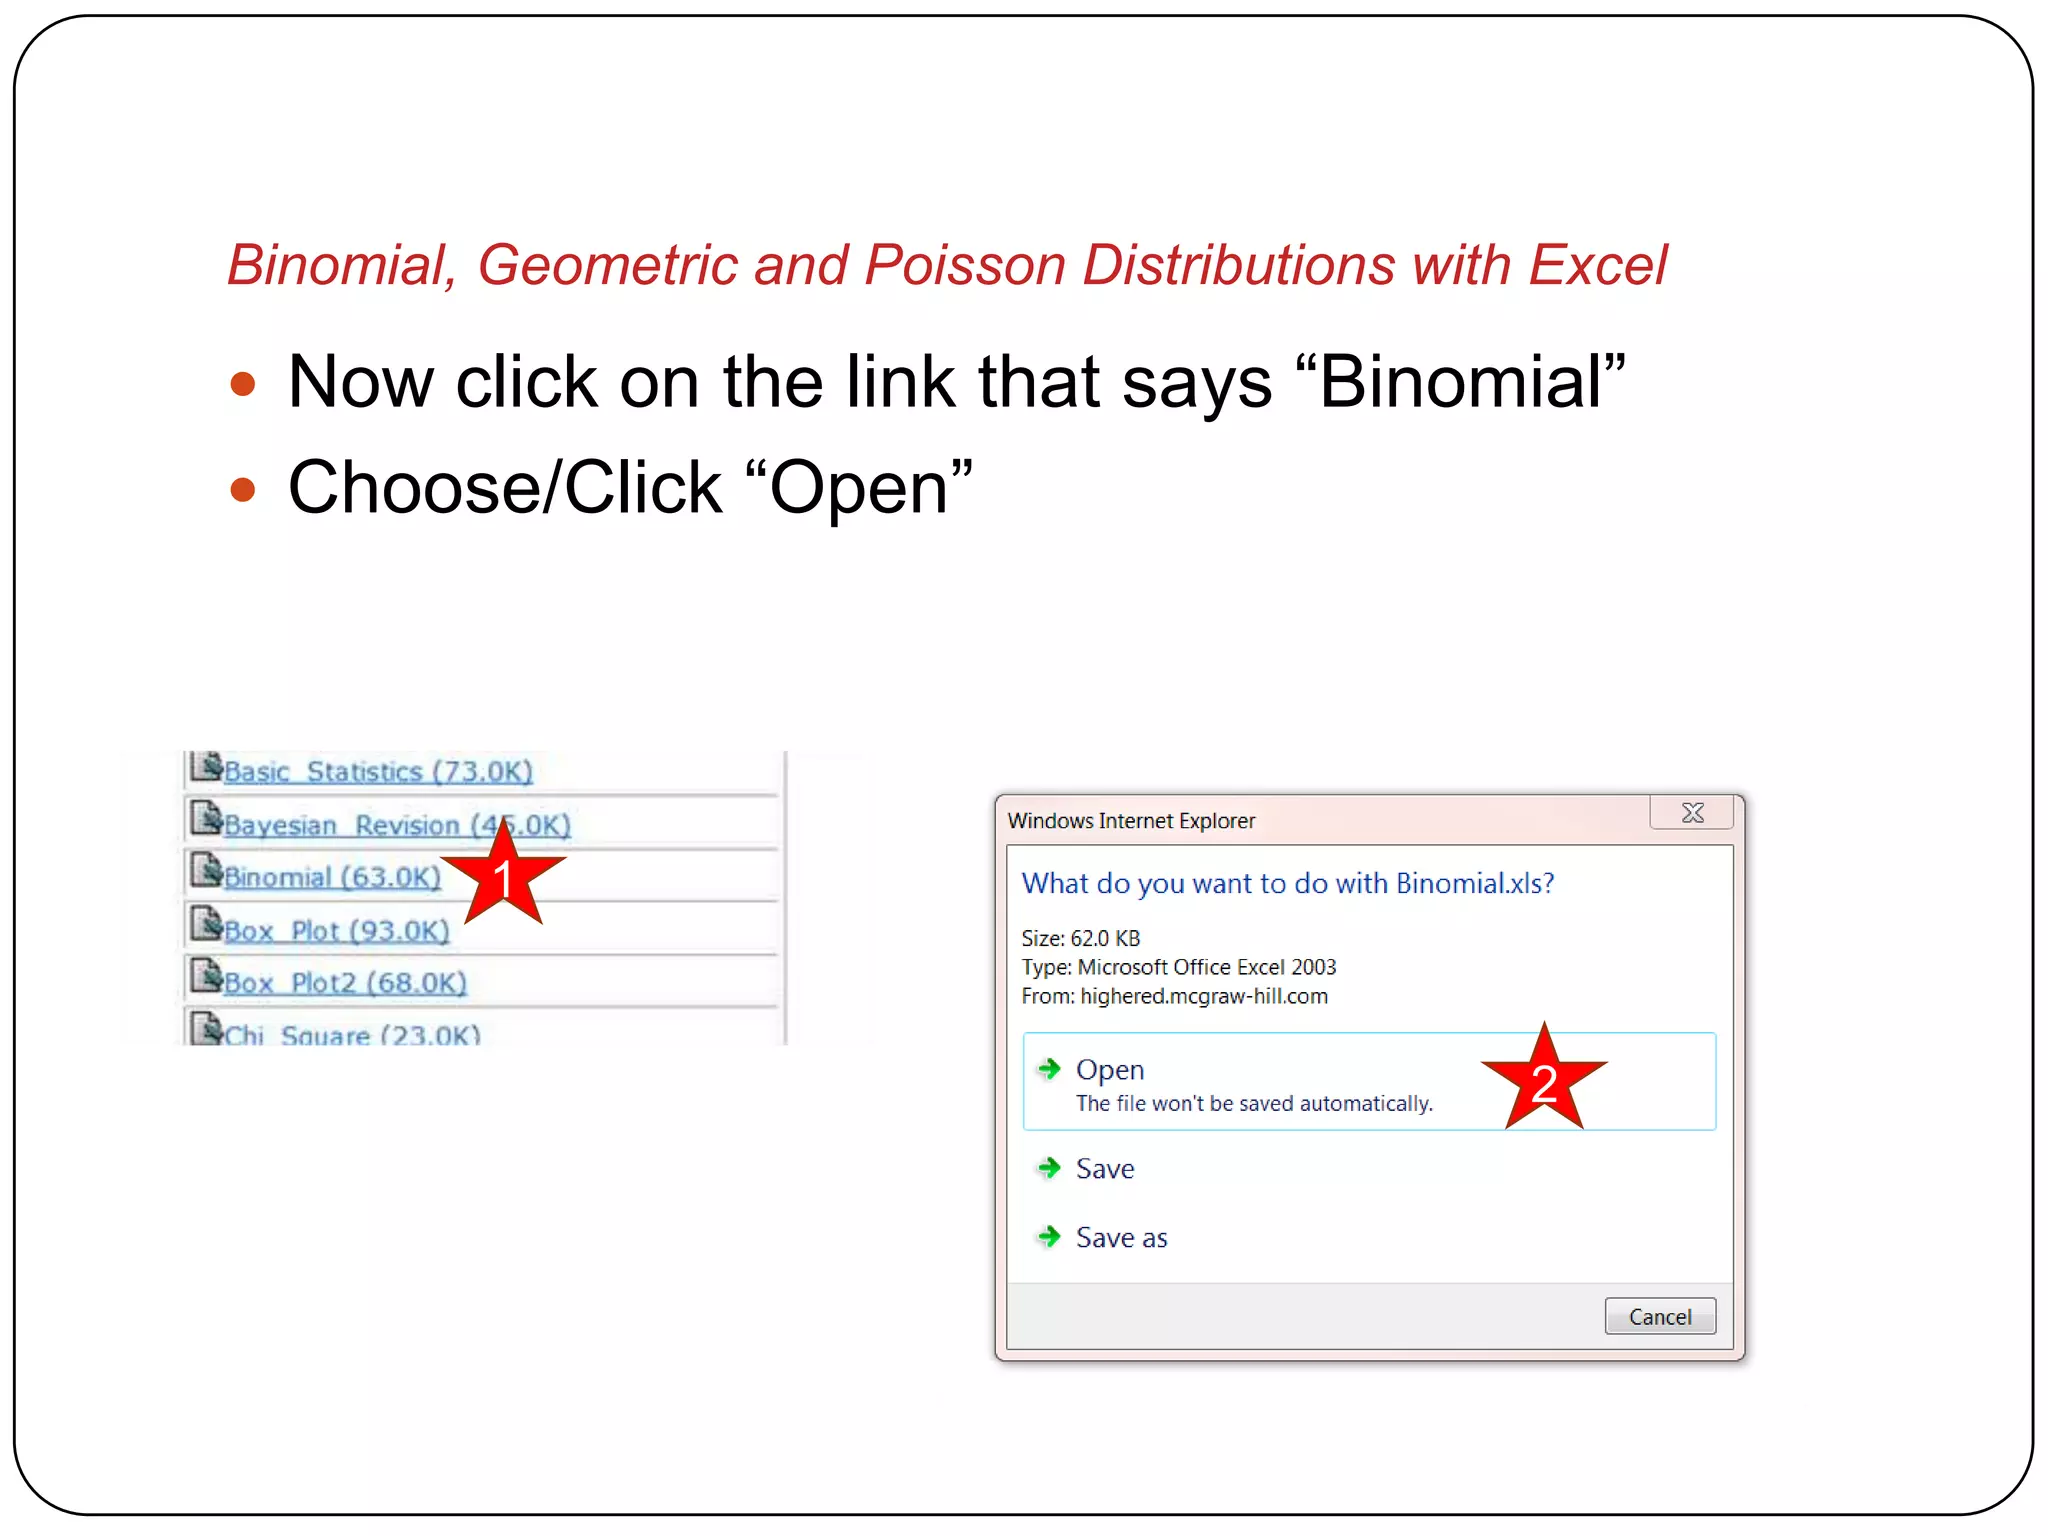
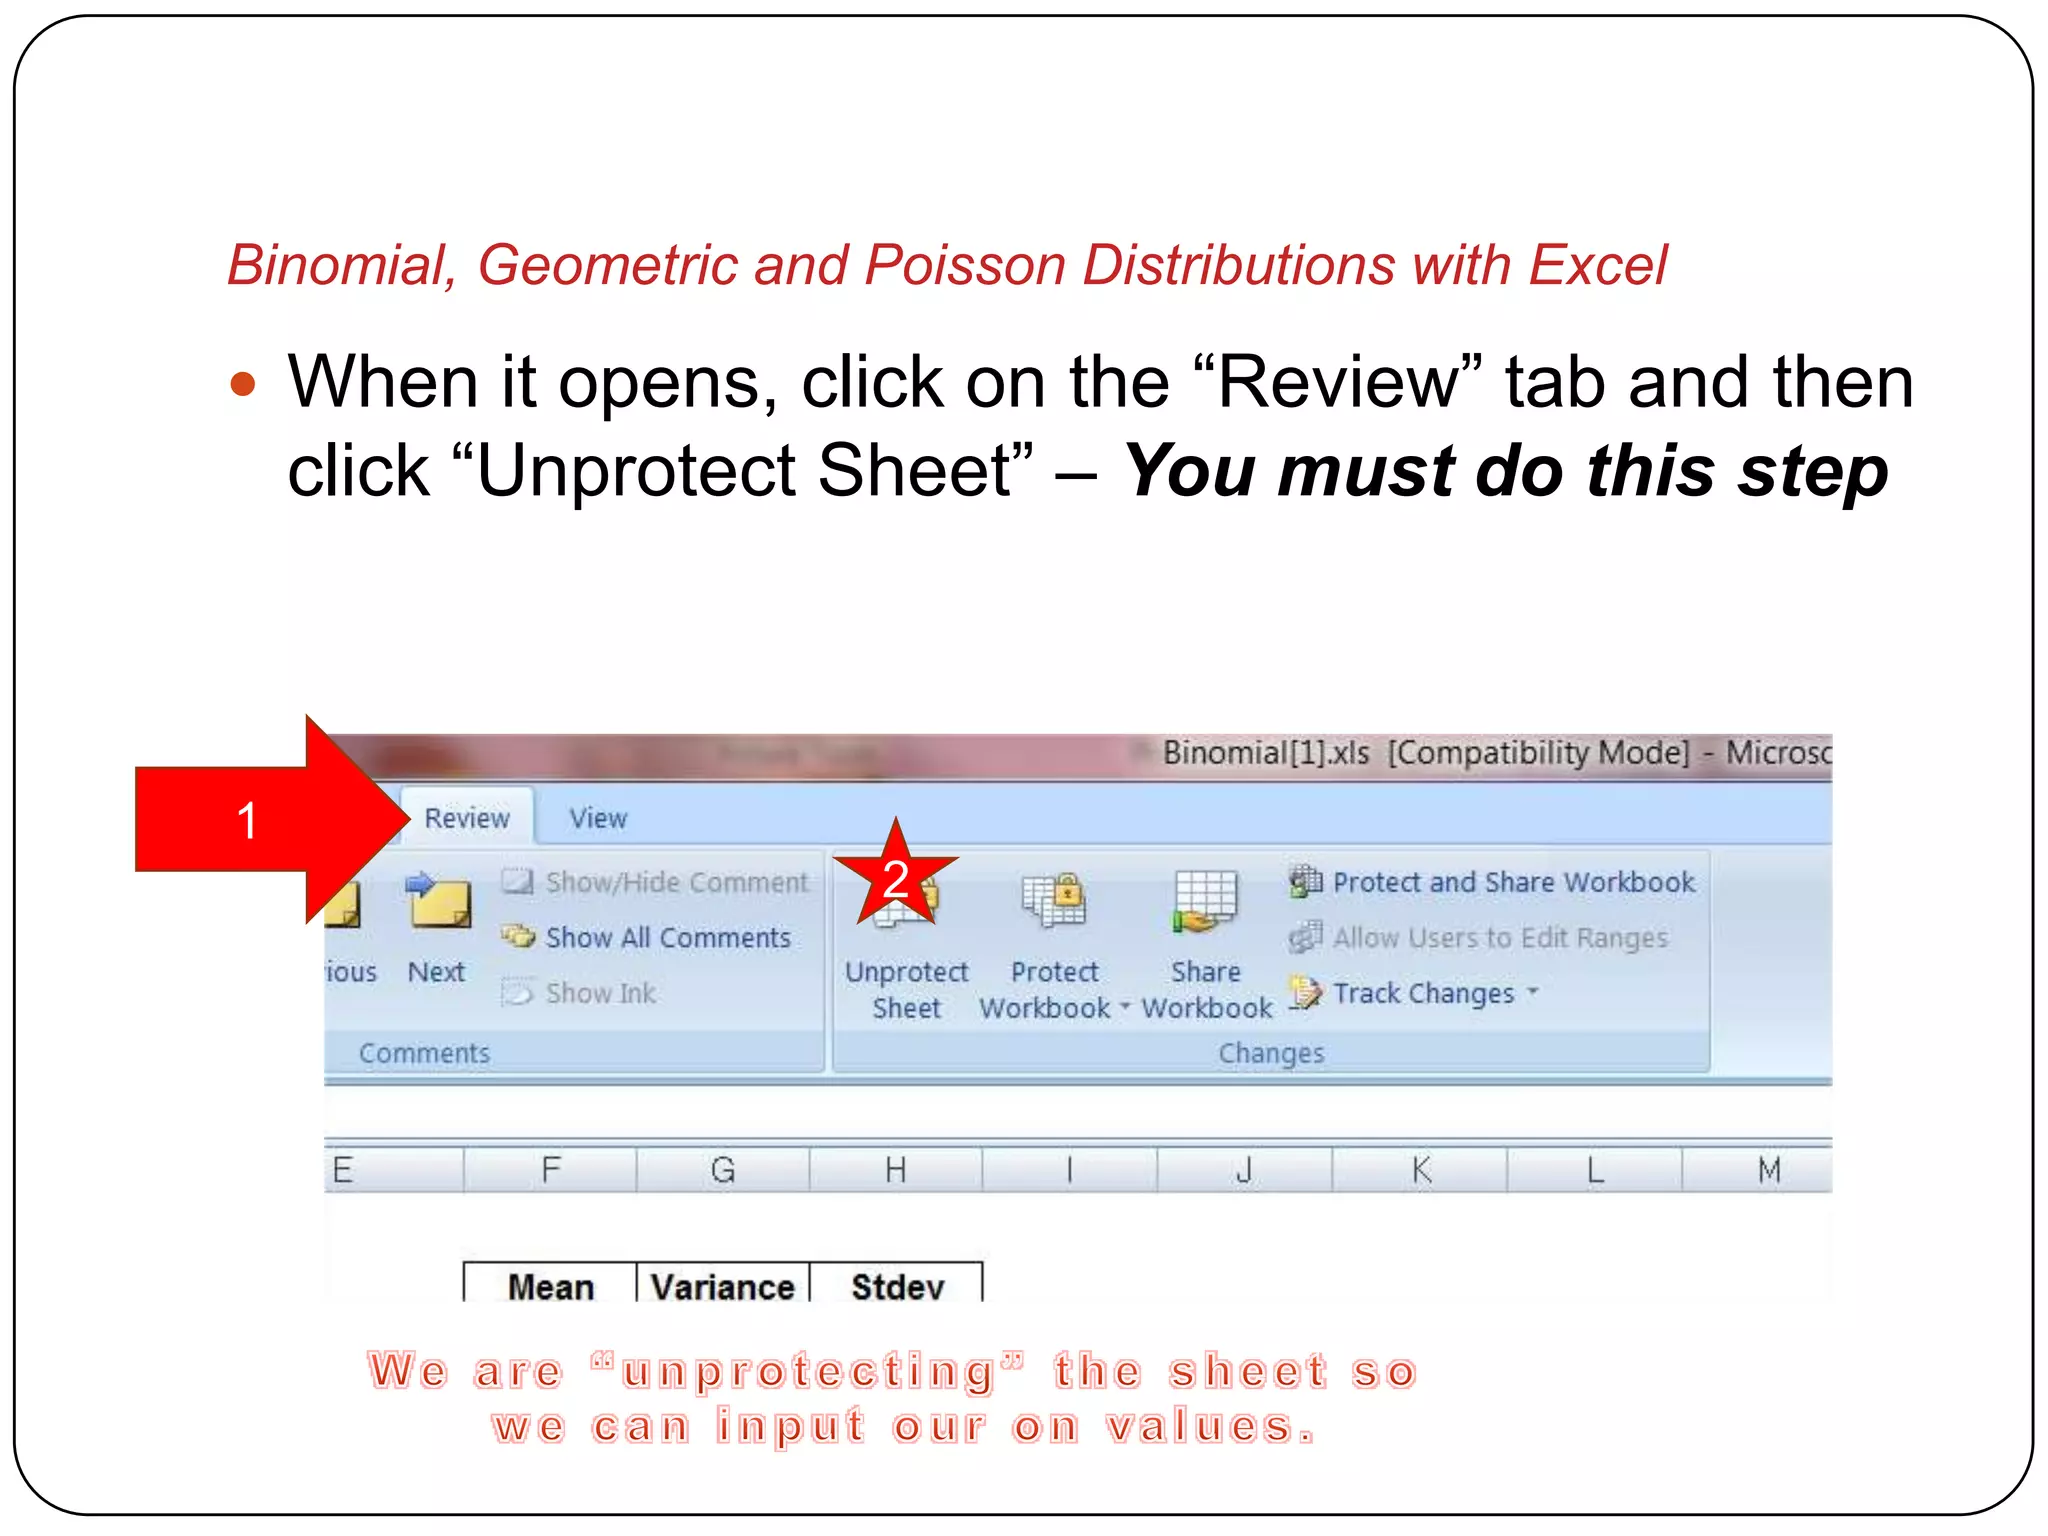
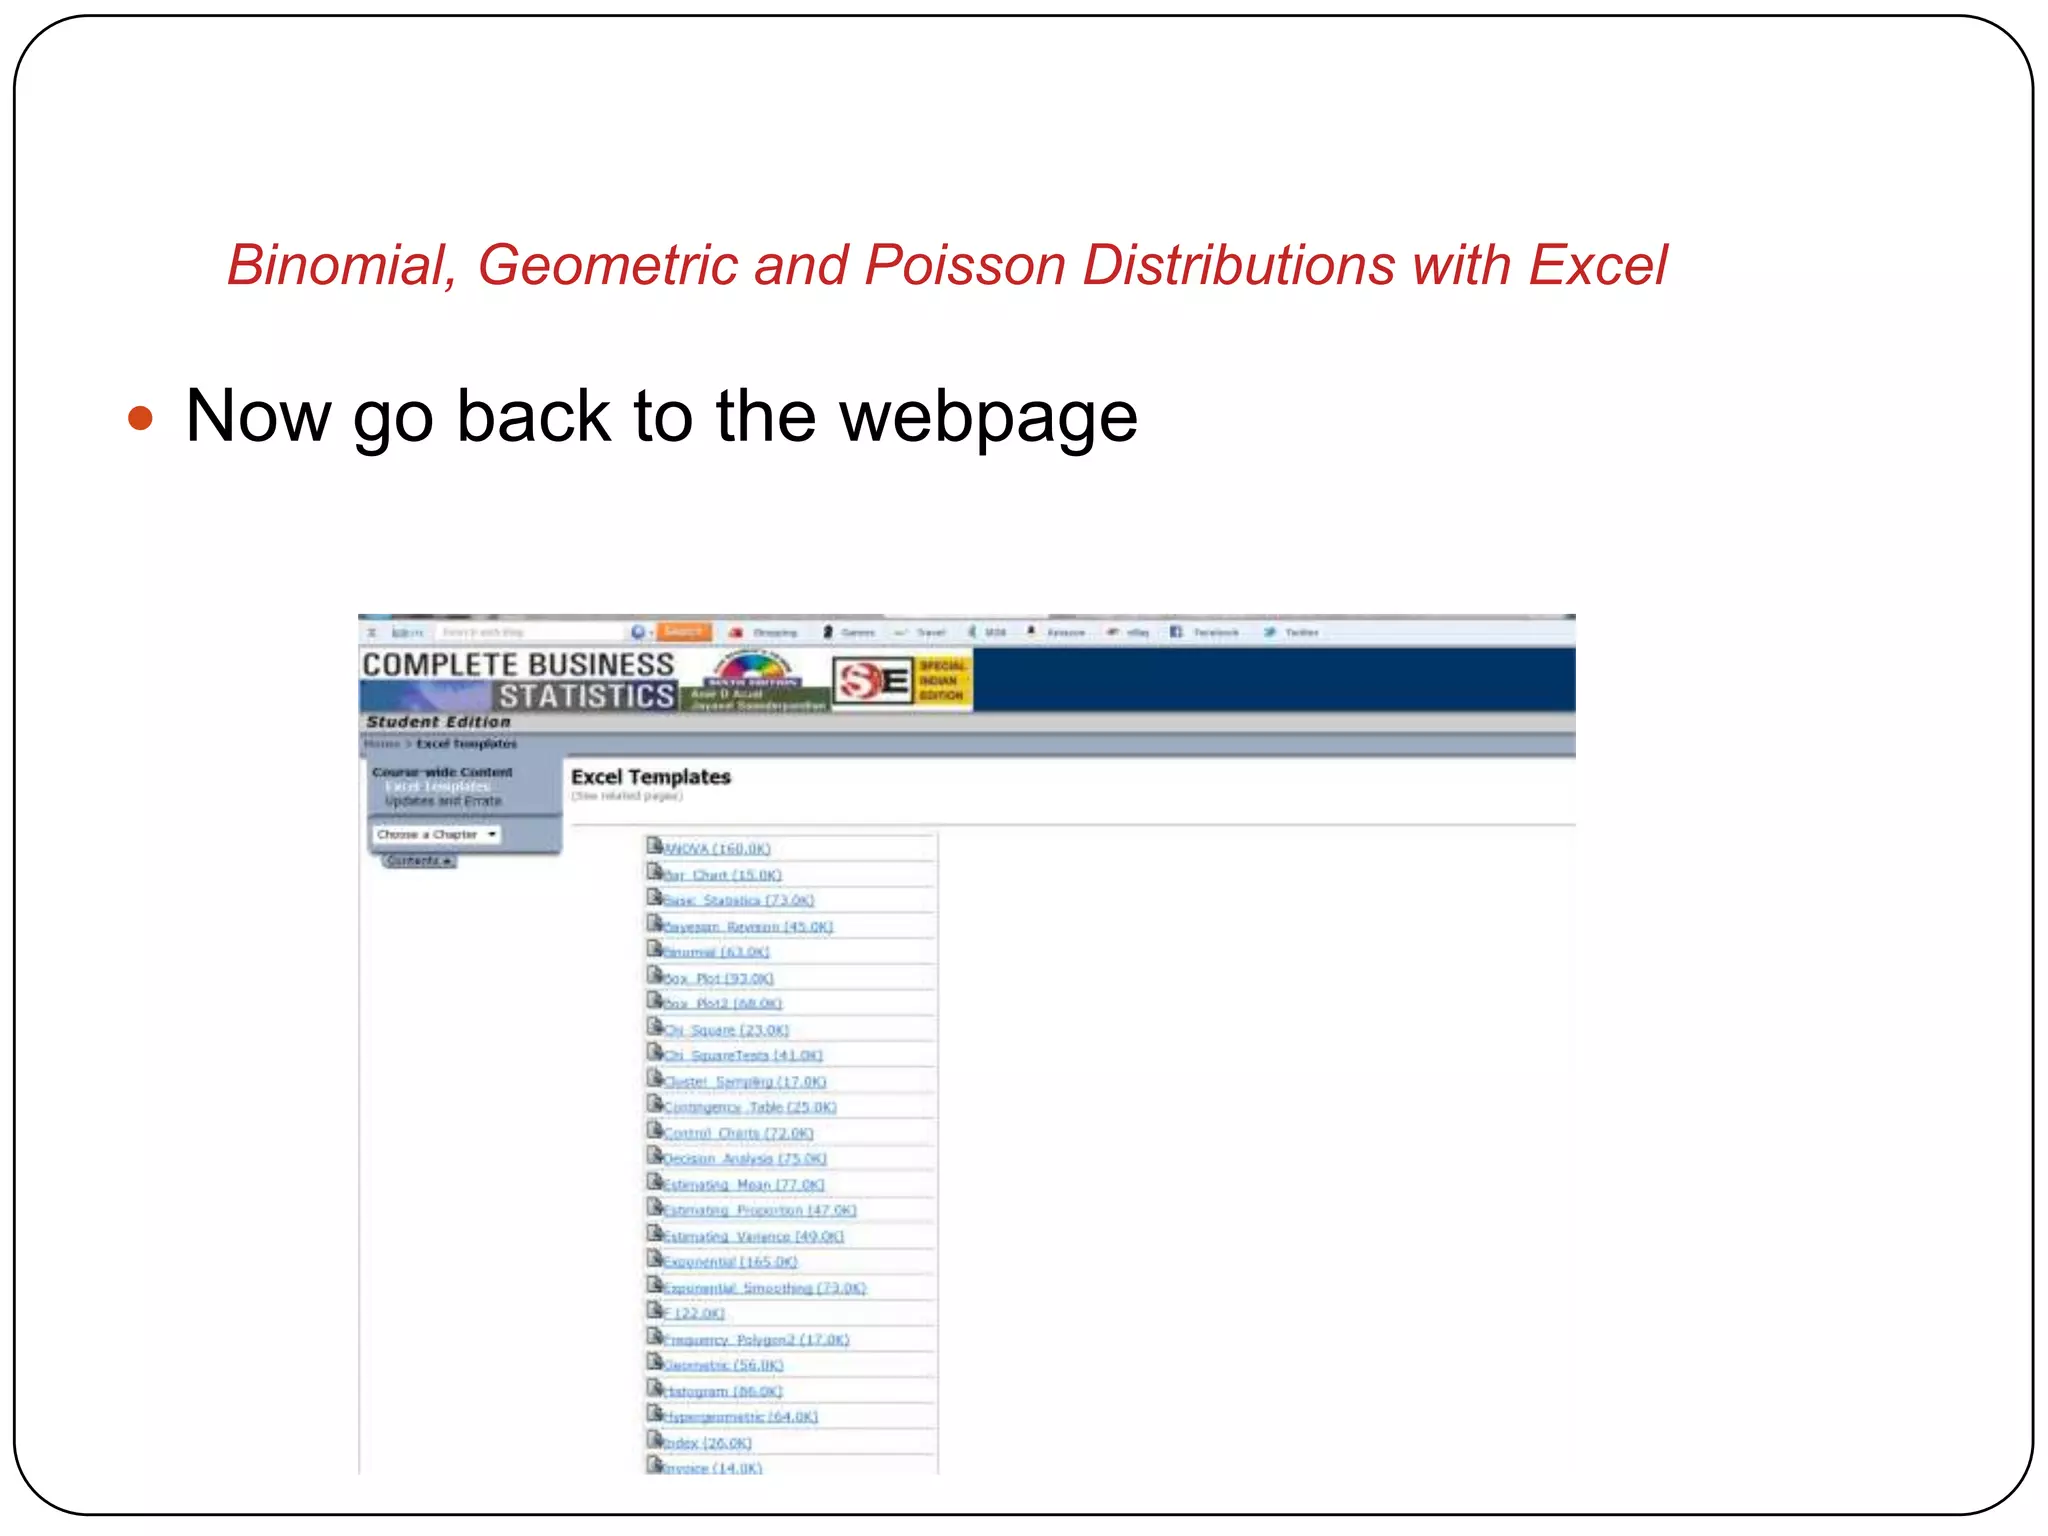
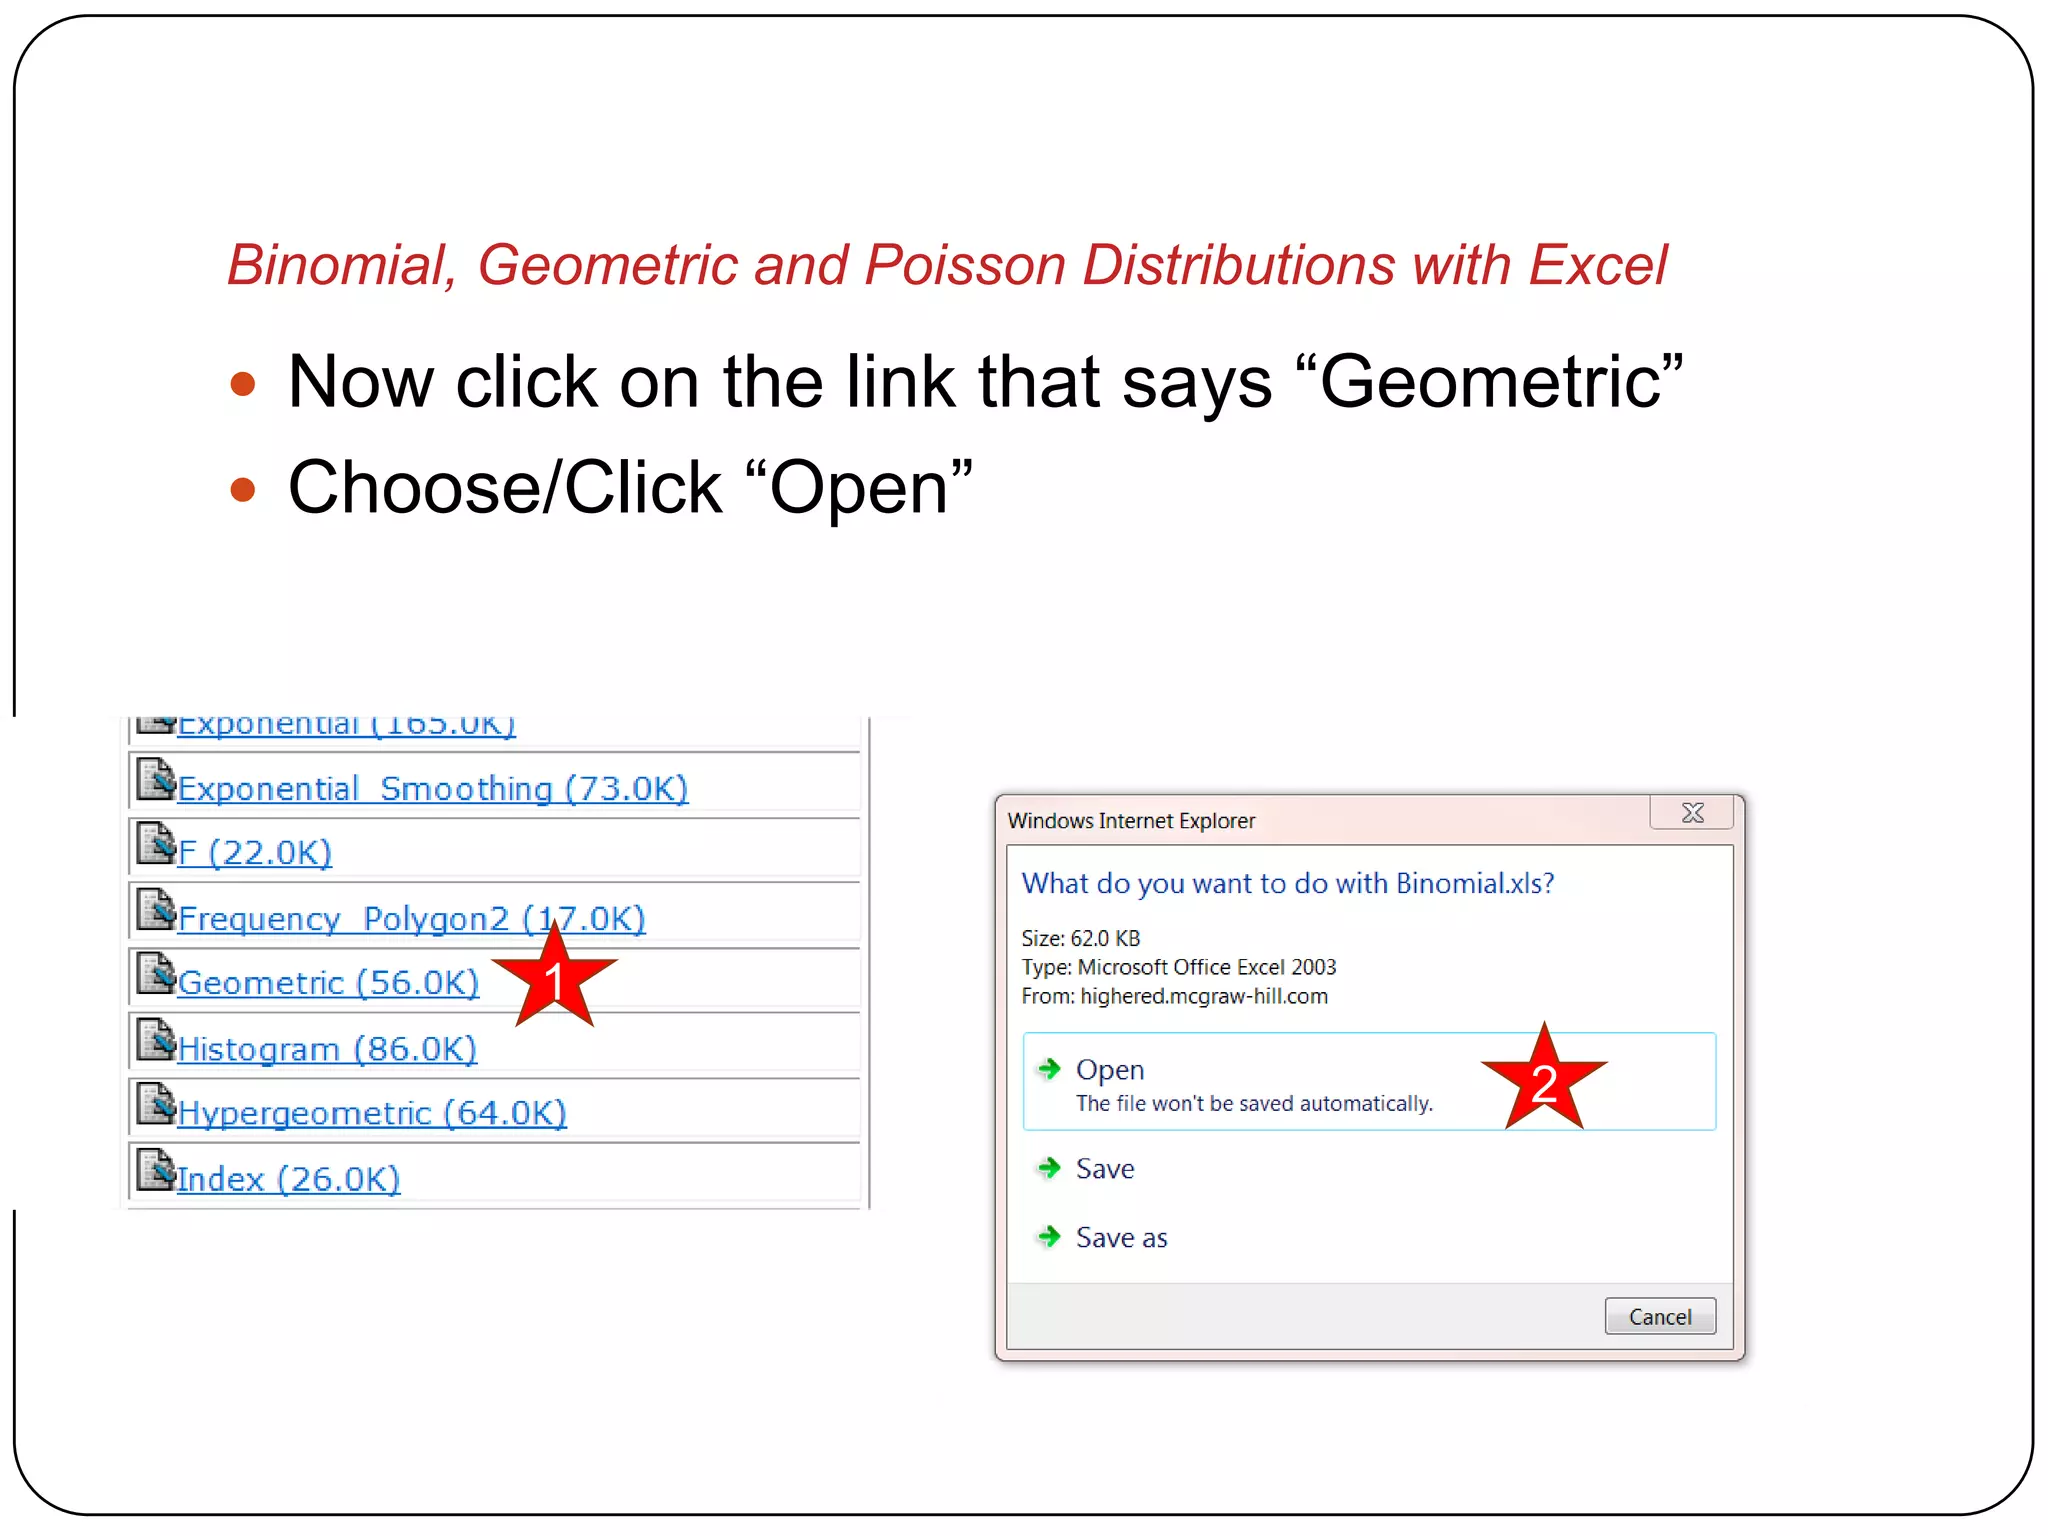
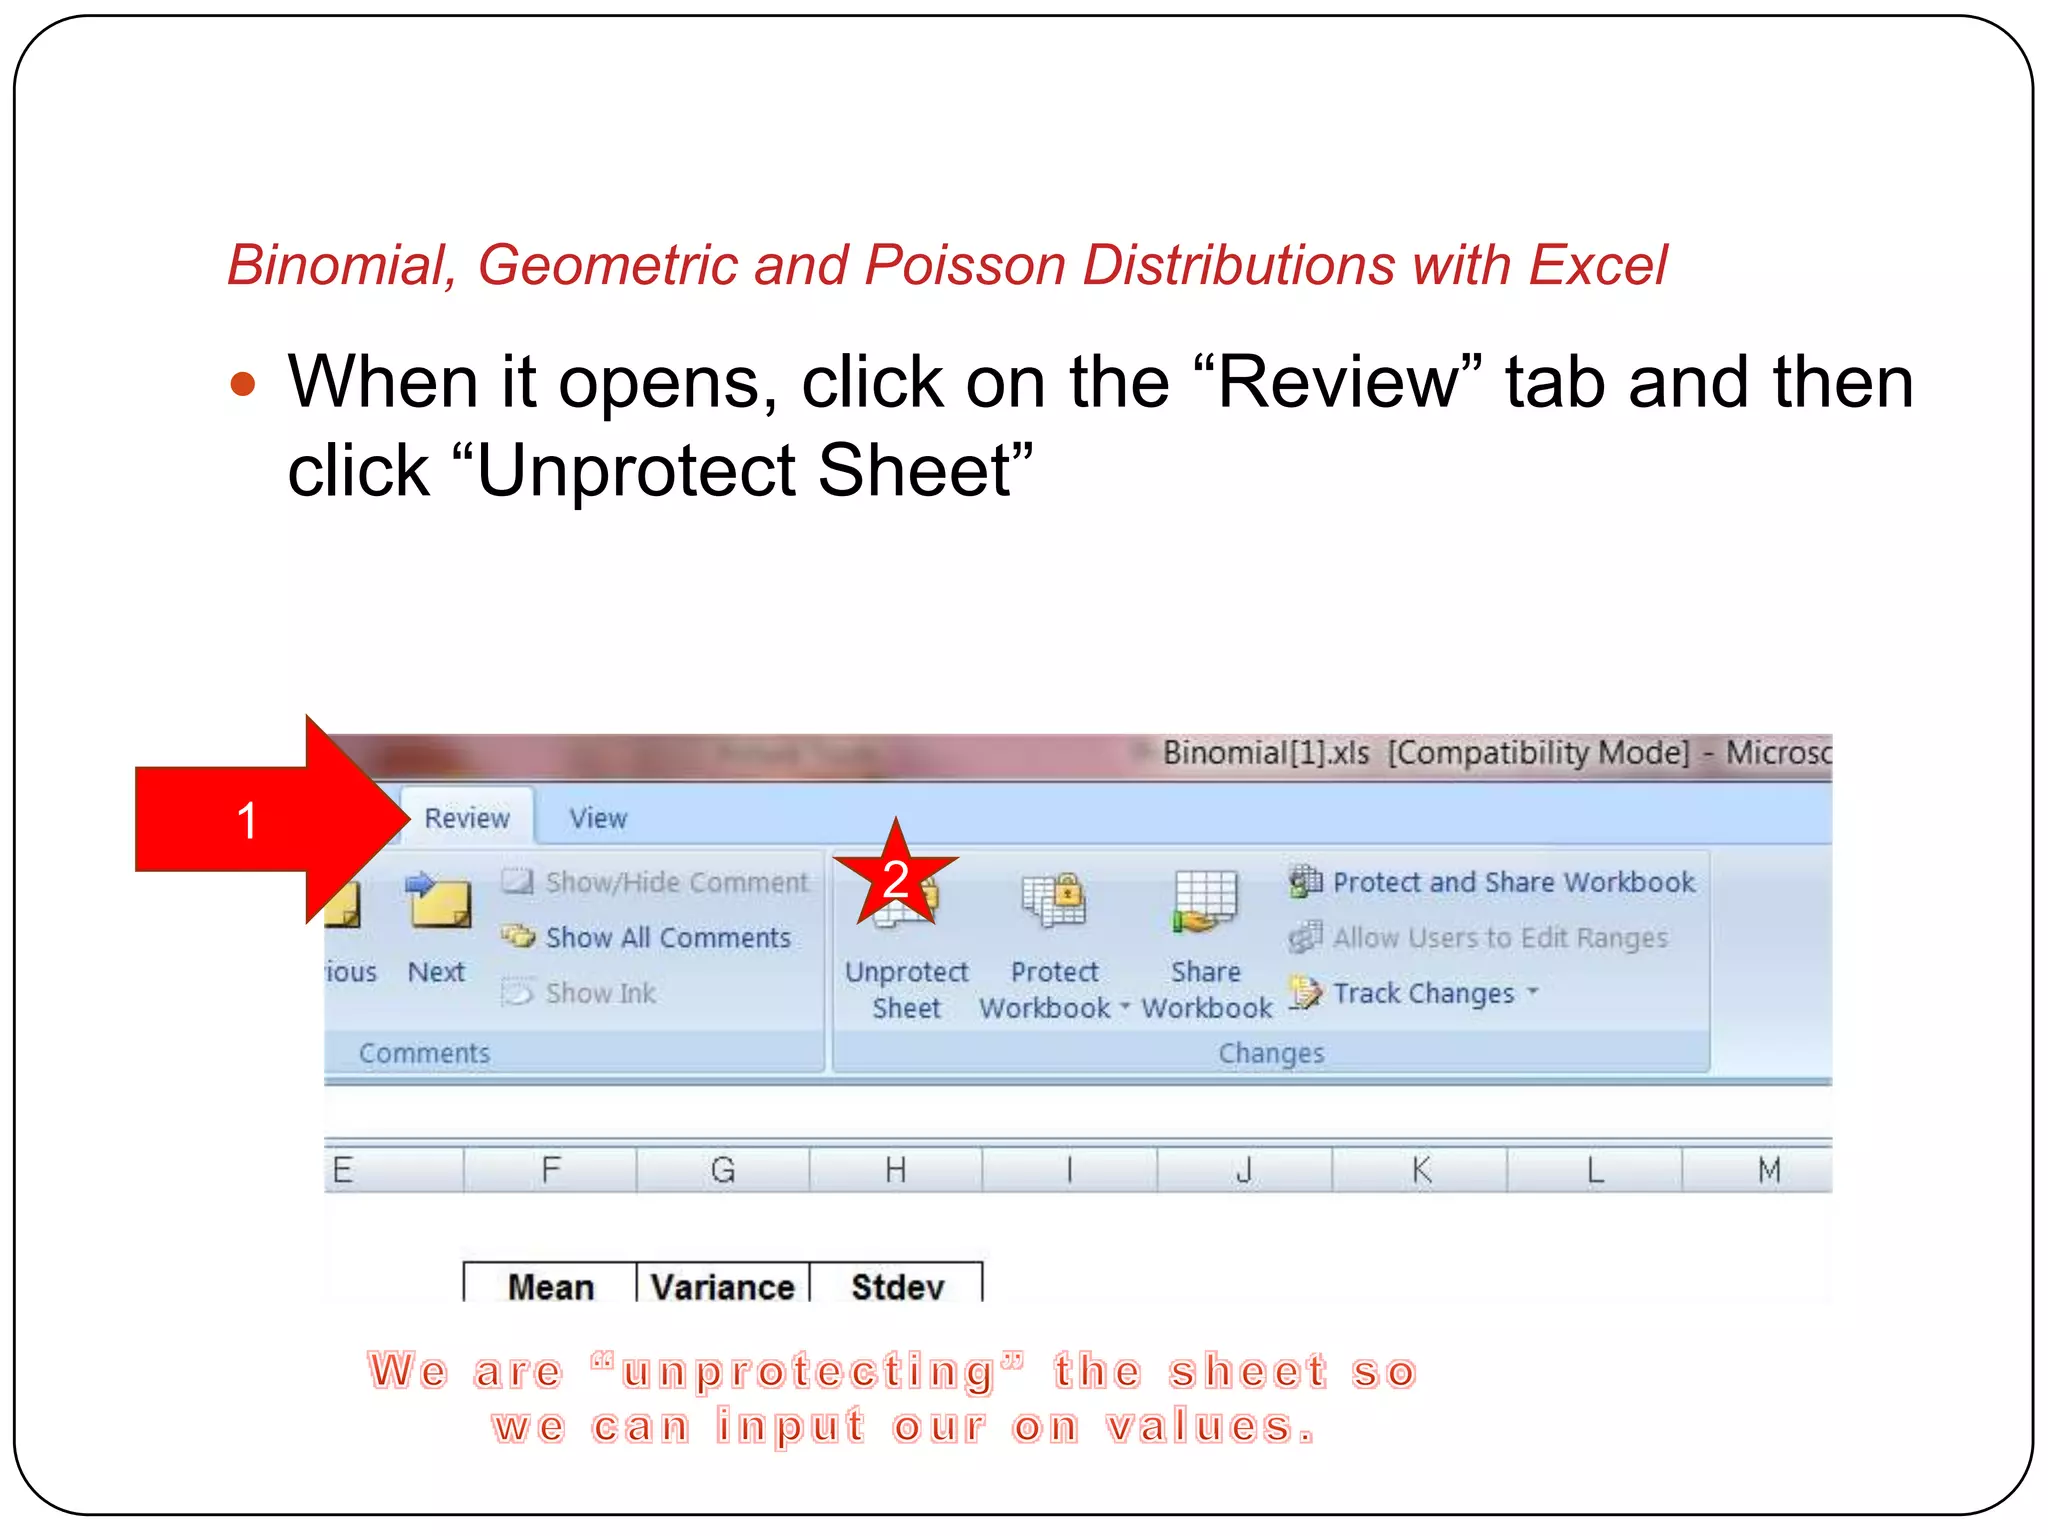

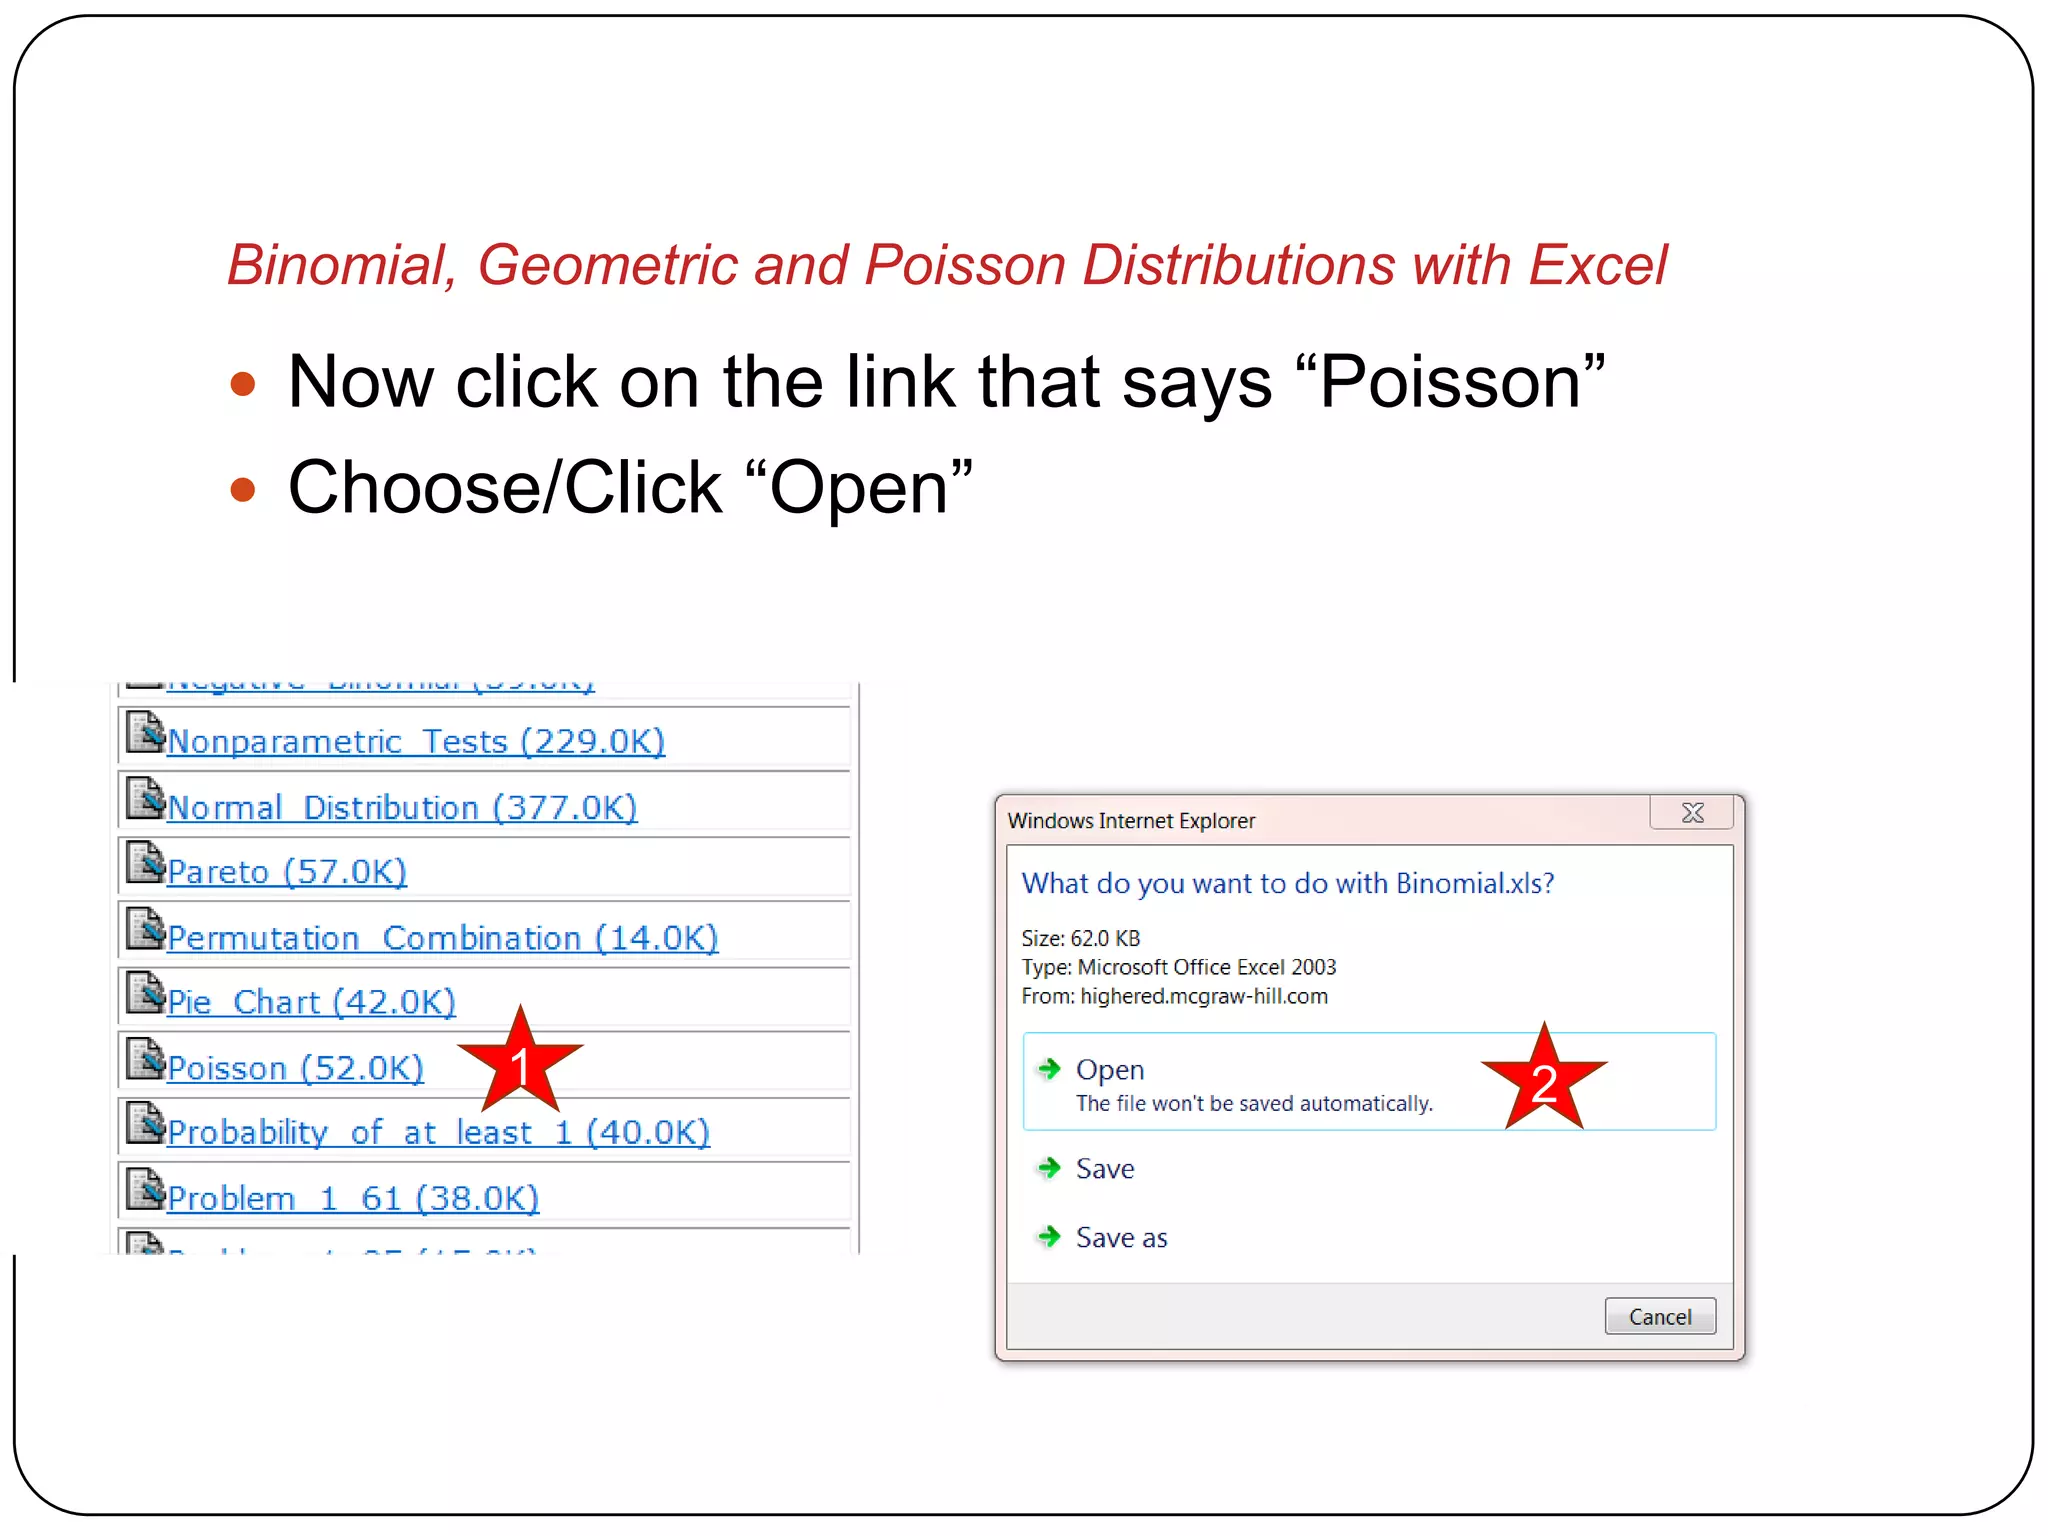

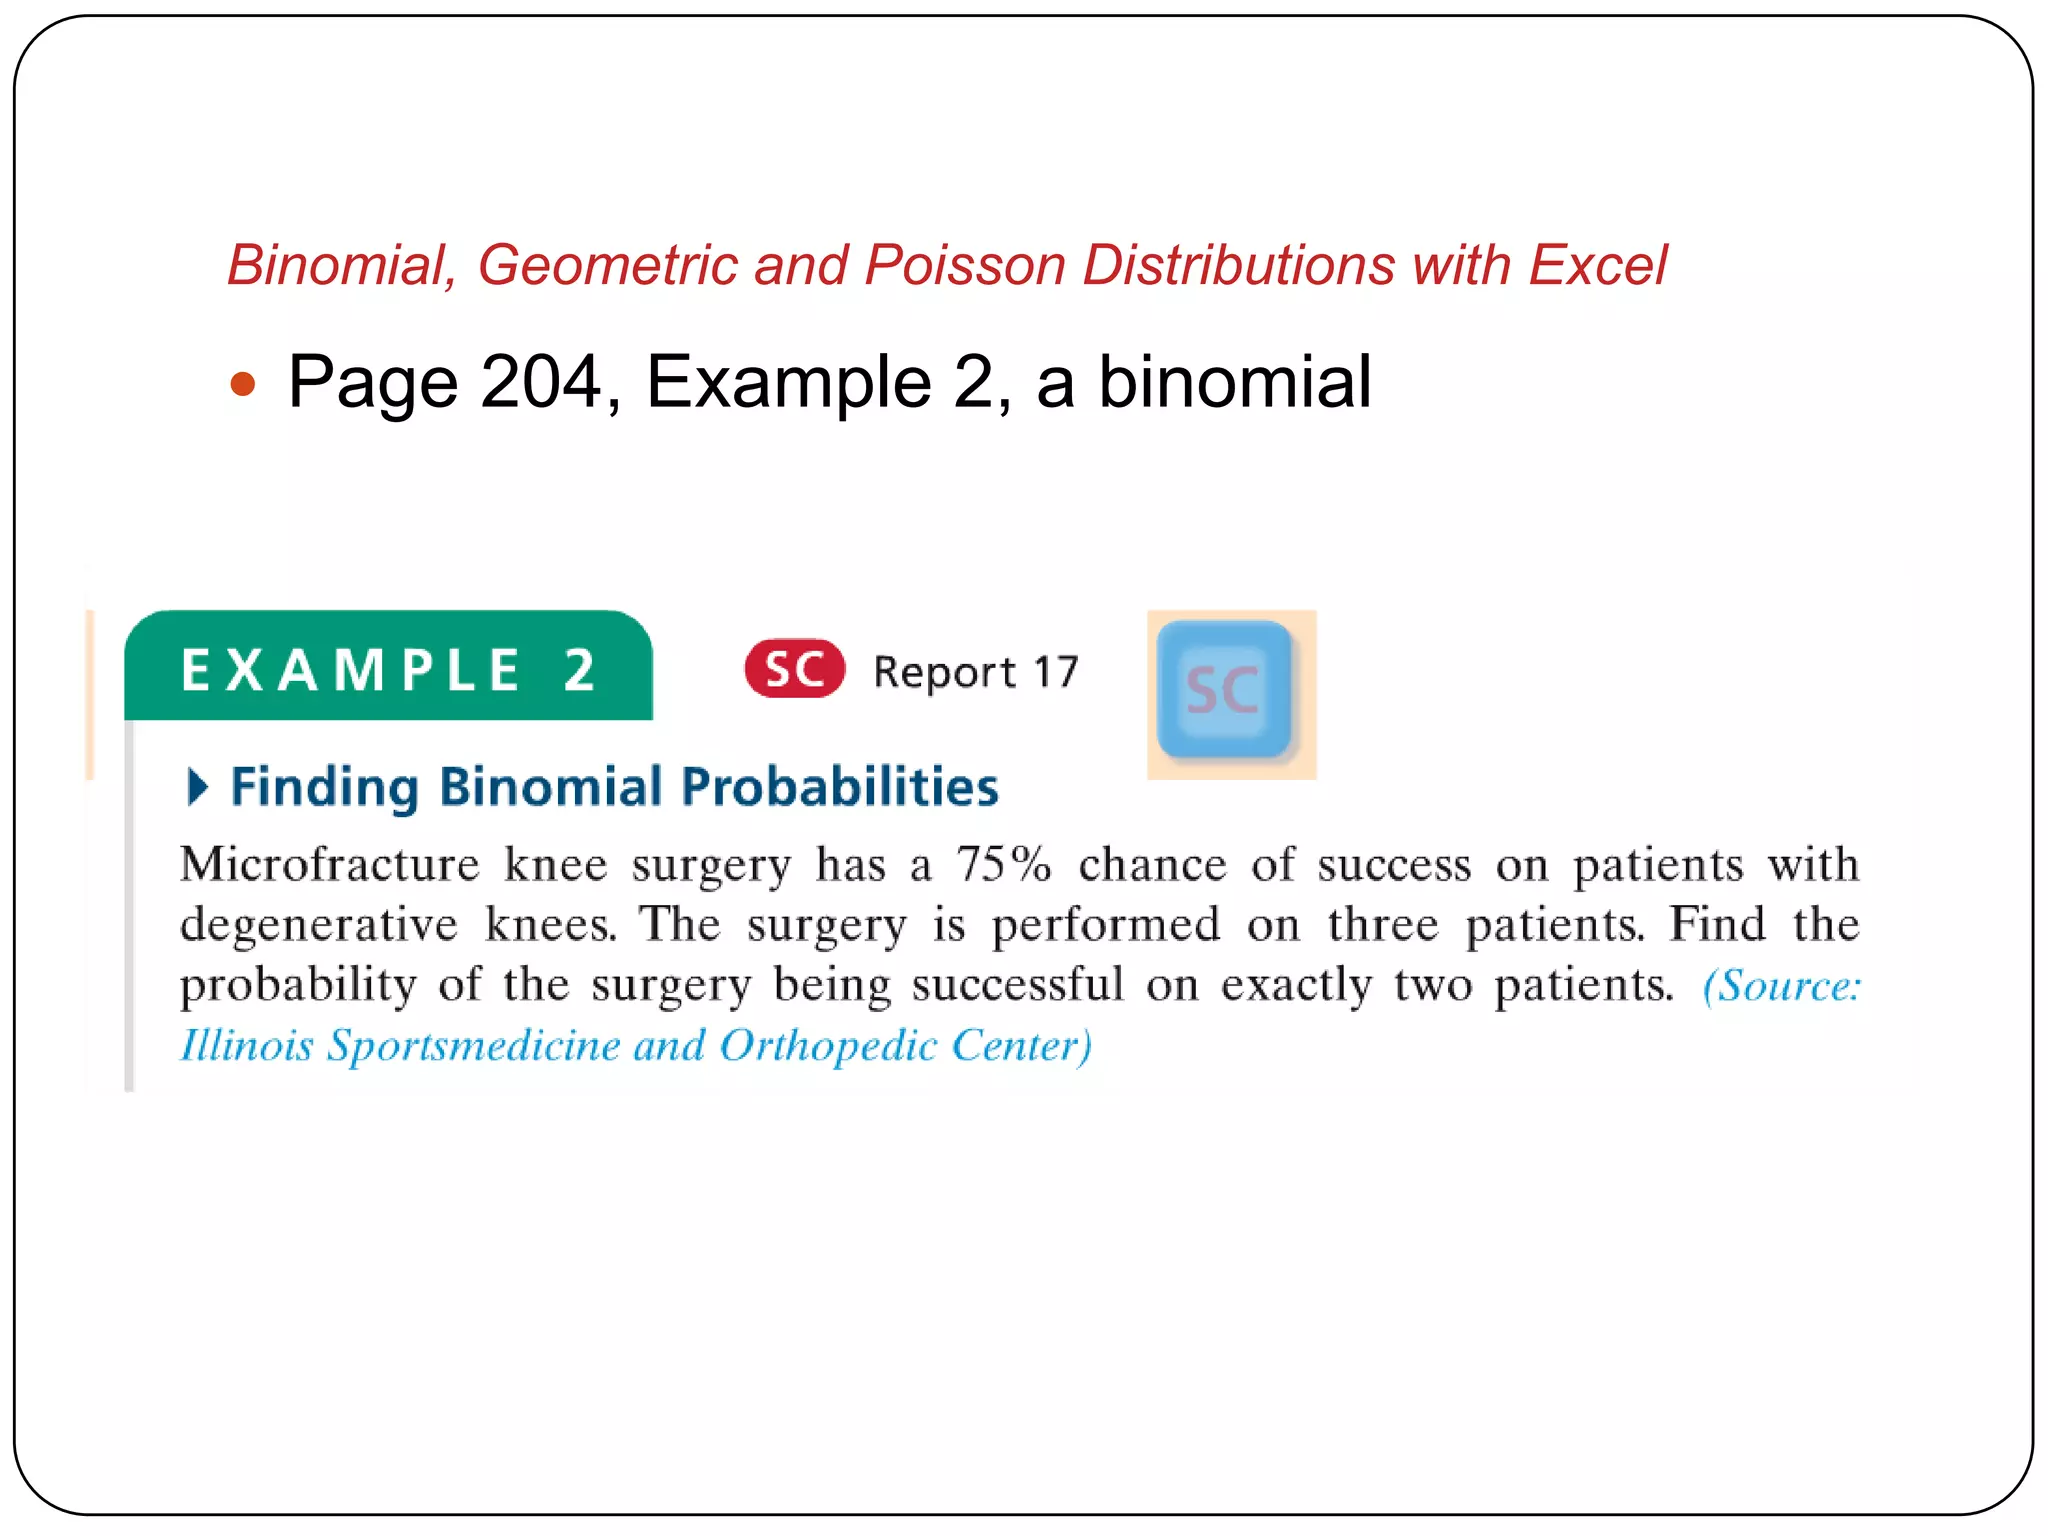
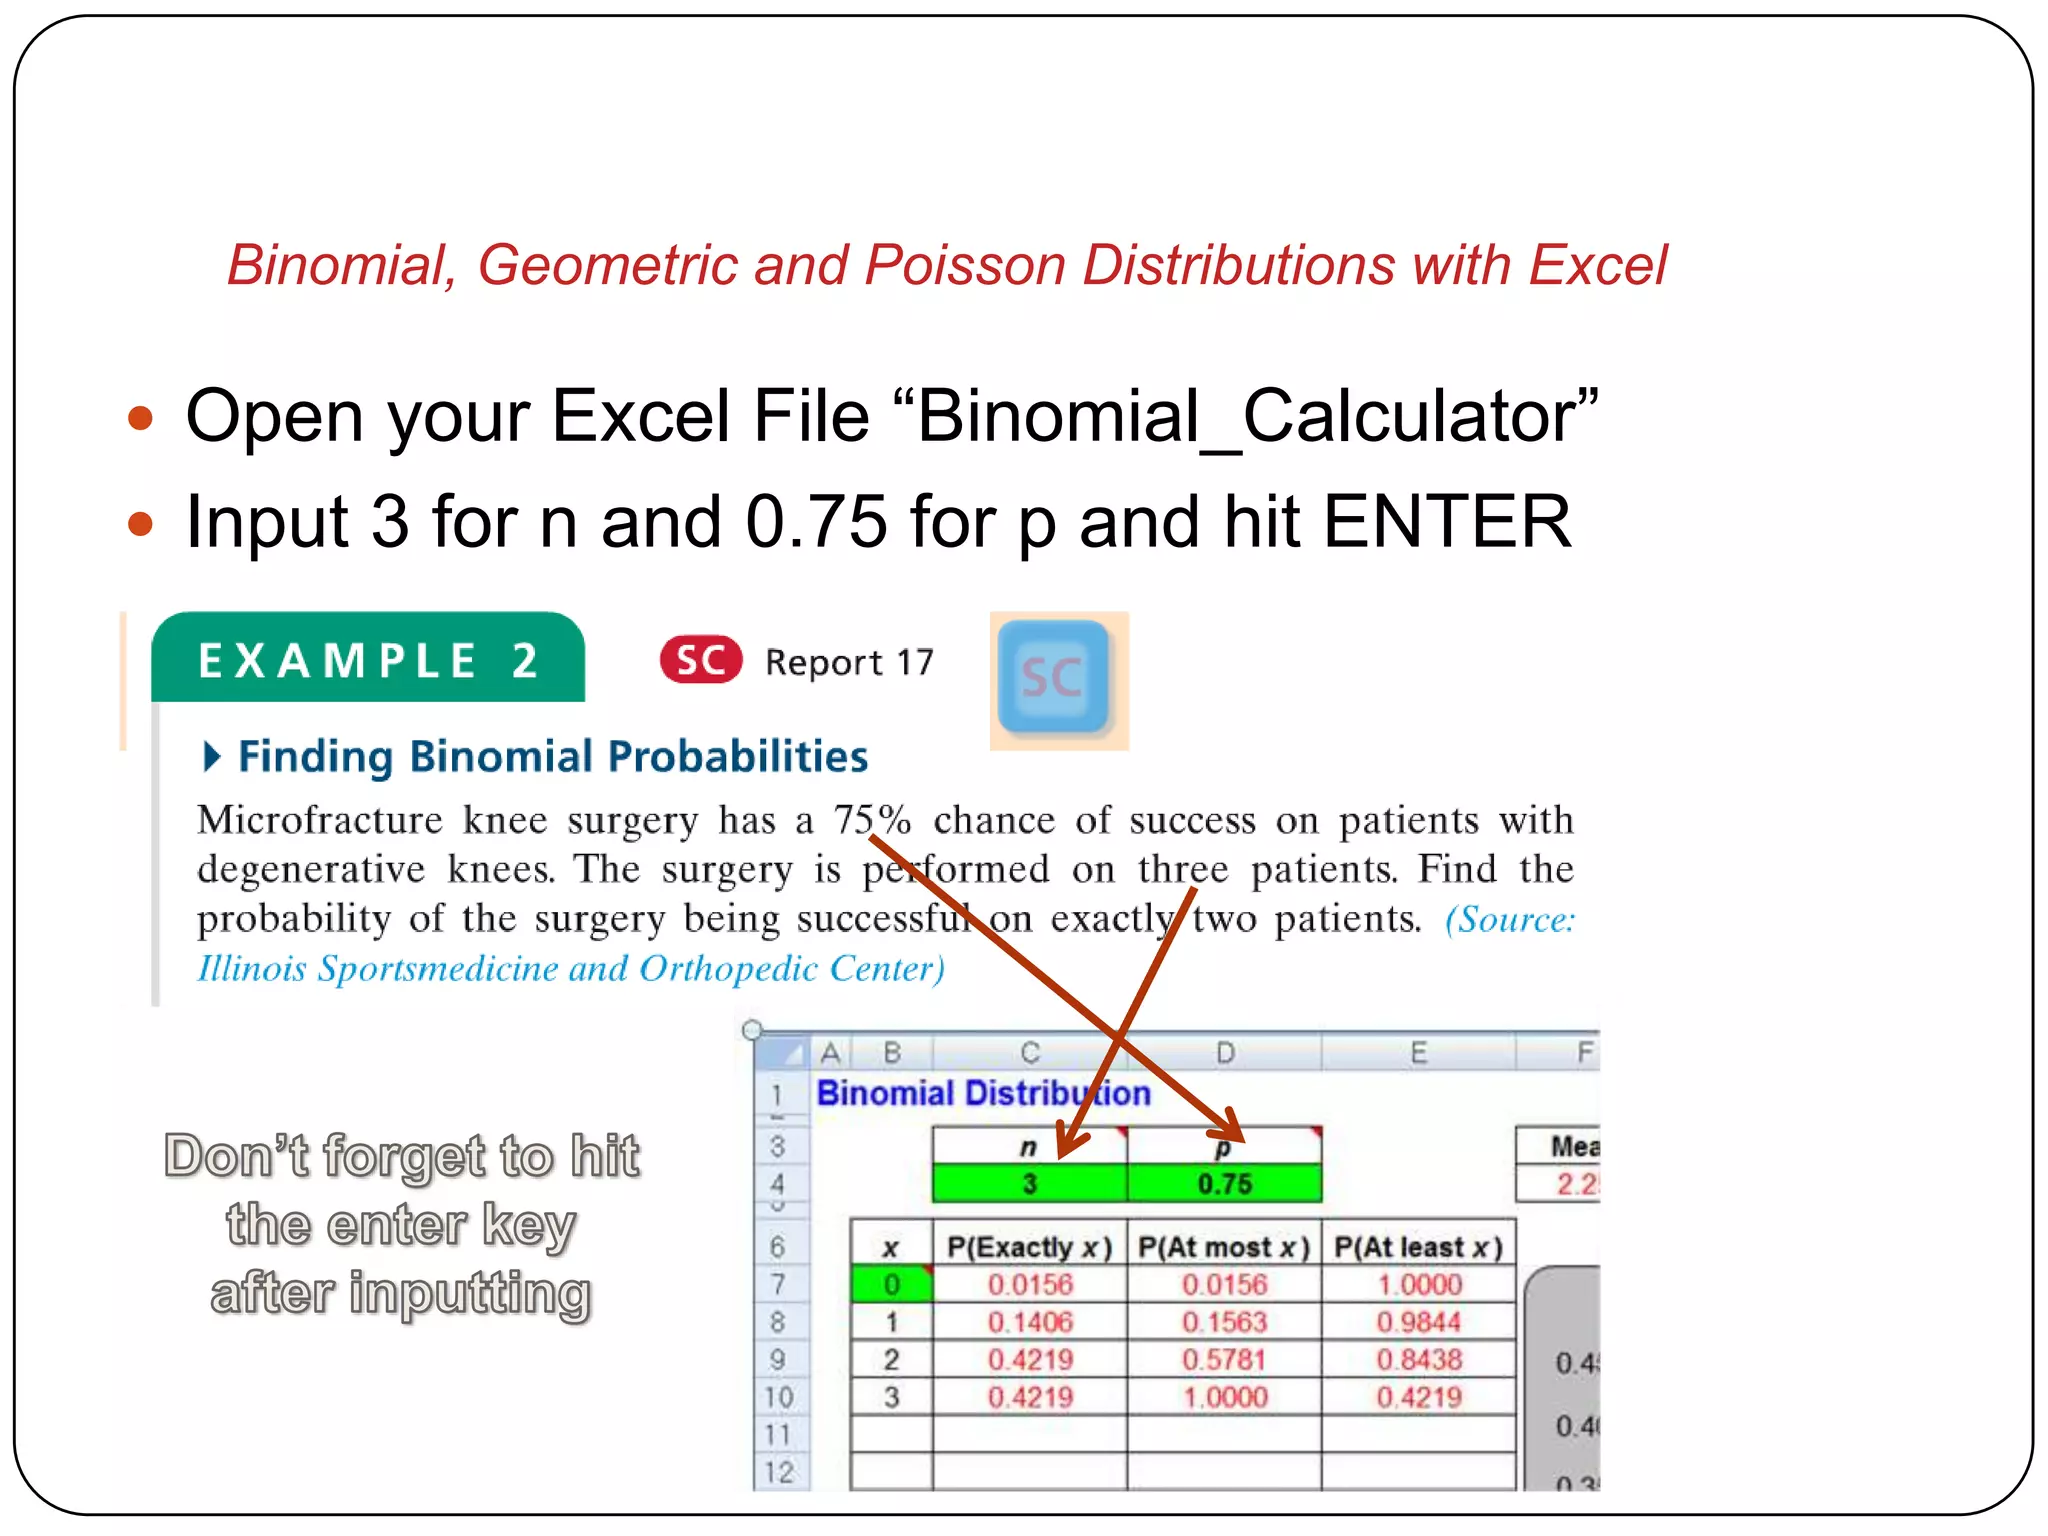
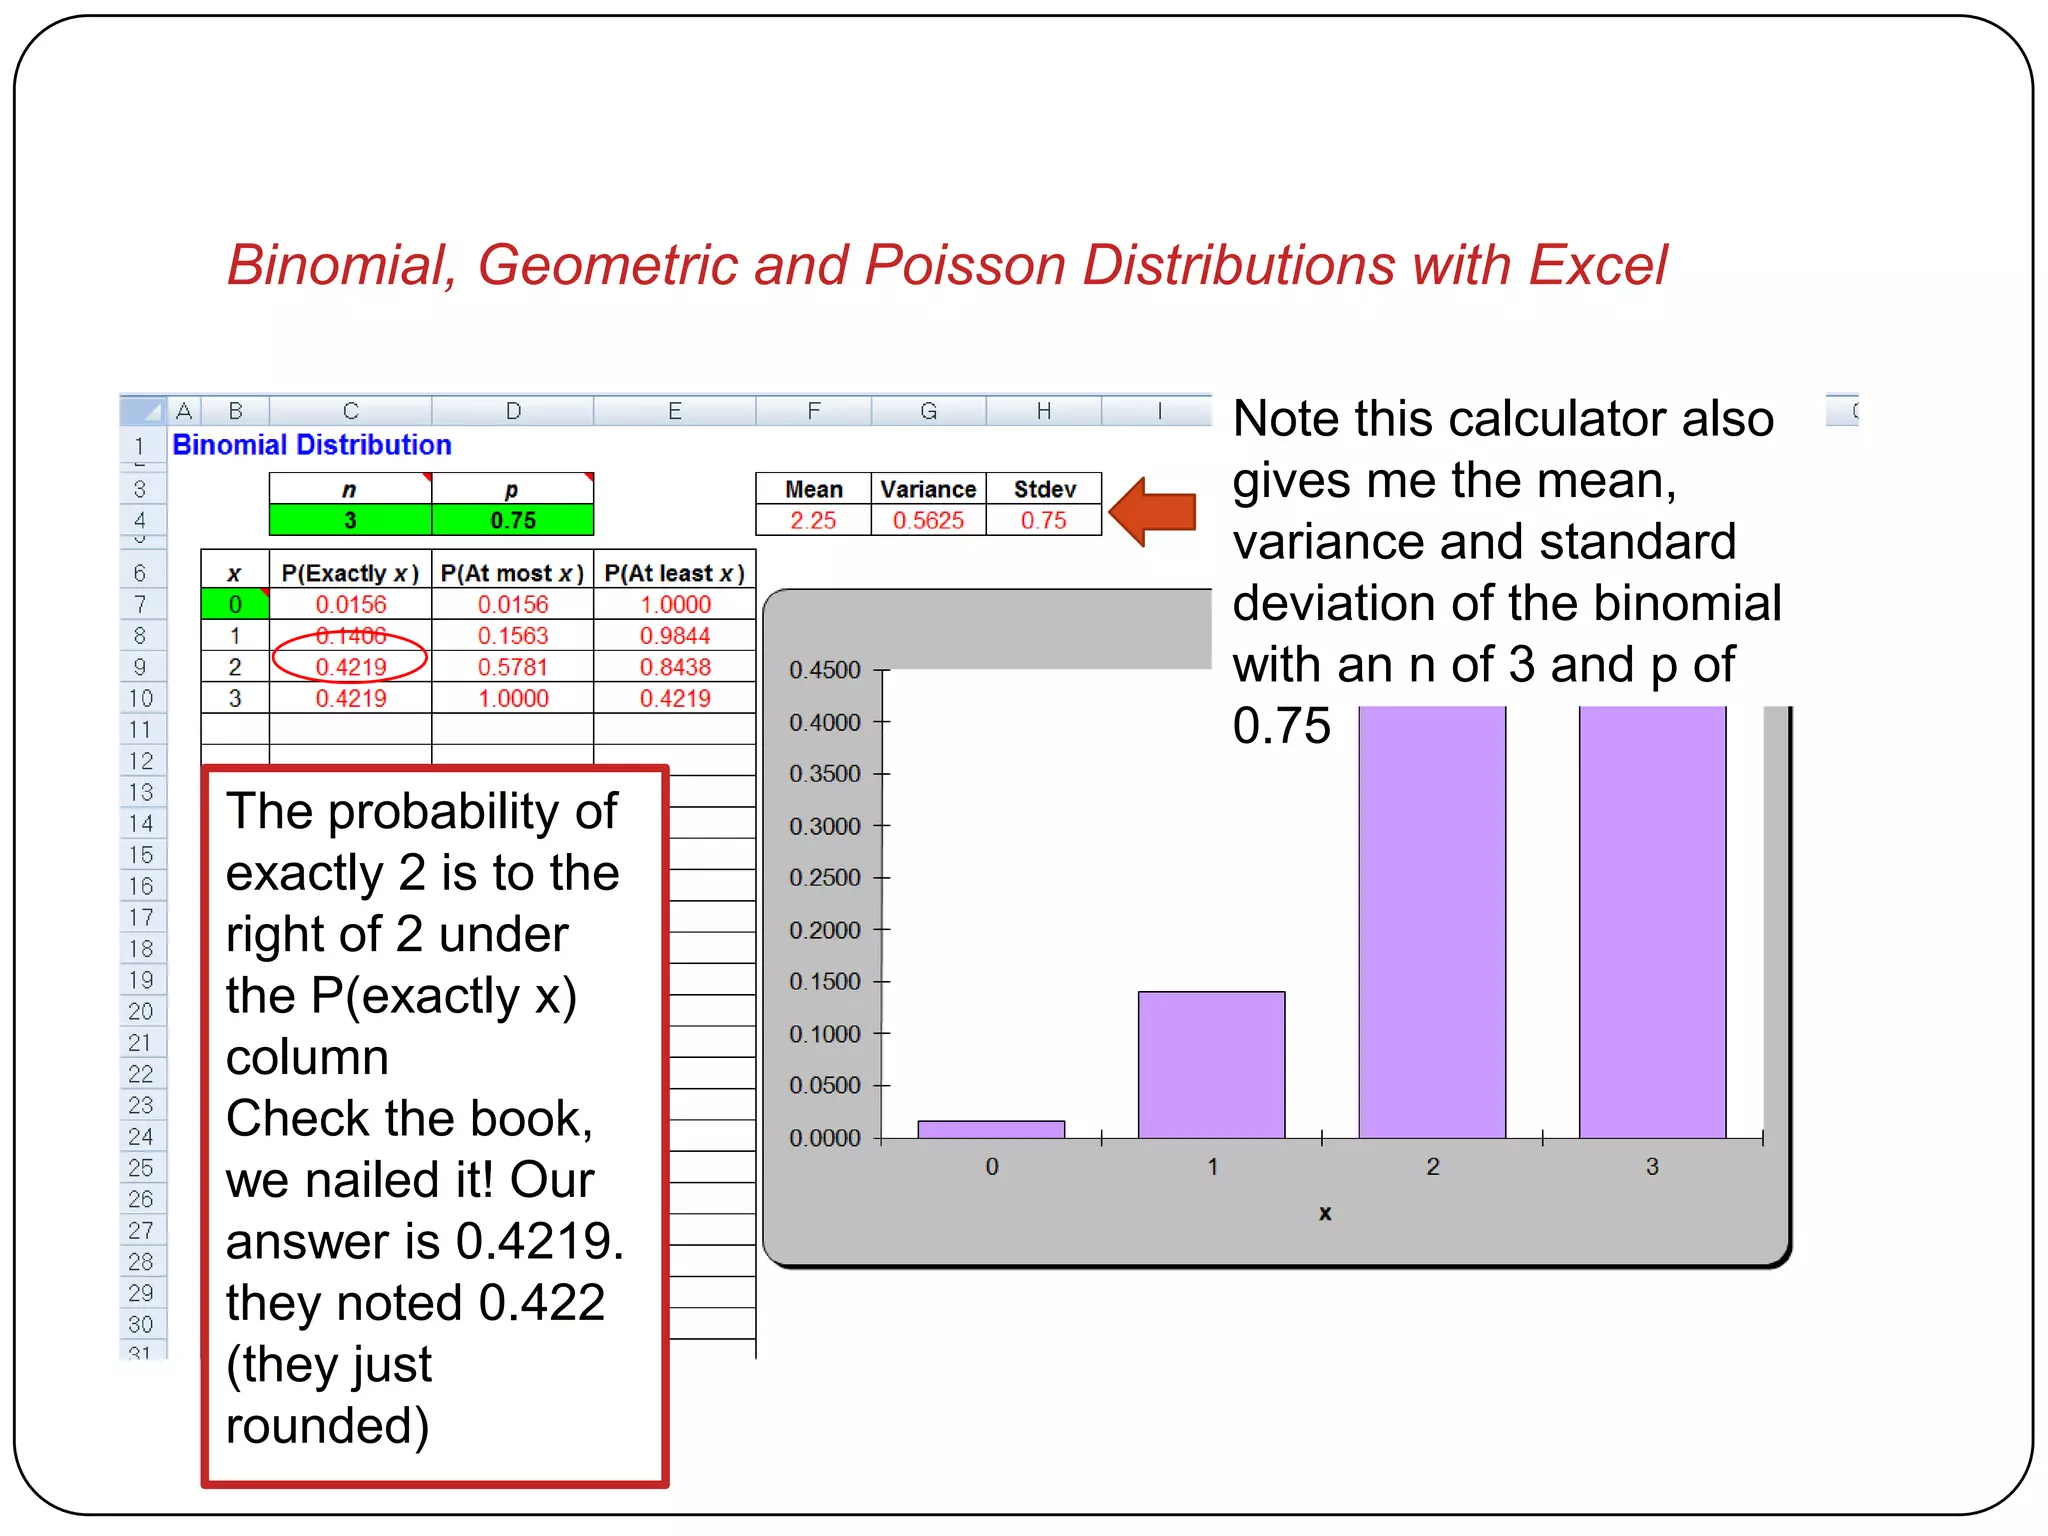
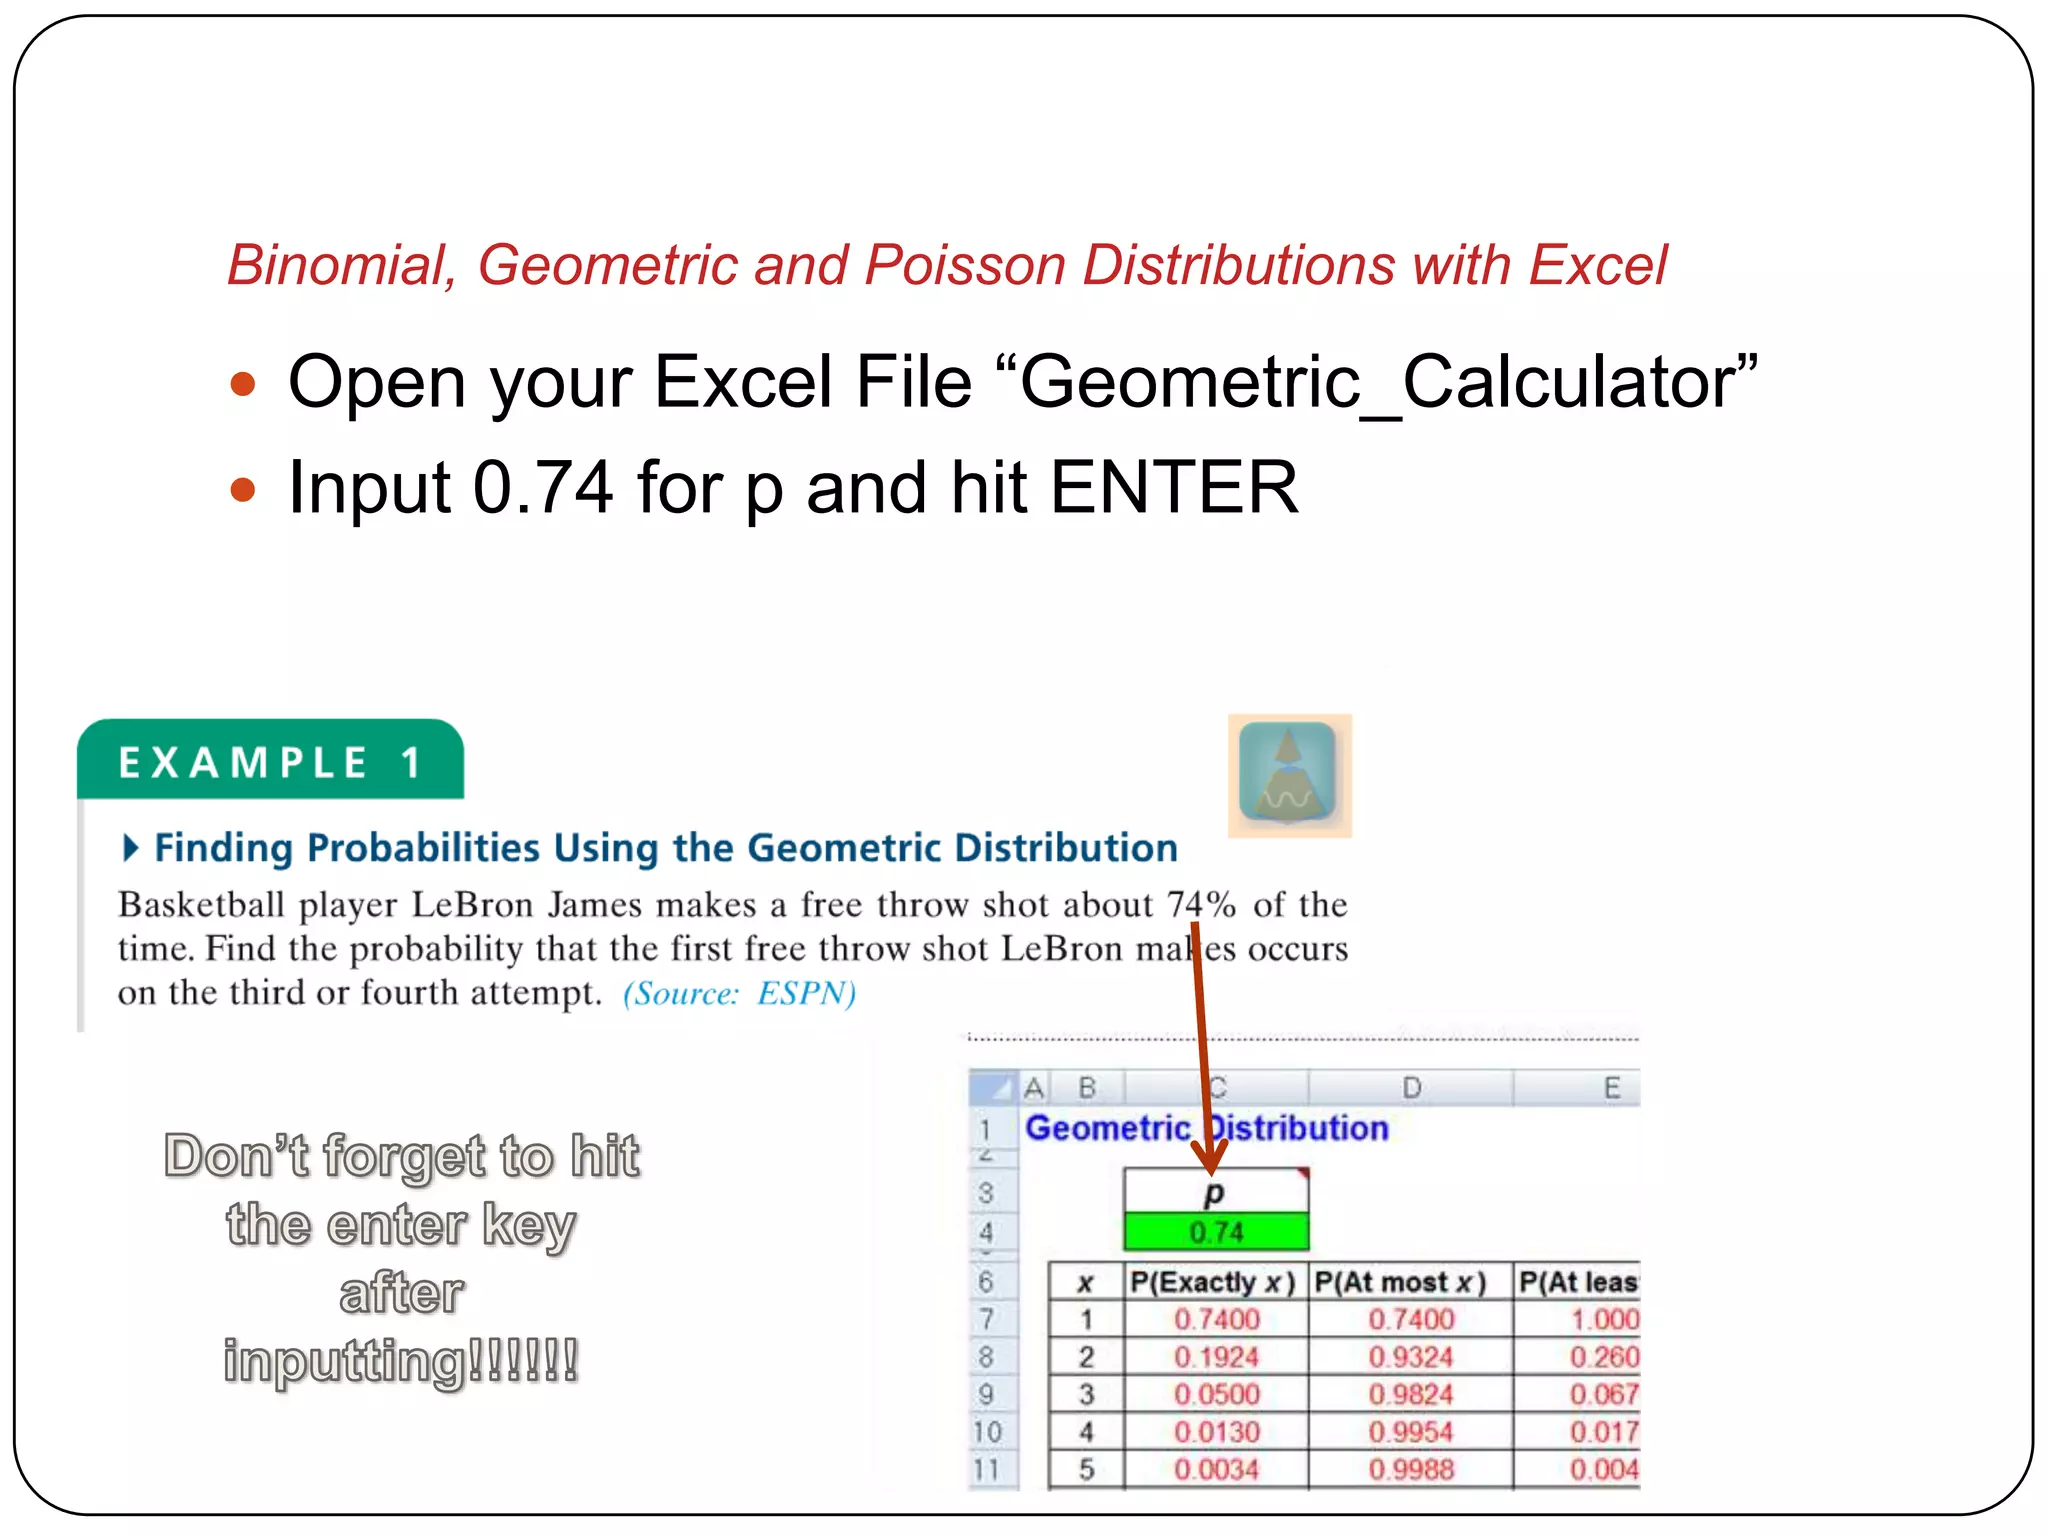
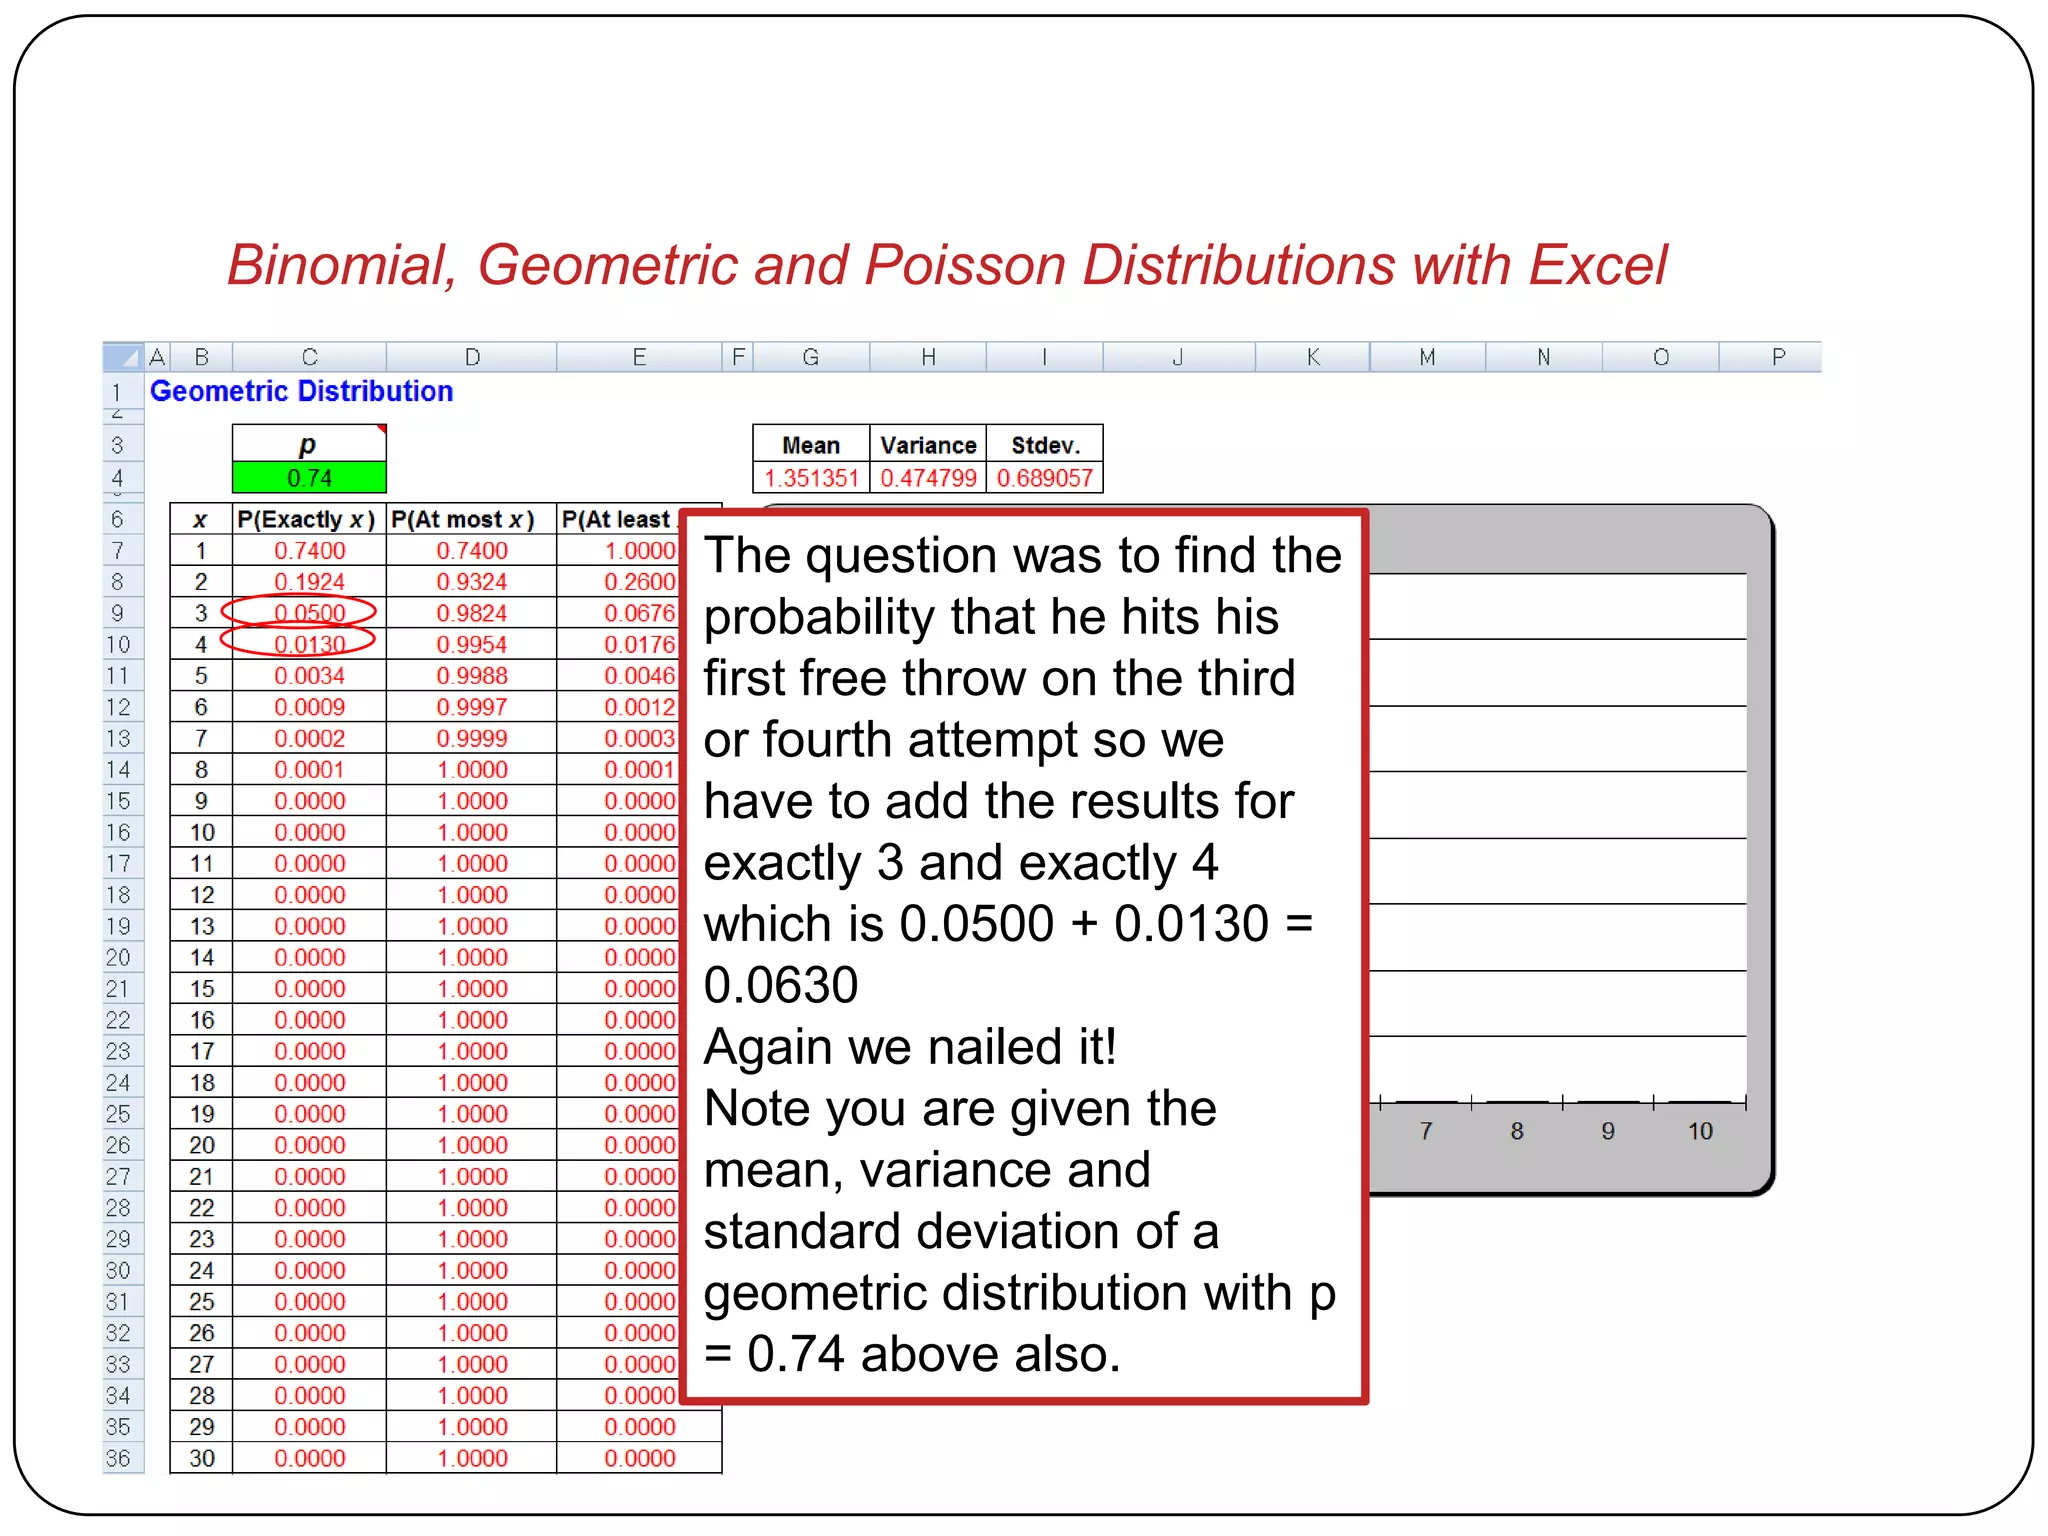
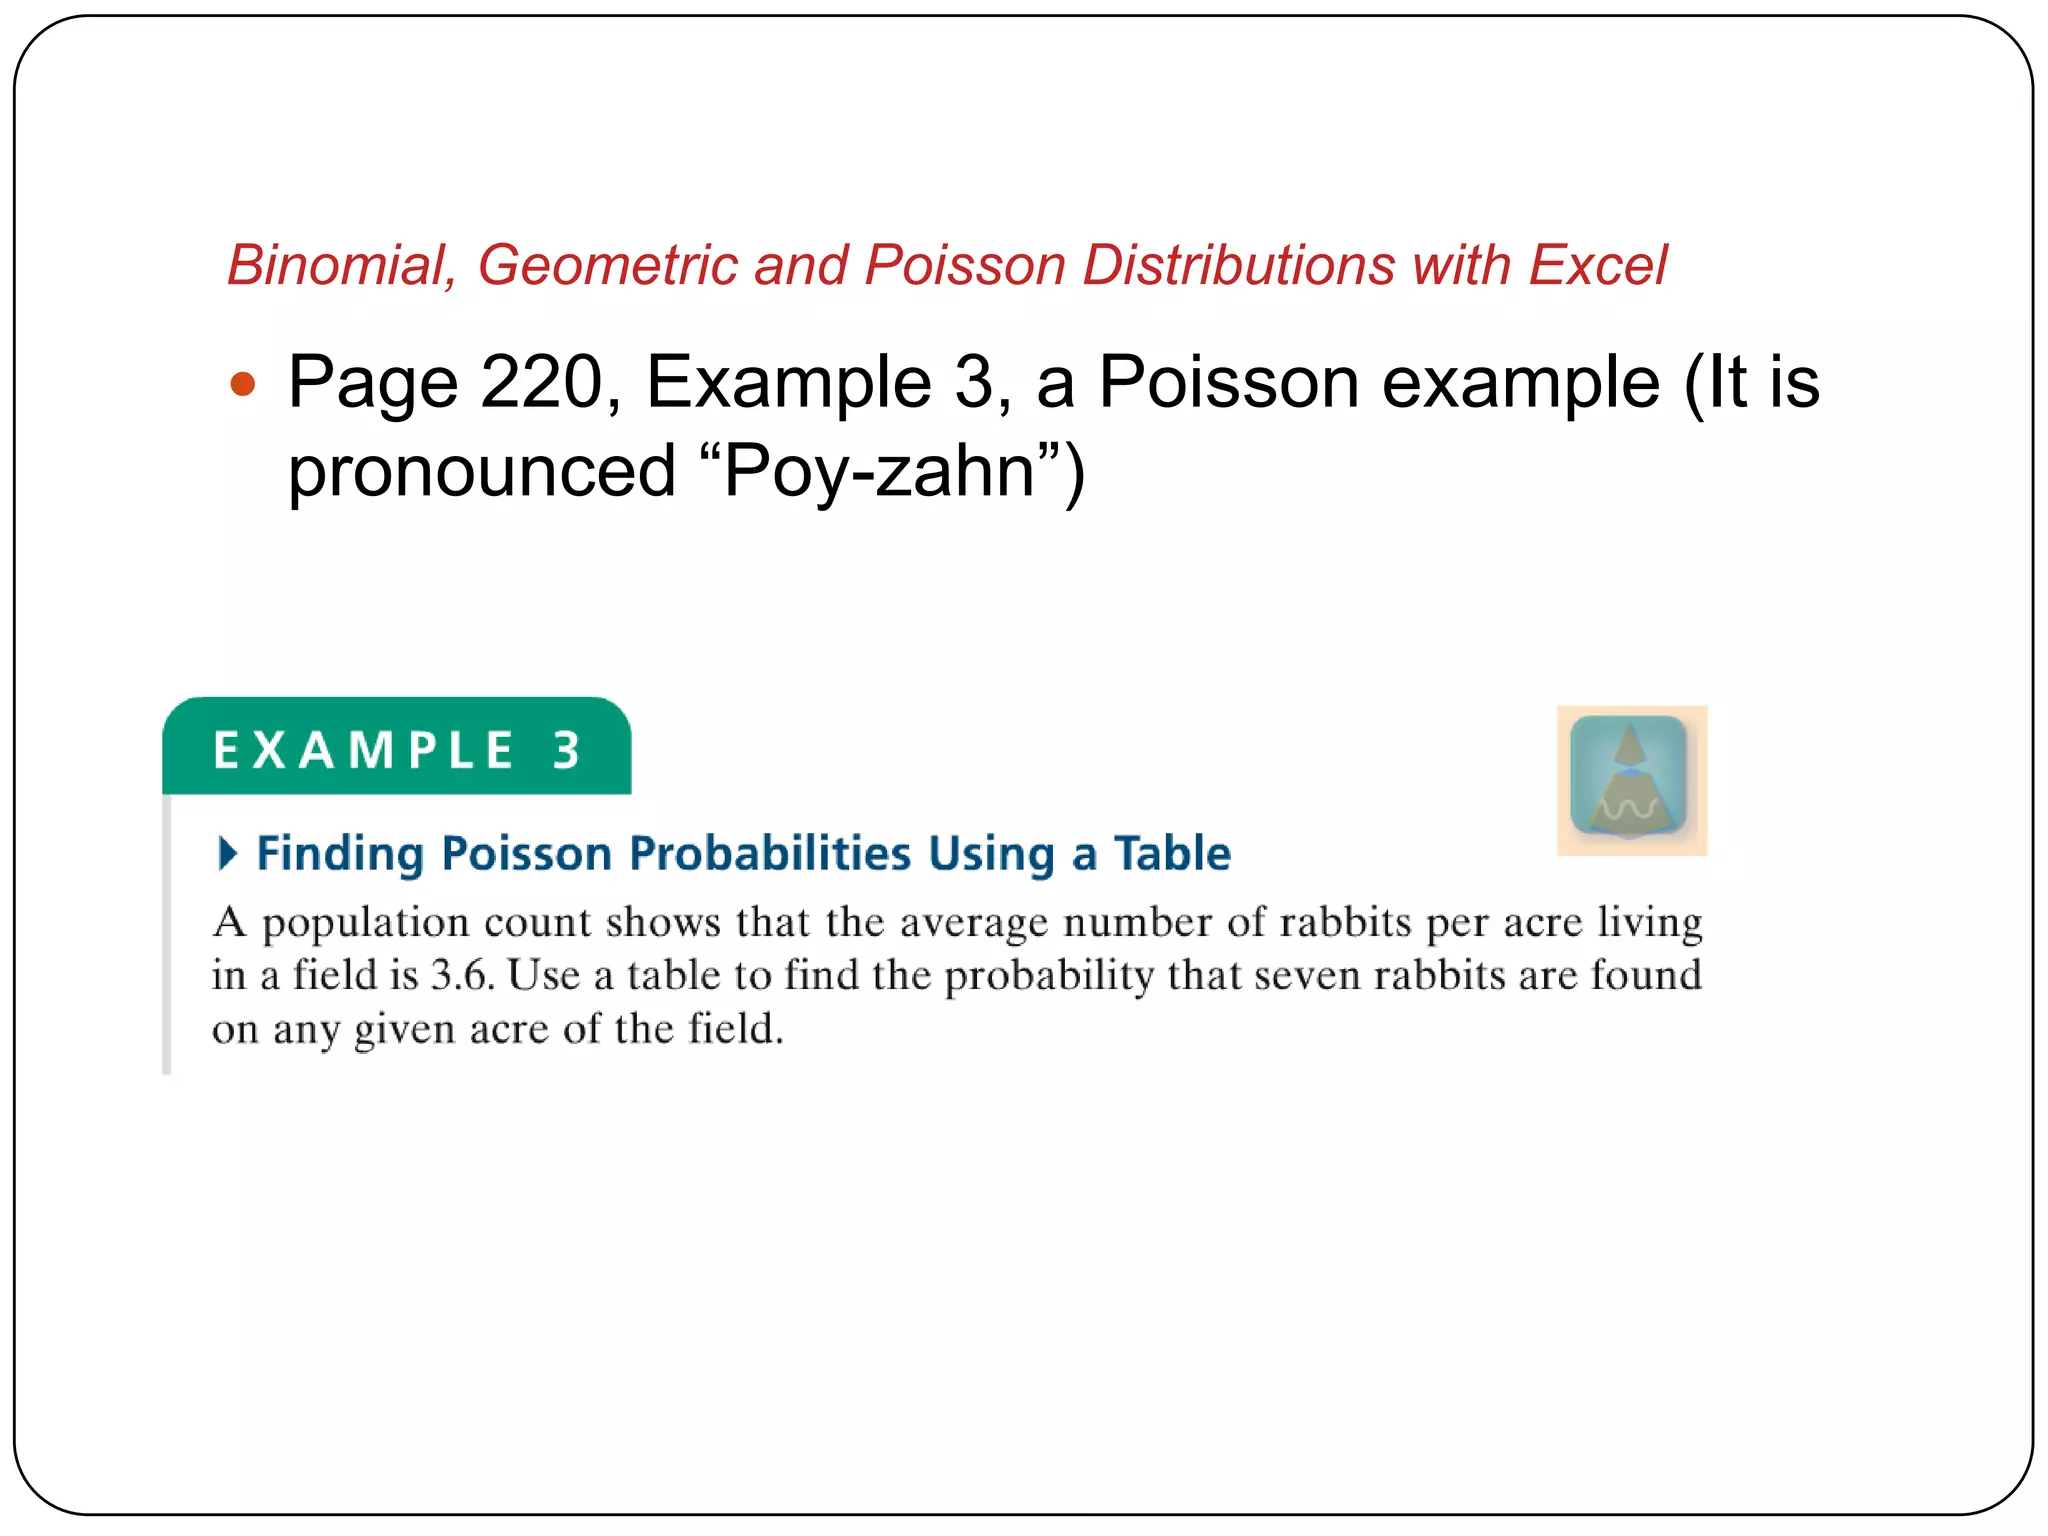
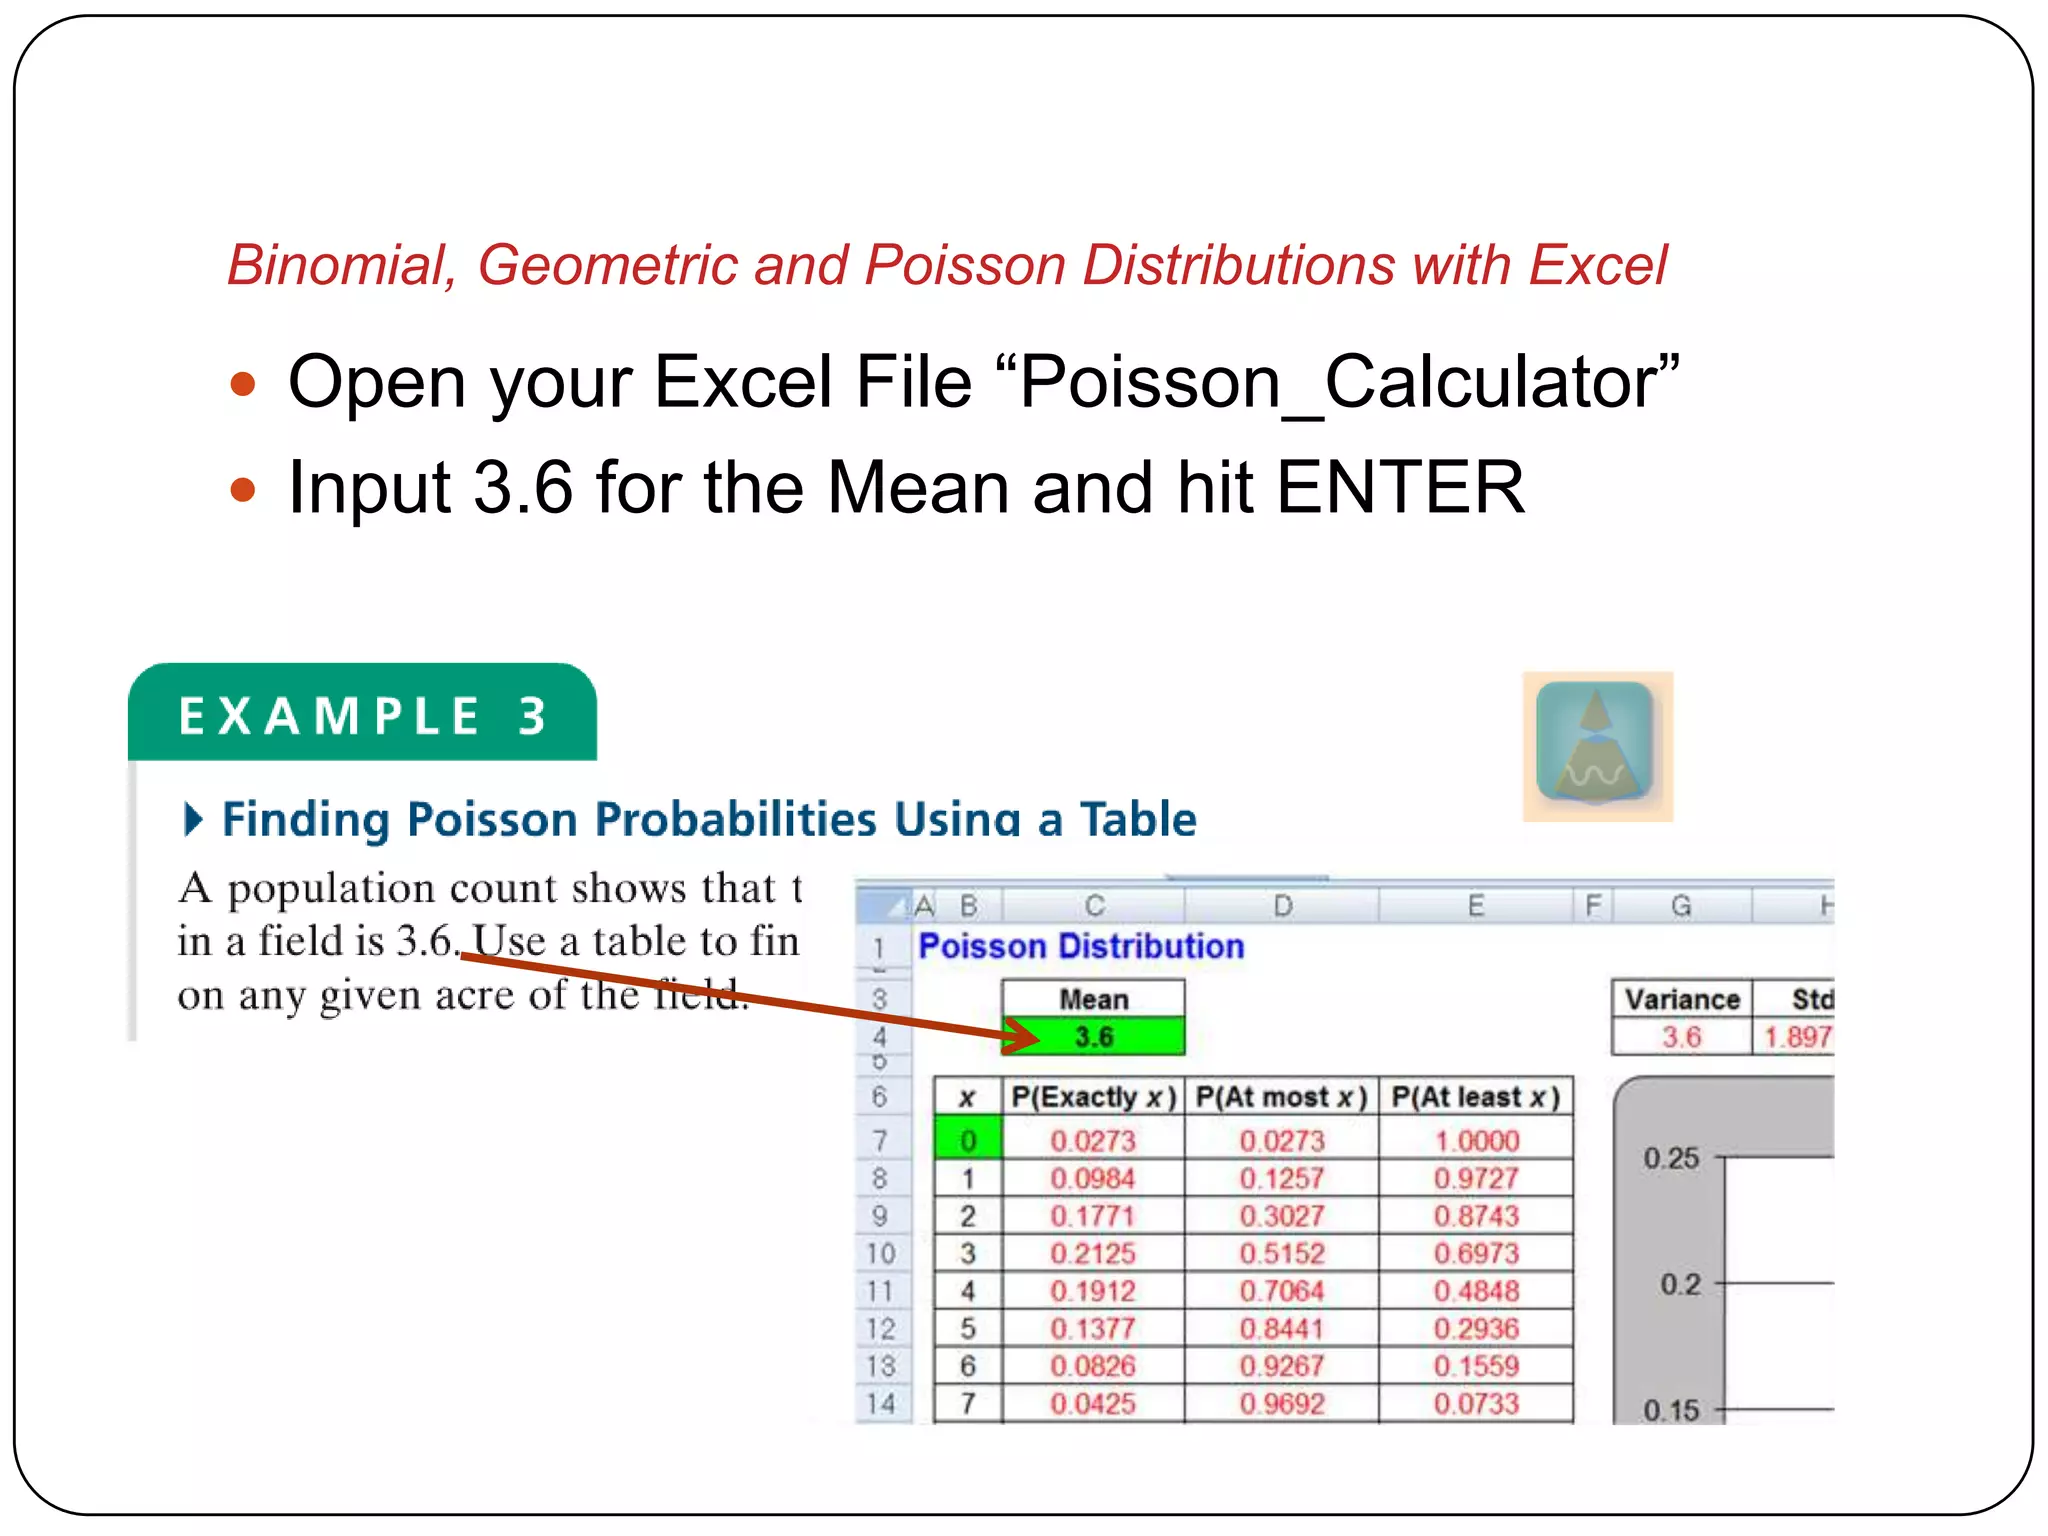
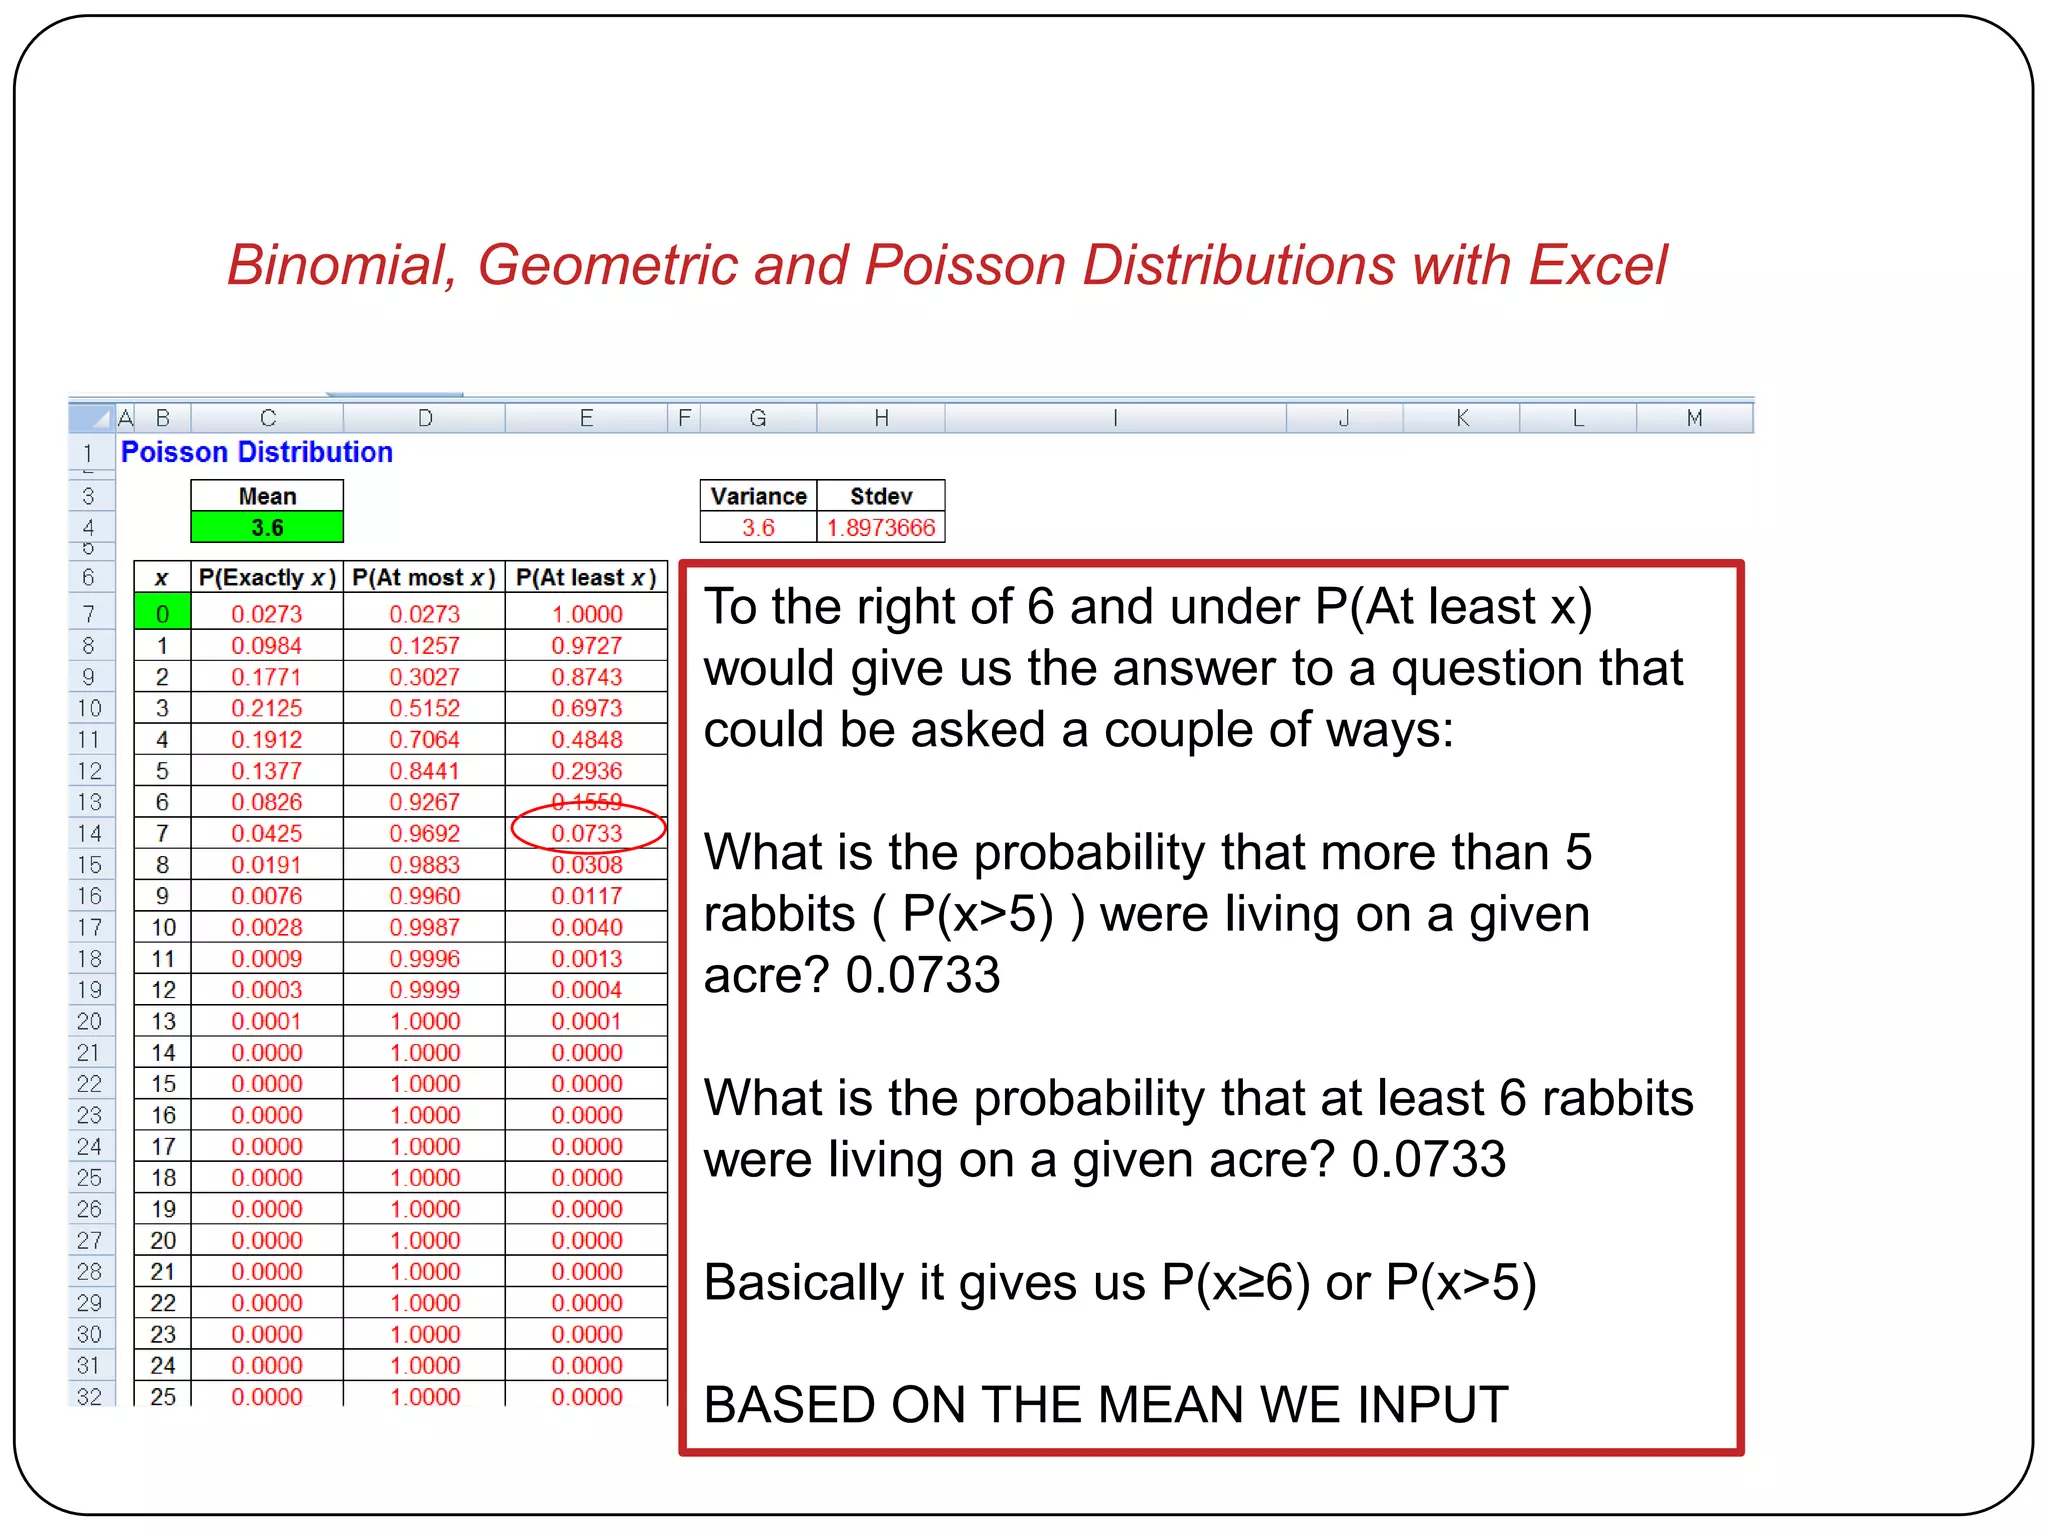

This document provides instructions for downloading and using Excel templates to calculate binomial, geometric, and Poisson distributions. It demonstrates how to access and set up the templates from a website. Examples are worked through for each distribution type to show how values can be input and the relevant probabilities calculated. The templates also automatically provide additional descriptive statistics for the distributions.