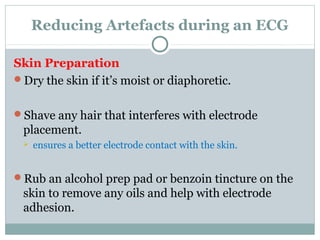
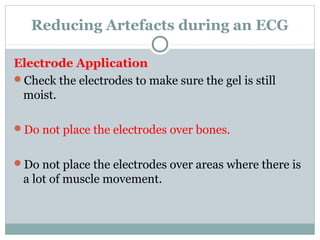
Downloaded 182 times

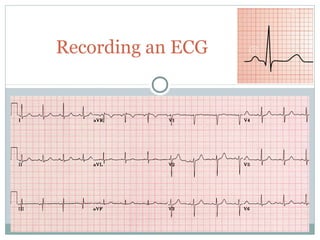
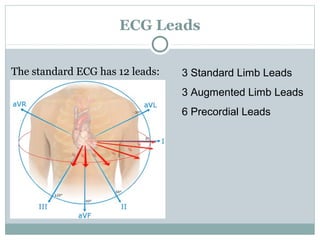
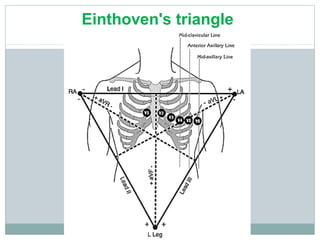
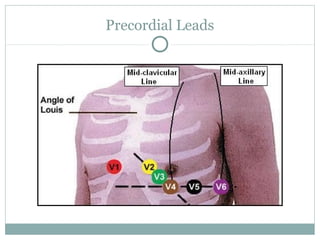
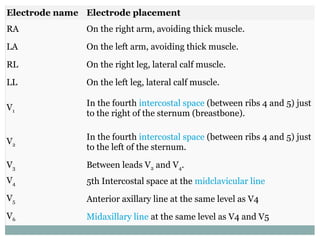
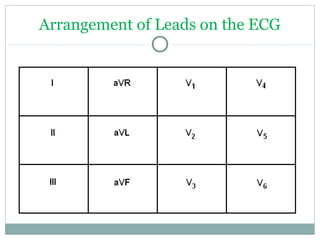
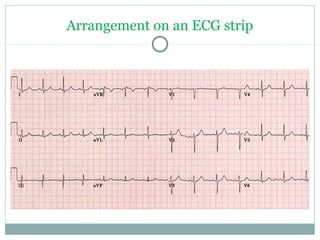
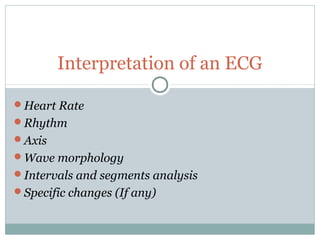
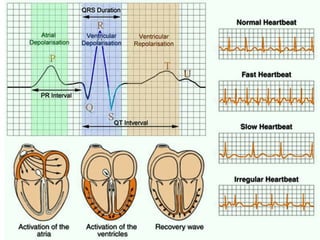
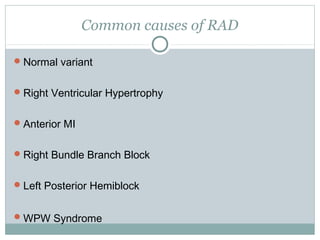
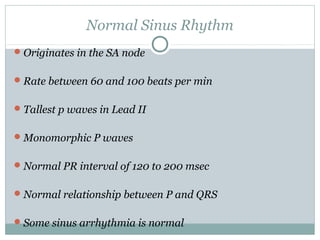
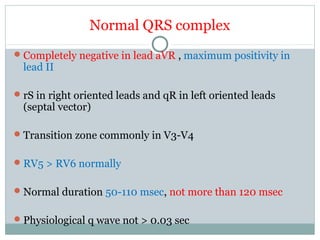
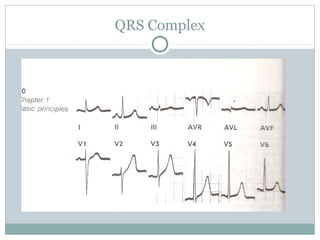
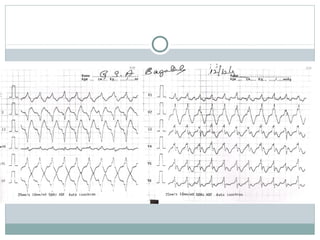


This document provides an overview of electrocardiography (ECG) basics for technicians. It discusses the heart's conduction system and how ECGs work to record electrical activity. The 12 standard ECG leads and their placements are described. Key aspects of normal ECG waveforms and intervals like P waves, QRS complex, T waves, and QT interval are explained. Common abnormalities that can cause changes in axis or abnormal complexes are also summarized. The document concludes with tips on interpreting ECGs and the important aspects to include in an ECG report.


![PERI-PROSTHETIC FRACTURE NAIL-PLATE CONSTRUCT [NPC].pptx](https://cdn.slidesharecdn.com/ss_thumbnails/drarunkumardrmohamedashrafperiprostheticfrasturenail-plateconstructnpc-260209164459-7e9d15a1-thumbnail.jpg?width=640&height=640&fit=bounds)


![ONFH[AVN HIP] -TRIPLE REGIME -A NOVAL SURGICAL CONCEPT .pptx](https://cdn.slidesharecdn.com/ss_thumbnails/onfhavnhip2026koaconcalicutdrgokuldevdrmashraf-260210064517-213ec005-thumbnail.jpg?width=640&height=640&fit=bounds)


![CTEV [ clubfoot] DR ARUN LAL ,DR MOHAMED ASHRAF travancore medical college k...](https://cdn.slidesharecdn.com/ss_thumbnails/ctevclubfootdrarunlaldrmohamedashraftravancoremedicalcollegekollamkeralaindia-260208063247-18fc466c-thumbnail.jpg?width=640&height=640&fit=bounds)


