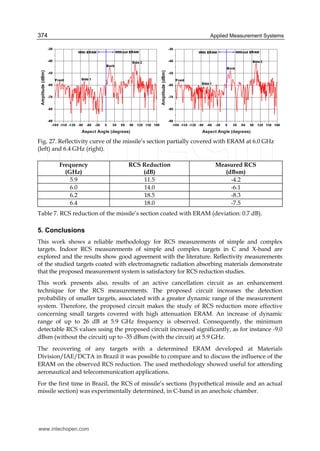
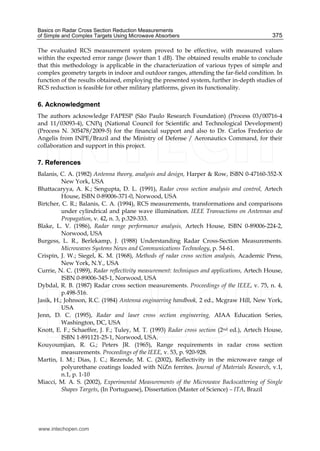
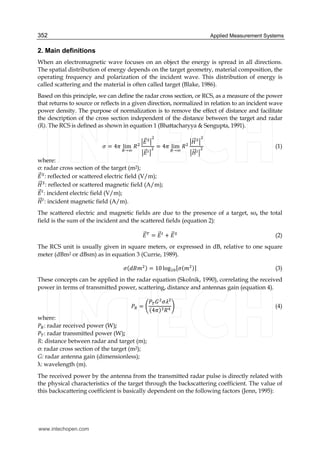
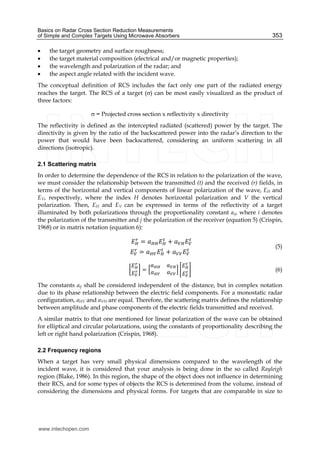
16
Basics on Radar Cross Section Reduction
Measurements of Simple and Complex Targets
Using Microwave Absorbers
Marcelo A. S. Miacci1 and Mirabel C. Rezende2
1National Institute for Space Research (INPE),
2Institute of Aeronautics and Space, Department of Aerospace Science and Technology,
Brazil
1. Introduction
The research of Radar Cross Section (RCS) of simple and complex objects is decisively
important to identify targets such as aircraft, missiles, rockets, ships and other objects, with
the purpose of improving or rendering difficult their radar visibility in various frequency
ranges. The use of RCS measurements of targets have expanded to more than solely military
applications in the identification and control processes of defense systems (Burgess, 1988).
Higher the RCS value is, easier it becomes to detect and identify an object. However, when
these targets present different geometrical forms and different types of electromagnetic
radiation absorber materials (ERAM) on their surfaces, they can become stealthy and
practically invisible to radars at determined frequency ranges.
In order to make target identification more precise, it is indispensable to analyze and
understand the RCS patterns generated by the targets. These patterns represent the
reflection mechanisms in the interaction process of the wave with the target, i.e., the
interaction of the wave with the aspects of the target’s geometry and the material’s physical-
chemical characteristics of its surface (Dybdal, 1987).
RCS measurements aim to determine the equivalent effective area of the target when it is
impinged by a radar wave. In other words, it is the ratio between the electromagnetic
energy irradiated by radar over a target and the energy scattered by it. The scattering
measurements can be performed in monostatic condition, whereby the electromagnetic
waves reflected by the target are measured in the same direction as the emitting source
(radar), or in bistatic condition, when the reflected waves are detected in other directions.
The present work describes experimental studies of RCS measurements of targets with
simple and complex shapes and the RCS reduction by using ERAM in the microwave
frequency range of 5 – 12 GHz (C and X bands). This chapter intends also to give some
highlights about the theory involved and some measurement topics concerning target
reflectivity, calibration techniques, enhancement methods and some experimental results
achieved in this research performed at Materials Division of the Institute of Aeronautics and
Space from Brazil.
www.intechopen.com
Applied Measurement Systems352
2. Main definitions
When an electromagnetic wave focuses on an object the energy is spread in all directions.
The spatial distribution of energy depends on the target geometry, material composition, the
operating frequency and polarization of the incident wave. This distribution of energy is
called scattering and the material is often called target (Blake, 1986).
Based on this principle, we can define the radar cross section, or RCS, as a measure of the power
that returns to source or reflects in a given direction, normalized in relation to an incident wave
power density. The purpose of normalization is to remove the effect of distance and facilitate
the description of the cross section independent of the distance between the target and radar
(R). The RCS is defined as shown in equation 1 (Bhattacharyya & Sengupta, 1991).
4 lim
→
4 lim
→
(1)
where:
σ: radar cross section of the target (m2);
: reflected or scattered electric field (V/m);
: reflected or scattered magnetic field (A/m);
: incident electric field (V/m);
: incident magnetic field (A/m).
The scattered electric and magnetic fields are due to the presence of a target, so, the total
field is the sum of the incident and the scattered fields (equation 2):
(2)
The RCS unit is usually given in square meters, or expressed in dB, relative to one square
meter (dBm2 or dBsm) as in equation 3 (Currie, 1989).
log (3)
These concepts can be applied in the radar equation (Skolnik, 1990), correlating the received
power in terms of transmitted power, scattering, distance and antennas gain (equation 4).
4
(4)
where:
: radar received power (W);
: radar transmitted power (W);
R: distance between radar and target (m);
σ: radar cross section of the target (m2);
G: radar antenna gain (dimensionless);
: wavelength (m).
The received power by the antenna from the transmitted radar pulse is directly related with
the physical characteristics of the target through the backscattering coefficient. The value of
this backscattering coefficient is basically dependent on the following factors (Jenn, 1995):
www.intechopen.com
Basics on Radar Cross Section Reduction Measurements
of Simple and Complex Targets Using Microwave Absorbers 353
 the target geometry and surface roughness;
 the target material composition (electrical and/or magnetic properties);
 the wavelength and polarization of the radar; and
 the aspect angle related with the incident wave.
The conceptual definition of RCS includes the fact only one part of the radiated energy
reaches the target. The RCS of a target () can be most easily visualized as the product of
three factors:
 = Projected cross section x reflectivity x directivity
The reflectivity is defined as the intercepted radiated (scattered) power by the target. The
directivity is given by the ratio of the backscattered power into the radar’s direction to the
power that would have been backscattered, considering an uniform scattering in all
directions (isotropic).
2.1 Scattering matrix
In order to determine the dependence of the RCS in relation to the polarization of the wave,
we must consider the relationship between the transmitted (t) and the received (r) fields, in
terms of the horizontal and vertical components of linear polarization of the wave, EH and
EV, respectively, where the index H denotes horizontal polarization and V the vertical
polarization. Then, EH and EV can be expressed in terms of the reflectivity of a target
illuminated by both polarizations through the proportionality constant aij, where i denotes
the polarization of the transmitter and j the polarization of the receiver (equation 5) (Crispin,
1968) or in matrix notation (equation 6):
(5)
(6)
The constants aij shall be considered independent of the distance, but in complex notation
due to its phase relationship between the electric field components. For a monostatic radar
configuration, aHV and aVH are equal. Therefore, the scattering matrix defines the relationship
between amplitude and phase components of the electric fields transmitted and received.
A similar matrix to that one mentioned for linear polarization of the wave can be obtained
for elliptical and circular polarizations, using the constants of proportionality describing the
left or right hand polarization (Crispin, 1968).
2.2 Frequency regions
When a target has very small physical dimensions compared to the wavelength of the
incident wave, it is considered that your analysis is being done in the so called Rayleigh
region (Blake, 1986). In this region, the shape of the object does not influence in determining
their RCS, and for some types of objects the RCS is determined from the volume, instead of
considering the dimensions and physical forms. For targets that are comparable in size to
www.intechopen.com
Applied Measurement Systems354
the wavelength of incident wave, the RCS varies depending on the frequency and is called
the resonant region or Mie region.
When the dimensions of the target are large compared with the wavelength of incident
wave, the RCS can be determined using the methodology of geometrical optics or by the
method of optical physics, and this region is called the optical region. In the following
sections, the analysis of some RCS targets of simple and complex geometry is shown in the
optical region. Figure 1 is a RCS curve of a sphere as a function of the ratio of the target
radius (a)/ wavelength ( ), normalized in the optical region. The analysis of this figure
shows that there are the distinct regions discussed above. Although it is a perfectly
conducting sphere, this behavior is observed for all types of targets (Currie, 1989;
Bhattacharyya & Sengupta, 1991).
Fig. 1. Normalized RCS of a sphere as a function of ka (where k=2π/ ).
3. Radar cross section reduction measurements
RCS measurements are performed for many reasons; the main one is to verify target
detection limits by a radar system to which it is subjected, verifying conformity of the
practical models, designed by theoretical equations (Kouyoumjian, 1965).
The measurement as a whole is a complex task due to the many factors that may affect these
measurements. Instrumental errors, spurious interferences and reflections are some of
contributions to degrade the quality of the data. These problems are compounded when one
is interested in reducing the RCS of an object, as in this case, the magnitude of these effects
can overshadow the true RCS values.
Many methods have been proposed and used for the measurement of several types of
targets. Depending on the size of the targets and radar frequencies used, RCS measurements
can be performed on outdoor or indoor ranges, in the last condition, inside anechoic
chambers. In measurements, it is important that the radar is illuminated by an
electromagnetic wave which is uniform in phase and amplitude. For practical purposes, the
maximum tolerance for amplitude variation over a target is 0.5 dB, and the phase should not
deviate more than 22.5o. These conditions denote the far-field condition (Balanis, 1982; Jasik
& Johnson, 1984), given by:
(7)
www.intechopen.com
Basics on Radar Cross Section Reduction Measurements
of Simple and Complex Targets Using Microwave Absorbers 355
where:
R is the distance between radar and target;
d is the largest dimension of the target; and
is the wavelength of the radar.
This condition ensures good measurements. Errors produced by the instrumentation should
neither exceed 0.5 dB nor vary in time in order to avoid instability in the measurement of the
RCS patterns. Thus, it is decisive the careful selection of the experimental parameters. In this
case, the dynamic range of the system should be at least 40 dB when measuring targets with
small RCS. Dynamic range values in the order of 60 dB or higher are preferable when RCS
reduction studies are conducted or when absorber materials are used. Another important
factor to be taken into account is the target support structure that should not interfere with
the incident wave, however in practice such condition isn’t always possible.
Analysis of the electromagnetic energy scattering by metallic objects is very important in the
understanding of RCS of targets, in the same way that reflections of dielectric and magnetic
surfaces are important when studying RCS reduction. Within this context, RCS analysis of
targets with simple shapes is fundamental to support the understanding of RCS patterns of
targets with complex shapes.
To evaluate the electromagnetic behavior of targets, many methods have been proposed and
experimentally used for many decades with well accepted results (Birtcher & Balanis, 1994)
and the RCS measurement errors depend on the nature of the target under test, the distance
at which this target is being measured and the place of measurements.
Systems are projected in such way that respect the parameters described above. However,
they present technical challenges, making adequate the use of experimental procedures that
involve new techniques that can minimize errors. When an anechoic chamber is used, the
emissions and reflections of spurious radiation are controlled and minimized by using
commercial off the shelf ERAM inside the chamber, becoming the background noise levels
of this radiation almost null. On the other hand, by using the outdoor range, the
measurements are affected by environment variations, therefore needing greater control of
the parameters.
Even in measurements performed in indoor range, the RCS patterns of the targets may
become impaired due to the occurrence of noise in the system or on account of low
backward radiation contribution of the targets with lower RCS.
3.1 Basic instrumentation
The basic instrumentation required for RCS measurements consists of four subsystems that
can be controlled by a central station; these subsystems are: positioners and drivers,
receiver, transmitter and data acquisition system.
Using a simple setup and placing the transmitter (TX) and receiver (RX) antennas in the
scheme showed in Figure 2, it is possible to measure the RCS of targets in different frequency
ranges. The distance between both antennas needs to be tested to eliminate the radiation
coupling between them.
In order to have good precision, the transmitter must have means to provide enough power
to allow a good signal/noise ratio for the measurement system and it is necessary to take
www.intechopen.com
Applied Measurement Systems356
Fig. 2. RCS measurement setup (R is the distance between the antennas and the target).
care with the alignment between the transmission/reception antennas and the target. The
use of a laser beam helps in the alignment of the system improving the precision of the
measurements. The support column for the target, called as pylon, needs to be recovered
with ERAM in order to avoid any possible contribution of reflected waves that prejudices
the target characterization.
Figure 3 shows a system used in this study that basically consists of two antennas, one
transmitter and one receiver mounted on a tower keeping a certain distance from each other.
The target is mounted on a dielectric support and this one is mounted on a positioner which
will allow recording the RCS patterns. The transmission is made through a microwave
generator that feeds, by a low loss coaxial cable, the antenna input terminals. A spectrum
analyzer can be used as a receiver that collects the signals from the receiving antenna. The
system has a positioner controller (driver) that controls the rotational speed, azimuth angle
and limits. Some equipment is in a control room, where the user monitors the tests through
a computer with a GPIB interface.
Figure 3 shows the system composed by:
a. Target under test (square flat plate with 0.2 m side);
b. Pyramidal microwave absorbers;
c. Horn antennas to the 8.2 – 12.4 GHz frequency range;
d. Low loss coaxial cables; and
e. Microwave generator.
Fig. 3. Anechoic chamber view assembled with the RCS measurement system (courtesy of
IFI/DCTA, Brazil).
www.intechopen.com
Basics on Radar Cross Section Reduction Measurements
of Simple and Complex Targets Using Microwave Absorbers 357
Figure 4 shows the internal view of the control room (shelter), which is integrated with the
instrumentation located inside the anechoic chamber. This figure shows: (a) antenna
positioner controllers; (b) spectrum analyzer (receiver) and (c) computer.
Fig. 4. Internal view of the control room (courtesy of IFI/DCTA, Brazil).
3.2 Amplitude calibration methods
There are two main methods for calibration of systems for RCS measurements: direct and
indirect calibrations. The direct calibration involves the use of reference targets with well
known values of RCS, such as spheres, flat plates, dihedrals and dielectric lens. The RCS of
these targets can be accurately inferred by its physical sizes, to provide a radar return signal
that can be compared to the signal of a target under test with unknown value of RCS. In
some cases, the reference target may be in a different position relative to the target under
test and a modified form of the radar equation is used to estimate the difference, as seen in
equation 8:
(8)
where:
: RCS of the target under test (m2);
Pr: received power ratio between the reference target and target under test (dimensionless);
Ru: distance between target under test and radar (m);
Rr: distance between reference target and radar (m);
Fu: propagation factor of the target under test (dimensionless);
Fr: propagation factor of the reference target (dimensionless); and
: RCS of the reference target (m2).
From equation 8, the propagation factors Fr and Fu contain information about the conditions
of propagation between the radar and the two targets, including any atmospheric
attenuation, scattering or even any undesired multiple reflection, as ground reflection that
may be present. If the two factors are the same during measurements, equation 8 is reduced
to equation 9:
(9)
www.intechopen.com
Applied Measurement Systems358
The accuracy of this calibration method depends on the accuracy of the RCS reference target
and the assumption that there are no other targets or significant sources of reflection on the
measuring environment and the propagation factor is well known.
The second method of amplitude calibration is known as the indirect calibration method or
closure. This method involves precise measurements of the characteristics of the radar
system or the transmission and reception system by measuring the received power of a
target under test with unknown RCS, and the calculation of RCS is done by using the radar
range equation (equation 10) below:
4
(10)
where:
: RCS of the unknown target (m2);
PR: received power from the unknown target (W);
LT: transmitter losses (dimensionless);
LR: receiver losses (dimensionless);
Ru: distance between radar to unknown target (m);
PT: transmitted power (W);
G: radar antenna’s gain (dimensionless);
: wavelength (m), and
Fu: propagation factor (dimensionless).
For this method is considered accurate, the parameters of the radar should be carefully
measured, the received power must be precisely determined and the propagation factor
should be equal to unity. The errors associated with this technique can occur in the
measurements of radar parameters such as received power and also in conditions where the
propagation factor is not equal to unity. One advantage of the indirect technique is that the
reference target is not required.
3.3 Enhancement measurement techniques (active cancellation)
In order to reduce some error sources present in RCS measurements such as coupling
between antennas, reflections in the anechoic chamber, reflection of target support and poor
dynamic range, it can be used an active noise cancellation circuit which employs a phase
cancelling technique.
A result of works performed at Materials Division/IAE/DCTA in Brazil shows an
experimental set-up developed to reduce the error sources presented in indoor RCS
measurements in C-band (5.8 to 6.4 GHz). By means of this research it was possible to
perform comparisons, with and without the developed system, and observe its influence in
measurements of simple objects.
By proposing the implementation of the system, it is expected to allow detection of small
RCS targets by increasing sensitivity and dynamic range, so the effective study of RCS
reduction can be established. The complete measurement system has a simplified block
diagram shown in Figure 5.
The operation principle of the device is based on the detection of spurious signals and the
application of the principle of phase cancelling, by generating a signal of equal amplitude
www.intechopen.com
Basics on Radar Cross Section Reduction Measurements
of Simple and Complex Targets Using Microwave Absorbers 359
Fig. 5. Block diagram of the measurement system with the active noise cancellation circuit.
and opposite phase. Thus, after operation of the system only the signal of the target under
test is expected to be detected. In this case, errors inherent to the RCS measurement systems
in an indoor or outdoor range are reduced.
In accordance with Figure 5, operation of the developed device consists of a sample of the
signal transmitted by the radar through the directional coupler 1. This signal goes through
an isolator, followed by the modulator that performs phase and amplitude modulation
(with fine tuning provided by the variable attenuator and phase shifter) and are combined
in the directional coupler 2 with the interfering signals. Figure 6 shows the components
used, such as: isolator, attenuator, coupler, filter and etc.
Fig. 6. View of the designed circuit assembled for C-band.
For the evaluation of the system, this circuit was tested by using an anechoic chamber with
dimensions of 9.5 m x 4.5 m x 4.5 m available at IFI/DCTA. For this, two corrugated horn
antennas were installed, with a transmitter and a receiver and a flat plate measuring 0.3 m x
0.3 m was used as a target under test, at frequencies of 5.9, 6.0, 6.2, and 6.4 GHz. Firstly, the
noise level in the chamber was measured with and without the proposed circuit by rotating
the azimuth positioner with no targets mounted on that. Some results are shown in Figure 7
and Table 1 presents the results obtained with the circuit for the frequency range.
www.intechopen.com
Applied Measurement Systems360
Fig. 7. Noise level of the anechoic chamber, with and without the circuit, at 5.9 GHz.
Frequency
(GHz)
Noise level without the
circuit (dBm)
Noise level with the
circuit (dBm)
Reduction (dB)
5.9 -59 -85 26
6.0 -64 -84 20
6.2 -64 -85 21
6.4 -60 -82 22
Table 1. Anechoic chamber noise level reduction in C-band (deviation: 0.7 dB).
It is observed that due to the reflection from the anechoic chamber, added to the coupling
between the antennas, the noise level is relatively high (approximately -59 dBm at 5.9 GHz).
Afterwards, a RCS pattern of the flat plate was measured without the circuit (Figure 8 - left)
and it was observed a considerable deformation of the flat plate RCS pattern that can be
assessed by foreseen results in literature (Ross, 1966) and experimental measurements
(Miacci, 2002). After the circuit’s operation, where the interfering signals were reduced, a
new RCS pattern of the flat plate was measured and it can be observed as being closer than
expected, as seen in Figure 8 (right).
Fig. 8. RCS measurements of the flat plate (0.3 m x 0.3 m) without the circuit (left) and with
the circuit (right) at 6.0 GHz.
www.intechopen.com
Basics on Radar Cross Section Reduction Measurements
of Simple and Complex Targets Using Microwave Absorbers 361
This last RCS pattern evidences well defined null points and symmetry with a minimal
contamination from external signals. It is also observed that the circuit does not influence
the maximum peak, hence not interfering in the maximum RCS of the target under test.
Table 2 shows the minimum detectable RCS values and it is shown the increase of the
probability of detection of smaller targets, associated to a higher dynamic range of the
system, consequently, allowing the study of RCS reduction to be more effective when
dealing with targets covered by high attenuation ERAM.
Frequency (GHz)
Detectable RCS without circuit
(dBsm)
Detectable RCS with
circuit (dBsm)
5.9 -09 -35
6.0 -16 -36
6.2 -15 -36
6.4 -11 -33
Table 2. Minimum detectable RCS values with and without the circuit (deviation: 0.7 dB).
The results denote that the RCS measurements performed with the developed and built
circuit improved the RCS patterns with a remarkable reduction of interfering signals in the
frequency range. This consideration takes into account the testing environment being almost
completely free of spurious signals that reduce precision of measurement systems and can
lead to false conclusions in analyses of RCS patterns. These preliminary measurements
support other applications in bigger anechoic chambers or even in outdoor measurements.
4. Reflectivity characteristics of simple and complex shapes targets and RCS
reduction by using ERAM
In this section it will be treated the reflectivity characteristics of simple and complex targets
and discussed the experimental results of the RCS reduction research by using ERAM
developed in Brazil.
4.1 Simple shapes targets
The electromagnetic theory allows the RCS calculation of targets that can be mathematically
well defined, considering its size and physical forms. In practice this statement refers to
objects with simple geometries. The solutions for simple objects are very important for two
reasons, firstly, these objects can be considered as reference targets and they can be
constructed and used as calibration references to measure complex geometry targets;
second, approximations of equations used to determine the RCS of complex geometry
objects can be made by detailed knowledge of the behavior of objects of simple geometries
and their combinations (Miacci, 2002).
Table 3 shows the equations used for the RCS theoretical calculation for some simple
geometry shapes in the optical region (Ruck, 1970; Knott et. al., 1993).
In the next sections is presented some experimental results achieved by the research group
in RCS measurements of targets with simple and complex geometries and its RCS reduction
when applying ERAM.
www.intechopen.com
Applied Measurement Systems362
Geometry RCS (m2)
Flat Plate
4
Sphere
 =  a2
Diedral
8
Cylinder
4
Table 3. RCS of some simple geometries in optical region.
4.1.1 Dielectric lenses (Luneberg reflectors)
In order to validate a RCS measurement setup, firstly, it can be used a certified reference
target called Luneberg reflector. A Luneberg reflector (Figure 9 - left) is a sphere constituted
of dielectric massive shells. Figure 9 (right) depicts a measured RCS pattern of this target
using the setup described in section 3.1, in function of the aspect angles between 0 and 180o
in the frequency of 9.375 GHz.
The maximum power observed in this pattern corresponds to the RCS value of 45 m2,
according to the certified value given by the Luneberg reflector’s manufacturer (Thomson
CSF International Inc.). Using the relationship given by equation 9, it is possible to
determine the RCS values of single targets in the same frequency (9.375 GHz).
The almost constant intensity level of the signal, between the aspect angles of –65 and +65o,
corresponds to the region with the same scattering level of the reflector, being a
characteristic RCS pattern for this target. The obtained RCS pattern shows a good agreement
with that one provided by the manufacturer.
Using these data obtained with the Luneberg reflector it is possible to determine the RCS
value for other single targets based on equation 9.
www.intechopen.com
Basics on Radar Cross Section Reduction Measurements
of Simple and Complex Targets Using Microwave Absorbers 363
Fig. 9. Luneberg reflector positioned in an anechoic chamber (left) and a measured RCS
pattern at 9.375 GHz (right).
4.1.2 Flat plates RCS reduction measurements
The RCS values of a perfect flat rectangular reflector can have its theoretical RCS value
calculated as a function of the incident radiation frequency, according to equation depicted
in Table 3. The RCS reduction method to evaluate a flat plate requires a double face panel,
where one side is used as reflector material (reference) and the other is coated with ERAM.
The panel is fixed on a rotating support, which is positioned in front of the receiving and
transmitting horns according to the setup described in 3.1. The advantage of this
methodology is that it allows the evaluation of the reference and ERAM, by rotating the
device from 0 to 360o, evaluating both sides of the panel, one after the other. Figure 10
shows a simplified scheme of the device used in RCS method. With this method, it is not
necessary to make two separate measurements, because the RCS pattern of the ERAM is
made by rotating the device from 0 to 180o and the reference (metal plate-reflector) is made
from 180 to 360o. Thus, it is a self-calibrating measurement (Knott et al., 1993).
Fig. 10. Device scheme used for the RCS measurements.
The tested ERAM coating was prepared at Materials Division/IAE/DCTA, from Brazil. The
ERAM preparation involved the mixture of 60 % (w/w) of a commercial polyurethane
matrix loaded with 40 % (w/w) of fillers, being carbonyl iron (20 %) and ferrites of MnZn
(10 %), NiZn (5 %) and MgZn (5 %). Physico-chemical characteristics of the fillers and the
polyurethane resin as well as the coating preparation procedures were previously described
www.intechopen.com
Applied Measurement Systems364
(Martin, 2002). The ERAM was applied on the aluminum flat panel of 300 mm x 200 mm
surface by brushing with thickness of 0.7 to 2.0 mm.
RCS measurements were carried out at the frequency of 8 GHz and the panel (300 mm x 200
mm) was fixed on the rotating support (Figure 11) and rotated from 0 to 360o, at a scanning
rate of 0.080 rad/s, characterizing both sides of the panel, i.e., the reference side and the
ERAM painted side. From 0 to -1800 it is scanned the reference side and from 0 to + 1800 the
ERAM coated side.
Fig. 11. Flat plate assembled in an anechoic chamber: metal face (left) and ERAM face (right).
Figure 12 shows the RCS pattern of the reference aluminum plate, obtained at 8 GHz, with a
rotation of 180o. It is observed a peak at 0o corresponding to values of -25.3 dBm (that results
in a RCS value about 32.1 m2 using an appropriate reference target), due to the normal
incidence of the electromagnetic waves on the reference plate. The position of the plate is a
critical point for the success of the measurements, where changes of  8o, for example, can
change the signal intensity for nearly –35 dBm. This abrupt dropping of the signal for angles
different from 0o is due to the flat geometry of the target, scattering the electromagnetic
wave impinged on it in different directions of the receiving antenna.
Fig. 12. RCS pattern of an aluminum plate (300 mm x 200 mm), at 8 GHz.
Afterwards, RCS measurements were carried out with the panel having one side coated by
ERAM. Figure 13 shows the RCS pattern expressed in dBm and in square meters, both
www.intechopen.com
Basics on Radar Cross Section Reduction Measurements
of Simple and Complex Targets Using Microwave Absorbers 365
obtained at 8 GHz. In the range of 0 to -180o it is observed a peak at –900, corresponding to
the normal incidence of the radiation on the reference side of the panel.
(a) (b)
Fig. 13. RCS measurements of the panel (300 mm x 200 mm), at 8 GHz: (a) in dBm and (b) in
m2. Reference side (-180o to 0o) and ERAM coated side (00 to +180o).
The attenuation obtained at the frequency of 8 GHz, presented above, at the incidence angle
of 90o is about 10 dB. The measurements showed clearly that the RCS values decrease when
the ERAM is applied on the flat plate. The processed ERAM coating is able to attenuate
nearly 94 % of the electromagnetic wave, when impinged at 90o, at 8 GHz.
4.1.3 Dihedral and trihedral corner reflectors
Corner reflectors consist in geometries of special interest in electromagnetic scattering
problems because they provide a large bistatic or monostatic radar cross section over a
broad range of observation and aspect angles. The large echoes from these targets arise from
the multiple reflections between two or three mutually orthogonal flat surfaces forming the
reflectors. Dihedral corners have been used by many works in RCS reduction studies and
also as RCS calibration target (reference target). Trihedral corners yield large backscattering
RCS over a wide azimuth and elevation angular ranges and are widely used for external
radar calibration.
Both dihedral and trihedral corners are usually present in mechanical structures of ships,
aircraft and vehicles, contributing as efficient scattering centers of such targets.
Thus RCS reduction of such geometric corner structures is of great importance in the design
and construction of ships and aircraft which will be under surveillance of radar systems. It
has been reported that RCS reduction of dihedral corners can be achieved by altering the
mutual orthogonality of the flat surfaces. This technique involves changes in original
engineering design of the target. Meanwhile, the use of ERAM can also overcome this
problem.
This section shows the results involving the RCS reduction of a square dihedral and
trihedral corner reflectors, coated with ERAM developed at Materials Division/IAE/DCTA.
The characterization was performed using an anechoic chamber in the frequency range of 8
– 12 GHz.
www.intechopen.com
Applied Measurement Systems366
RCS measurements were carried out at the frequencies of 8, 10 e 12 GHz. In each frequency,
the dihedral and the trihedral were fixed on the rotating support and rotated from –90º to
+90º, at a scanning rate of 0.15 rad/s. In this process two pieces were utilized, one as
reference and the other coated with the ERAM (previously described). Figure 14 shows the
assembly of a dihedral inside the anechoic chamber used in this work.
Fig. 14. Assembly of a dihedral on the azimuth positioner.
Figure 15 shows the results at 10 GHz of the reference dihedral (-180o to 0o) and this target
coated with ERAM (0o to +180o). The dihedral RCS pattern is characterized by multiple
reflections of the wave between the orthogonal faces, with two peaks in the aspect angles of
–135o and –45o. These peaks are attributed to the wave normal incidence on the flat side of
the dihedral. It can be observed at 10 GHz (Figure 15) an attenuation of nearly 13.6 dB and
10 dB at -135o and –45o, respectively in the RCS pattern of the ERAM coated dihedral, in
comparison to the reference one. Between +45o and +135o angles it is verified an attenuation
of 20 - 24 dB, attributed to the multiple reflections of the wave between the orthogonal faces
of the dihedral.
Fig. 15. RCS pattern of a dihedral (120 mm x 120 mm), reference side (-180º to 0º), ERAM
coated side (0º to +180º).
Figure 16 depicts the results at 8 GHz of both, the reference trihedral (-180o to 0o) and the
ERAM coated one (0o to +180o). The trihedral RCS pattern is characterized by multiple
reflections of the wave among the three faces. In a similar way, the resulted RCS pattern is
similar to that one verified for dihedrals. At 8 GHz, the RCS pattern shows a reduction of 17
dB for the ERAM coated trihedral in comparison to the reference one, between the aspect
angles of +45o and +135o. However, in the angle range of +135o to +180o and 0o to 45o is
observed a signal increase related to the reference trihedral.
www.intechopen.com
Basics on Radar Cross Section Reduction Measurements
of Simple and Complex Targets Using Microwave Absorbers 367
Fig. 16. RCS pattern of a trihedral (120 mm x 120 mm), reference side (-180º to 0º), ERAM
coated side (0º to +180º).
4.1.4 Cylinders
The RCS of a metal cylinder has well-known theoretical equations and making use of some
considerations, the RCS of a cylinder can be calculated. However, unlike the perfectly
conducting sphere, the cylinder is sensitive to wave polarization.
The calculations involving cylinders generally assume that the axial length of the cylinder is
large compared to the wavelength. The RCS pattern of a cylinder can be represented by an
almost constant value over the entire range of the aspect angle that should, ideally, result in
an omnidirectional pattern.
The advantage of using a metal cylinder with a low roughness, as support for testing the
reflectivity of ERAM, lies on RCS values nearly constant with the angle of the incident wave.
Therefore, the ERAM coated cylinder characterization is more influenced by possible
variations of ERAM texture, homogeneity of the absorbing additives distribution and also
the absorber thickness. Possible variations of these parameters will result in change of RCS
pattern as a function of aspect angle of the incident wave. Figure 17 shows the cylinder
mounted on the positioner, located inside an anechoic chamber, uncoated (Figure 17a) and
ERAM coated (Figure 17b).
(a) (b)
Fig. 17. Assembly of an uncoated (a) and a coated (b) cylinder inside an anechoic chamber
for RCS reduction measurements.
www.intechopen.com
Applied Measurement Systems368
Figure 18 depicts the plotted RCS pattern of a metallic cylinder of 32 cm of length and 15 cm
of diameter, rotating the cylinder from +90o to –90o on its axes and keeping the TX and RX
antennas in the same position, at 9.375 GHz. The determined RCS value is constant and
omnidirectional, equal to 1.61 m2. The cylinder RCS measurement needs a tight adjusts on
the dielectric support to avoid contributions of the reflected waves from this apparatus.
Fig. 18. RCS pattern of a cylinder at 9.375 GHz.
The received power level is almost constant at 9.375 GHz (-49.7  1.0 dBm) rotating the
support in 360o around its vertical axe. This curve is typical for this kind of target and it is
attributed to the cylinder shape, which contributes only as a line when the wave impinges
on it. Afterwards, using the same device and the same cylinder it was obtained the RCS
pattern of this target coated with a processed ERAM (Figure 19).
Fig. 19. RCS patterns of cylinder without ERAM (black curve) and coated with ERAM (red
curve) at 10 GHz (left) and 12 GHz (right).
Figure 19 shows the RCS pattern of the cylinder at 10 GHz and 12 GHz coated with the
ERAM presenting 1.2 mm of thickness loaded with NiZn ferrite and carbon black. In this
case, the pattern shows the reflectivity variation in function of the aspect angles,
characterizing a RCS reduction of the target. This variation is attributed to the heterogeneity
of the processed ERAM, related to both the ferrite and carbon black particles distribution
and the absorber thickness.
www.intechopen.com
Basics on Radar Cross Section Reduction Measurements
of Simple and Complex Targets Using Microwave Absorbers 369
4.2 Complex shapes targets
The total RCS of a target of complex geometry can be determined by various techniques of
different levels of complexity. One approach involves dividing the object into several parts,
and these should approach targets of simple geometry. The determination of the RCS of
each of these parts, the sum of their individual contributions to the total reflected field,
taking into account their respective phase angles and reflectivity, provide the final value of
the target RCS of complex geometry.
A complex target has multiple scatters interacting with each other, changing the RCS as a
function of aspect angle. For those targets, the peaks of RCS pattern may be many wavelengths
apart, but they can add up constructively or destructively by a fraction of degree.
The RCS pattern of a complex target is a function of many variables in the radar system and
environmental measures. In addition to the change in aspect angle and shape of the target,
there are multipath and atmospheric effects. The main reflection mechanisms of a complex
object are: specular reflection, surface waves, edges diffraction and cavities.
In the next section will be treated the RCS studies of complex targets (mainly missiles) done
by the Materials Division/IAE/DCTA from Brazil.
4.2.1 Missiles
Missiles possess one of the most fundamental complex geometries to RCS prediction and
electromagnetic characterization. These ones present a relatively simple geometry in
comparison with more elaborate targets, such as aircraft and ships. However, these shapes
allow detailed studies of the scattering phenomenon of the simple geometries that constitute
them (Ruck, 1970). In this section, it is shown some RCS results achieved in the
characterization of a hypothetical missile and a real missile section, in the microwave range
of 5 to 7 GHz. ERAM application on the studied targets is also evaluated.
4.2.1.1 Characterization of a hypothetical missile in indoor measurements in C-band
A prototype was projected and constructed and called ‘hypothetical missile’. The purpose is
to understand the behavior of an actual complex target, from the well known physical and
mechanical characteristics of a prototype. The dimensions of the hypothetical missile
correspond to those of a cylinder measuring 0.32 m x 0.15 m and four square flat plates
measuring 0.15 m sideways.
The study presented in this section intends to compare the results obtained experimentally
with data obtained theoretically, by predictions based on literature (Knott, 1993). An
algorithm to simulate the radar signature of complex geometry was developed with the
purpose of both estimating the contributions of each simple component of the target and
assisting the analyses of the experimental measurements (Miacci, 2006).
The foreseen aspect, by simulation, of the RCS pattern for this type of target is shown in
Figure 20. This figure demonstrates the appearance of the peaks relative to the frontal, back
and sides contributions of the target. Figure 20 shows also a view inside the anechoic
chamber, where the system was assembled for the RCS experimental measurements for the
frequency range of 5.8 to 6.4 GHz.
www.intechopen.com
Applied Measurement Systems370
Fig. 20. Simulated RCS pattern for the Hypothetic Missile at 6.0 GHz and the Hypothetic
Missile placed in the anechoic chamber.
The same missile was placed in the anechoic chamber and characterized in accordance with
the procedures and the RCS patterns obtained at frequencies 6.0 GHz and 6.4 GHz are
shown in Figure 21. Comparing Figures 20 and 21 good agreements of the patterns is
verified. However, the figures relative to the experimental measurements show less
detailing of the secondary lobes. From these patterns, the RCS values can be calculated for
the hypothetical missile, as shown in Table 4.
Fig. 21. RCS pattern measured from the Hypothetic Missile at 6.0 GHz (left) and 6.4 GHz (right).
Frequency (GHz) RCS maximum (dBsm)
5.9 09.2
6.0 11.5
6.2 11.9
6.4 13.0
Table 4. Experimental RCS Values of the Hypothetical Missile (deviation: 0.7 dB).
The analysis of Table 4 shows the maximum RCS variation of the hypothetical missile (9.2 –
13.0 dBsm) as a function of frequency, hence evidencing the sensibility of this measure with
small variations on the wavelength of incident radiation. From such measurements it can be
affirmed that the system is reliable to accomplish RCS measurements of complex geometry
targets.
4.2.1.2 RCS reduction of the hypothetical missile
Reflectivity measurements of the Hypothetical Missile coated with ERAM were performed
(Figure 22) and the results were compared with those presented in preceding section. In
www.intechopen.com
Basics on Radar Cross Section Reduction Measurements
of Simple and Complex Targets Using Microwave Absorbers 371
order to improve the evaluation of the ERAM effect on the Hypothetical Missile, this
material was applied in only a portion of this target under test, i.e., a face of the missile was
not covered with the absorber. Thus, we applied the ERAM on the front and over one side,
while the rear and the other side did not have their surfaces coated (Figure 23).
Fig. 22. View of the Hypothetical Missile with applying of ERAM.
Fig. 23. Reflectivity curve of the Hypothetical Missile partially covered with ERAM, at 6.2
GHz (left) and 6.4 GHz (right).
Table 5 shows the results and compares the RCS reductions achieved.
Frequency (GHz) RCS Reduction (dB) Measured RCS (dBsm)
5.9 16 -6.8
6.0 19 -7.5
6.2 19 -7.1
6.4 21 -8.0
Table 5. RCS reduction with the ERAM on the Hypothetical Missile (deviation: 0.7 dB).
The analysis of Table 5 shows that the RCS reduction values (16 - 21 dB) are in accordance
with the attenuation values of the used ERAM (~ 20 dB attenuation). This behavior shows
that the proposed experimental method is effective for the study of RCS reduction of
complex geometries. The main contributions are highlighted in the figures.
www.intechopen.com
Applied Measurement Systems372
4.2.1.3 Characterization of a missile’s section in indoor range in C-band
After verifying the reliability of the parameters adopted in the employed methodology, the
characterization of the actual complex target was performed. For this, the selected section of
the actual missile was placed in the anechoic chamber (Figure 24). The results obtained in
the reflectivity measurements are illustrated in Figure 25.
Fig. 24. View of the missile’s section positioned in the anechoic chamber.
Fig. 25. RCS patterns of the missile’s section at 6.0 GHz (left) and 6.4 GHz (right).
Figure 25 represent the obtained curves that are typical of the reflectivity patterns of the
missile’s section characterized in the anechoic chamber at a frequency range of 5.9 to 6.4
GHz. The comparison of these figures shows that the frequency increase is accompanied by
greater detailing of the patterns. This behavior shows a larger contribution of the secondary
lobes. These figures reveal also the real complexity of the RCS patterns of complex targets.
The results of these measurements suggest the presence of phenomena commonly seen in
experiments performed with this type of geometry. As the missile’s section presents similar
geometry to that one observed in the hypothetical missile, it is expected that its pattern
adjust adequately to those measured for the hypothetical missile.
However, the presences of triangular-shaped flat plates (the missile’s warp) and the
irregular aspect of the surface contribute with new peaks, increasing the complexity of the
pattern. Besides the front part of the missile is not a perfect flat plate, since before this area
has the boundary with the tracking compartment, modifying the outline of this target’s
reflectivity pattern, contributing also to the complexity of the RCS pattern.
www.intechopen.com
Basics on Radar Cross Section Reduction Measurements
of Simple and Complex Targets Using Microwave Absorbers 373
Another phenomenon observed is with regard to the non-symmetry of the pattern between
the angles of –180 to 0º and 0 to +180º, which reveal peaks of different shapes and
amplitudes. This is due to the contributions of physical details of the missile, such as
compartments of electronic circuits, conduits where the cables pass through and connectors
integrated to the cylindrical body of the target.
Such devices positioned on the missile’s body, which at first seem to be of little influence,
cause wave scattering on the target’s surface, which alter the reflection as a whole, such as
diffraction edges and traveling waves. These constructive attributes of the missile are
displayed in the measurements and results in alterations in the pattern peaks. These results
justify the complexity of the reduction of the target’s RCS of complex geometry, as foreseen
in literature (Ufimtsev, 1996).
The measured RCS values for these cases can be seen in Table 6.
Frequency (GHz) Maximum RCS (dBsm)
5.9 7.3
6.0 7.9
6.2 10.2
6.4 10.5
Table 6. Experimental RCS values for the missile’s section (deviation: 0.7 dB).
4.2.1.4 RCS reduction of a missile’s section
ERAM was used covering selected faces of the missile, i.e., the faces covered and uncovered
resulted in a pattern for direct comparison of RCS reduction. Analogously to make with the
hypothetical missile, ERAM was applied on the front part and on one side, while the rear
and the other side remained uncoated (Figure 26). Figure 27 show the RCS reduction
patterns obtained at 6.0 and 6.4 GHz.
Similarly to that observed in the Hypothetical Missile measurements, it is verified the RCS
reduction of the faces with ERAM. In a similar way, the application of ERAM promotes
attenuation values of the target’s RCS close to those determined for the ERAM (~ 20 dB).
Table 7 shows the reduction obtained in this case.
Fig. 26. View of the missile’s section covered with ERAM.
www.intechopen.com
Applied Measurement Systems374
Fig. 27. Reflectivity curve of the missile’s section partially covered with ERAM at 6.0 GHz
(left) and 6.4 GHz (right).
Frequency
(GHz)
RCS Reduction
(dB)
Measured RCS
(dBsm)
5.9 11.5 -4.2
6.0 14.0 -6.1
6.2 18.5 -8.3
6.4 18.0 -7.5
Table 7. RCS reduction of the missile’s section coated with ERAM (deviation: 0.7 dB).
5. Conclusions
This work shows a reliable methodology for RCS measurements of simple and complex
targets. Indoor RCS measurements of simple and complex targets in C and X-band are
explored and the results show good agreement with the literature. Reflectivity measurements
of the studied targets coated with electromagnetic radiation absorbing materials demonstrate
that the proposed measurement system is satisfactory for RCS reduction studies.
This work presents also, results of an active cancellation circuit as an enhancement
technique for the RCS measurements. The proposed circuit increases the detection
probability of smaller targets, associated with a greater dynamic range of the measurement
system. Therefore, the proposed circuit makes the study of RCS reduction more effective
concerning small targets covered with high attenuation ERAM. An increase of dynamic
range of up to 26 dB at 5.9 GHz frequency is observed. Consequently, the minimum
detectable RCS values using the proposed circuit increased significantly, as for instance -9.0
dBsm (without the circuit) up to -35 dBsm (with the circuit) at 5.9 GHz.
The recovering of any targets with a determined ERAM developed at Materials
Division/IAE/DCTA in Brazil it was possible to compare and to discuss the influence of the
ERAM on the observed RCS reduction. The used methodology showed useful for attending
aeronautical and telecommunication applications.
For the first time in Brazil, the RCS of missile’s sections (hypothetical missile and an actual
missile section) was experimentally determined, in C-band in an anechoic chamber.
www.intechopen.com
Basics on Radar Cross Section Reduction Measurements
of Simple and Complex Targets Using Microwave Absorbers 375
The evaluated RCS measurement system proved to be effective, with measured values
within the expected error range (lower than 1 dB). The obtained results enable to conclude
that this methodology is applicable in the characterization of various types of simple and
complex geometry targets in indoor and outdoor ranges, attending the far-field condition. In
function of the results obtained, employing the presented system, further in-depth studies of
RCS reduction is feasible for other military platforms, given its functionality.
6. Acknowledgment
The authors acknowledge FAPESP (São Paulo Research Foundation) (Process 03/00716-4
and 11/03093-4), CNPq (National Council for Scientific and Technological Development)
(Process N. 305478/2009-5) for the financial support and also to Dr. Carlos Frederico de
Angelis from INPE/Brazil and the Ministry of Defense / Aeronautics Command, for their
collaboration and support in this project.
7. References
Balanis, C. A. (1982) Antenna theory, analysis and design, Harper & Row, ISBN 0-47160-352-X
New York, USA
Bhattacaryya, A. K.; Sengupta, D. L. (1991), Radar cross section analysis and control, Artech
House, ISBN 0-89006-371-0, Norwood, USA
Birtcher, C. R.; Balanis, C. A. (1994), RCS measurements, transformations and comparisons
under cylindrical and plane wave illumination. IEEE Transactions on Antennas and
Propagation, v. 42, n. 3, p.329-333.
Blake, L. V. (1986), Radar range performance analysis, Artech House, ISBN 0-89006-224-2,
Norwood, USA
Burgess, L. R., Berlekamp, J. (1988) Understanding Radar Cross-Section Measurements.
Microwaves Systems News and Communications Technology, p. 54-61.
Crispin, J. W.; Siegel, K. M. (1968), Methods of radar cross section analysis, Academic Press,
New York, N.Y., USA
Currie, N. C. (1989), Radar reflectivity measurement: techniques and applications, Artech House,
ISBN 0-89006-345-1, Norwood, USA
Dybdal, R. B. (1987) Radar cross section measurements. Proceedings of the IEEE, v. 75, n. 4,
p.498-516.
Jasik, H.; Johnson, R.C. (1984) Antenna engineering handbook, 2 ed., Mcgraw Hill, New York,
USA
Jenn, D. C. (1995), Radar and laser cross section engineering, AIAA Education Series,
Washington, DC, USA
Knott, E. F.; Schaeffer, J. F.; Tuley, M. T. (1993) Radar cross section (2nd ed.), Artech House,
ISBN 1-891121-25-1, Norwood, USA.
Kouyoumjian, R. G.; Peters JR. (1965), Range requirements in radar cross section
measurements. Proceedings of the IEEE, v. 53, p. 920-928.
Martin, I. M.; Dias, J. C.; Rezende, M. C. (2002), Reflectivity in the microwave range of
polyurethane coatings loaded with NiZn ferrites. Journal of Materials Research, v.1,
n.1, p. 1-10
Miacci, M. A. S. (2002), Experimental Measurements of the Microwave Backscattering of Single
Shapes Targets, (In Portuguese), Dissertation (Master of Science) – ITA, Brazil
www.intechopen.com
Applied Measurement Systems376
Miacci, M. A. S. (2006) Improvement of Missile RCS Measurements by using of Active Cancellation
Technique, (In Portuguese), Thesis (PhD) – ITA, Brazil
Ross, R. A. (1966), Radar cross section of rectangular flat plates as function of aspect angle.
IEEE Transactions on Antennas and Propagation, v. AP-14, p. 329-335.
Ruck, G. T. (1970), Radar cross section handbook, Plenum Press, New York, USA.
Skolnik, M. I. (1990), Radar handbook (2nd ed.), Mc Graw Hill, ISBN 0-07-057913-X, New York,
USA.
Thomson Inc. (1988), Luneberg Reflectors and Lenses, Technical Bulletin, September, 8 p,
France.
Ufimtsev, P.Y. (1996), Comments on: Diffraction principles and limitations for RCS
reduction techniques. Proceedings of the IEEE, v. 84, n.12, p.1828-1851.
www.intechopen.com
Applied Measurement Systems
Edited by Prof. Zahurul Haq
ISBN 978-953-51-0103-1
Hard cover, 390 pages
Publisher InTech
Published online 24, February, 2012
Published in print edition February, 2012
InTech Europe
University Campus STeP Ri
Slavka Krautzeka 83/A
51000 Rijeka, Croatia
Phone: +385 (51) 770 447
Fax: +385 (51) 686 166
www.intechopen.com
InTech China
Unit 405, Office Block, Hotel Equatorial Shanghai
No.65, Yan An Road (West), Shanghai, 200040, China
Phone: +86-21-62489820
Fax: +86-21-62489821
Measurement is a multidisciplinary experimental science. Measurement systems synergistically blend science,
engineering and statistical methods to provide fundamental data for research, design and development,
control of processes and operations, and facilitate safe and economic performance of systems. In recent
years, measuring techniques have expanded rapidly and gained maturity, through extensive research activities
and hardware advancements. With individual chapters authored by eminent professionals in their respective
topics, Applied Measurement Systems attempts to provide a comprehensive presentation and in-depth
guidance on some of the key applied and advanced topics in measurements for scientists, engineers and
educators.
How to reference
In order to correctly reference this scholarly work, feel free to copy and paste the following:
Marcelo A. S. Miacci and Mirabel C. Rezende (2012). Basics on Radar Cross Section Reduction
Measurements of Simple and Complex Targets Using Microwave Absorbers, Applied Measurement Systems,
Prof. Zahurul Haq (Ed.), ISBN: 978-953-51-0103-1, InTech, Available from:
http://www.intechopen.com/books/applied-measurement-systems/basics-on-radar-cross-section-reduction-
measurements-of-simple-and-complex-targets-using-microwave-a

Basics on Radar Cross Section

  • 1.
    16 Basics on RadarCross Section Reduction Measurements of Simple and Complex Targets Using Microwave Absorbers Marcelo A. S. Miacci1 and Mirabel C. Rezende2 1National Institute for Space Research (INPE), 2Institute of Aeronautics and Space, Department of Aerospace Science and Technology, Brazil 1. Introduction The research of Radar Cross Section (RCS) of simple and complex objects is decisively important to identify targets such as aircraft, missiles, rockets, ships and other objects, with the purpose of improving or rendering difficult their radar visibility in various frequency ranges. The use of RCS measurements of targets have expanded to more than solely military applications in the identification and control processes of defense systems (Burgess, 1988). Higher the RCS value is, easier it becomes to detect and identify an object. However, when these targets present different geometrical forms and different types of electromagnetic radiation absorber materials (ERAM) on their surfaces, they can become stealthy and practically invisible to radars at determined frequency ranges. In order to make target identification more precise, it is indispensable to analyze and understand the RCS patterns generated by the targets. These patterns represent the reflection mechanisms in the interaction process of the wave with the target, i.e., the interaction of the wave with the aspects of the target’s geometry and the material’s physical- chemical characteristics of its surface (Dybdal, 1987). RCS measurements aim to determine the equivalent effective area of the target when it is impinged by a radar wave. In other words, it is the ratio between the electromagnetic energy irradiated by radar over a target and the energy scattered by it. The scattering measurements can be performed in monostatic condition, whereby the electromagnetic waves reflected by the target are measured in the same direction as the emitting source (radar), or in bistatic condition, when the reflected waves are detected in other directions. The present work describes experimental studies of RCS measurements of targets with simple and complex shapes and the RCS reduction by using ERAM in the microwave frequency range of 5 – 12 GHz (C and X bands). This chapter intends also to give some highlights about the theory involved and some measurement topics concerning target reflectivity, calibration techniques, enhancement methods and some experimental results achieved in this research performed at Materials Division of the Institute of Aeronautics and Space from Brazil. www.intechopen.com
  • 2.
    Applied Measurement Systems352 2.Main definitions When an electromagnetic wave focuses on an object the energy is spread in all directions. The spatial distribution of energy depends on the target geometry, material composition, the operating frequency and polarization of the incident wave. This distribution of energy is called scattering and the material is often called target (Blake, 1986). Based on this principle, we can define the radar cross section, or RCS, as a measure of the power that returns to source or reflects in a given direction, normalized in relation to an incident wave power density. The purpose of normalization is to remove the effect of distance and facilitate the description of the cross section independent of the distance between the target and radar (R). The RCS is defined as shown in equation 1 (Bhattacharyya & Sengupta, 1991). 4 lim → 4 lim → (1) where: σ: radar cross section of the target (m2); : reflected or scattered electric field (V/m); : reflected or scattered magnetic field (A/m); : incident electric field (V/m); : incident magnetic field (A/m). The scattered electric and magnetic fields are due to the presence of a target, so, the total field is the sum of the incident and the scattered fields (equation 2): (2) The RCS unit is usually given in square meters, or expressed in dB, relative to one square meter (dBm2 or dBsm) as in equation 3 (Currie, 1989). log (3) These concepts can be applied in the radar equation (Skolnik, 1990), correlating the received power in terms of transmitted power, scattering, distance and antennas gain (equation 4). 4 (4) where: : radar received power (W); : radar transmitted power (W); R: distance between radar and target (m); σ: radar cross section of the target (m2); G: radar antenna gain (dimensionless); : wavelength (m). The received power by the antenna from the transmitted radar pulse is directly related with the physical characteristics of the target through the backscattering coefficient. The value of this backscattering coefficient is basically dependent on the following factors (Jenn, 1995): www.intechopen.com
  • 3.
    Basics on RadarCross Section Reduction Measurements of Simple and Complex Targets Using Microwave Absorbers 353  the target geometry and surface roughness;  the target material composition (electrical and/or magnetic properties);  the wavelength and polarization of the radar; and  the aspect angle related with the incident wave. The conceptual definition of RCS includes the fact only one part of the radiated energy reaches the target. The RCS of a target () can be most easily visualized as the product of three factors:  = Projected cross section x reflectivity x directivity The reflectivity is defined as the intercepted radiated (scattered) power by the target. The directivity is given by the ratio of the backscattered power into the radar’s direction to the power that would have been backscattered, considering an uniform scattering in all directions (isotropic). 2.1 Scattering matrix In order to determine the dependence of the RCS in relation to the polarization of the wave, we must consider the relationship between the transmitted (t) and the received (r) fields, in terms of the horizontal and vertical components of linear polarization of the wave, EH and EV, respectively, where the index H denotes horizontal polarization and V the vertical polarization. Then, EH and EV can be expressed in terms of the reflectivity of a target illuminated by both polarizations through the proportionality constant aij, where i denotes the polarization of the transmitter and j the polarization of the receiver (equation 5) (Crispin, 1968) or in matrix notation (equation 6): (5) (6) The constants aij shall be considered independent of the distance, but in complex notation due to its phase relationship between the electric field components. For a monostatic radar configuration, aHV and aVH are equal. Therefore, the scattering matrix defines the relationship between amplitude and phase components of the electric fields transmitted and received. A similar matrix to that one mentioned for linear polarization of the wave can be obtained for elliptical and circular polarizations, using the constants of proportionality describing the left or right hand polarization (Crispin, 1968). 2.2 Frequency regions When a target has very small physical dimensions compared to the wavelength of the incident wave, it is considered that your analysis is being done in the so called Rayleigh region (Blake, 1986). In this region, the shape of the object does not influence in determining their RCS, and for some types of objects the RCS is determined from the volume, instead of considering the dimensions and physical forms. For targets that are comparable in size to www.intechopen.com
  • 4.
    Applied Measurement Systems354 thewavelength of incident wave, the RCS varies depending on the frequency and is called the resonant region or Mie region. When the dimensions of the target are large compared with the wavelength of incident wave, the RCS can be determined using the methodology of geometrical optics or by the method of optical physics, and this region is called the optical region. In the following sections, the analysis of some RCS targets of simple and complex geometry is shown in the optical region. Figure 1 is a RCS curve of a sphere as a function of the ratio of the target radius (a)/ wavelength ( ), normalized in the optical region. The analysis of this figure shows that there are the distinct regions discussed above. Although it is a perfectly conducting sphere, this behavior is observed for all types of targets (Currie, 1989; Bhattacharyya & Sengupta, 1991). Fig. 1. Normalized RCS of a sphere as a function of ka (where k=2π/ ). 3. Radar cross section reduction measurements RCS measurements are performed for many reasons; the main one is to verify target detection limits by a radar system to which it is subjected, verifying conformity of the practical models, designed by theoretical equations (Kouyoumjian, 1965). The measurement as a whole is a complex task due to the many factors that may affect these measurements. Instrumental errors, spurious interferences and reflections are some of contributions to degrade the quality of the data. These problems are compounded when one is interested in reducing the RCS of an object, as in this case, the magnitude of these effects can overshadow the true RCS values. Many methods have been proposed and used for the measurement of several types of targets. Depending on the size of the targets and radar frequencies used, RCS measurements can be performed on outdoor or indoor ranges, in the last condition, inside anechoic chambers. In measurements, it is important that the radar is illuminated by an electromagnetic wave which is uniform in phase and amplitude. For practical purposes, the maximum tolerance for amplitude variation over a target is 0.5 dB, and the phase should not deviate more than 22.5o. These conditions denote the far-field condition (Balanis, 1982; Jasik & Johnson, 1984), given by: (7) www.intechopen.com
  • 5.
    Basics on RadarCross Section Reduction Measurements of Simple and Complex Targets Using Microwave Absorbers 355 where: R is the distance between radar and target; d is the largest dimension of the target; and is the wavelength of the radar. This condition ensures good measurements. Errors produced by the instrumentation should neither exceed 0.5 dB nor vary in time in order to avoid instability in the measurement of the RCS patterns. Thus, it is decisive the careful selection of the experimental parameters. In this case, the dynamic range of the system should be at least 40 dB when measuring targets with small RCS. Dynamic range values in the order of 60 dB or higher are preferable when RCS reduction studies are conducted or when absorber materials are used. Another important factor to be taken into account is the target support structure that should not interfere with the incident wave, however in practice such condition isn’t always possible. Analysis of the electromagnetic energy scattering by metallic objects is very important in the understanding of RCS of targets, in the same way that reflections of dielectric and magnetic surfaces are important when studying RCS reduction. Within this context, RCS analysis of targets with simple shapes is fundamental to support the understanding of RCS patterns of targets with complex shapes. To evaluate the electromagnetic behavior of targets, many methods have been proposed and experimentally used for many decades with well accepted results (Birtcher & Balanis, 1994) and the RCS measurement errors depend on the nature of the target under test, the distance at which this target is being measured and the place of measurements. Systems are projected in such way that respect the parameters described above. However, they present technical challenges, making adequate the use of experimental procedures that involve new techniques that can minimize errors. When an anechoic chamber is used, the emissions and reflections of spurious radiation are controlled and minimized by using commercial off the shelf ERAM inside the chamber, becoming the background noise levels of this radiation almost null. On the other hand, by using the outdoor range, the measurements are affected by environment variations, therefore needing greater control of the parameters. Even in measurements performed in indoor range, the RCS patterns of the targets may become impaired due to the occurrence of noise in the system or on account of low backward radiation contribution of the targets with lower RCS. 3.1 Basic instrumentation The basic instrumentation required for RCS measurements consists of four subsystems that can be controlled by a central station; these subsystems are: positioners and drivers, receiver, transmitter and data acquisition system. Using a simple setup and placing the transmitter (TX) and receiver (RX) antennas in the scheme showed in Figure 2, it is possible to measure the RCS of targets in different frequency ranges. The distance between both antennas needs to be tested to eliminate the radiation coupling between them. In order to have good precision, the transmitter must have means to provide enough power to allow a good signal/noise ratio for the measurement system and it is necessary to take www.intechopen.com
  • 6.
    Applied Measurement Systems356 Fig.2. RCS measurement setup (R is the distance between the antennas and the target). care with the alignment between the transmission/reception antennas and the target. The use of a laser beam helps in the alignment of the system improving the precision of the measurements. The support column for the target, called as pylon, needs to be recovered with ERAM in order to avoid any possible contribution of reflected waves that prejudices the target characterization. Figure 3 shows a system used in this study that basically consists of two antennas, one transmitter and one receiver mounted on a tower keeping a certain distance from each other. The target is mounted on a dielectric support and this one is mounted on a positioner which will allow recording the RCS patterns. The transmission is made through a microwave generator that feeds, by a low loss coaxial cable, the antenna input terminals. A spectrum analyzer can be used as a receiver that collects the signals from the receiving antenna. The system has a positioner controller (driver) that controls the rotational speed, azimuth angle and limits. Some equipment is in a control room, where the user monitors the tests through a computer with a GPIB interface. Figure 3 shows the system composed by: a. Target under test (square flat plate with 0.2 m side); b. Pyramidal microwave absorbers; c. Horn antennas to the 8.2 – 12.4 GHz frequency range; d. Low loss coaxial cables; and e. Microwave generator. Fig. 3. Anechoic chamber view assembled with the RCS measurement system (courtesy of IFI/DCTA, Brazil). www.intechopen.com
  • 7.
    Basics on RadarCross Section Reduction Measurements of Simple and Complex Targets Using Microwave Absorbers 357 Figure 4 shows the internal view of the control room (shelter), which is integrated with the instrumentation located inside the anechoic chamber. This figure shows: (a) antenna positioner controllers; (b) spectrum analyzer (receiver) and (c) computer. Fig. 4. Internal view of the control room (courtesy of IFI/DCTA, Brazil). 3.2 Amplitude calibration methods There are two main methods for calibration of systems for RCS measurements: direct and indirect calibrations. The direct calibration involves the use of reference targets with well known values of RCS, such as spheres, flat plates, dihedrals and dielectric lens. The RCS of these targets can be accurately inferred by its physical sizes, to provide a radar return signal that can be compared to the signal of a target under test with unknown value of RCS. In some cases, the reference target may be in a different position relative to the target under test and a modified form of the radar equation is used to estimate the difference, as seen in equation 8: (8) where: : RCS of the target under test (m2); Pr: received power ratio between the reference target and target under test (dimensionless); Ru: distance between target under test and radar (m); Rr: distance between reference target and radar (m); Fu: propagation factor of the target under test (dimensionless); Fr: propagation factor of the reference target (dimensionless); and : RCS of the reference target (m2). From equation 8, the propagation factors Fr and Fu contain information about the conditions of propagation between the radar and the two targets, including any atmospheric attenuation, scattering or even any undesired multiple reflection, as ground reflection that may be present. If the two factors are the same during measurements, equation 8 is reduced to equation 9: (9) www.intechopen.com
  • 8.
    Applied Measurement Systems358 Theaccuracy of this calibration method depends on the accuracy of the RCS reference target and the assumption that there are no other targets or significant sources of reflection on the measuring environment and the propagation factor is well known. The second method of amplitude calibration is known as the indirect calibration method or closure. This method involves precise measurements of the characteristics of the radar system or the transmission and reception system by measuring the received power of a target under test with unknown RCS, and the calculation of RCS is done by using the radar range equation (equation 10) below: 4 (10) where: : RCS of the unknown target (m2); PR: received power from the unknown target (W); LT: transmitter losses (dimensionless); LR: receiver losses (dimensionless); Ru: distance between radar to unknown target (m); PT: transmitted power (W); G: radar antenna’s gain (dimensionless); : wavelength (m), and Fu: propagation factor (dimensionless). For this method is considered accurate, the parameters of the radar should be carefully measured, the received power must be precisely determined and the propagation factor should be equal to unity. The errors associated with this technique can occur in the measurements of radar parameters such as received power and also in conditions where the propagation factor is not equal to unity. One advantage of the indirect technique is that the reference target is not required. 3.3 Enhancement measurement techniques (active cancellation) In order to reduce some error sources present in RCS measurements such as coupling between antennas, reflections in the anechoic chamber, reflection of target support and poor dynamic range, it can be used an active noise cancellation circuit which employs a phase cancelling technique. A result of works performed at Materials Division/IAE/DCTA in Brazil shows an experimental set-up developed to reduce the error sources presented in indoor RCS measurements in C-band (5.8 to 6.4 GHz). By means of this research it was possible to perform comparisons, with and without the developed system, and observe its influence in measurements of simple objects. By proposing the implementation of the system, it is expected to allow detection of small RCS targets by increasing sensitivity and dynamic range, so the effective study of RCS reduction can be established. The complete measurement system has a simplified block diagram shown in Figure 5. The operation principle of the device is based on the detection of spurious signals and the application of the principle of phase cancelling, by generating a signal of equal amplitude www.intechopen.com
  • 9.
    Basics on RadarCross Section Reduction Measurements of Simple and Complex Targets Using Microwave Absorbers 359 Fig. 5. Block diagram of the measurement system with the active noise cancellation circuit. and opposite phase. Thus, after operation of the system only the signal of the target under test is expected to be detected. In this case, errors inherent to the RCS measurement systems in an indoor or outdoor range are reduced. In accordance with Figure 5, operation of the developed device consists of a sample of the signal transmitted by the radar through the directional coupler 1. This signal goes through an isolator, followed by the modulator that performs phase and amplitude modulation (with fine tuning provided by the variable attenuator and phase shifter) and are combined in the directional coupler 2 with the interfering signals. Figure 6 shows the components used, such as: isolator, attenuator, coupler, filter and etc. Fig. 6. View of the designed circuit assembled for C-band. For the evaluation of the system, this circuit was tested by using an anechoic chamber with dimensions of 9.5 m x 4.5 m x 4.5 m available at IFI/DCTA. For this, two corrugated horn antennas were installed, with a transmitter and a receiver and a flat plate measuring 0.3 m x 0.3 m was used as a target under test, at frequencies of 5.9, 6.0, 6.2, and 6.4 GHz. Firstly, the noise level in the chamber was measured with and without the proposed circuit by rotating the azimuth positioner with no targets mounted on that. Some results are shown in Figure 7 and Table 1 presents the results obtained with the circuit for the frequency range. www.intechopen.com
  • 10.
    Applied Measurement Systems360 Fig.7. Noise level of the anechoic chamber, with and without the circuit, at 5.9 GHz. Frequency (GHz) Noise level without the circuit (dBm) Noise level with the circuit (dBm) Reduction (dB) 5.9 -59 -85 26 6.0 -64 -84 20 6.2 -64 -85 21 6.4 -60 -82 22 Table 1. Anechoic chamber noise level reduction in C-band (deviation: 0.7 dB). It is observed that due to the reflection from the anechoic chamber, added to the coupling between the antennas, the noise level is relatively high (approximately -59 dBm at 5.9 GHz). Afterwards, a RCS pattern of the flat plate was measured without the circuit (Figure 8 - left) and it was observed a considerable deformation of the flat plate RCS pattern that can be assessed by foreseen results in literature (Ross, 1966) and experimental measurements (Miacci, 2002). After the circuit’s operation, where the interfering signals were reduced, a new RCS pattern of the flat plate was measured and it can be observed as being closer than expected, as seen in Figure 8 (right). Fig. 8. RCS measurements of the flat plate (0.3 m x 0.3 m) without the circuit (left) and with the circuit (right) at 6.0 GHz. www.intechopen.com
  • 11.
    Basics on RadarCross Section Reduction Measurements of Simple and Complex Targets Using Microwave Absorbers 361 This last RCS pattern evidences well defined null points and symmetry with a minimal contamination from external signals. It is also observed that the circuit does not influence the maximum peak, hence not interfering in the maximum RCS of the target under test. Table 2 shows the minimum detectable RCS values and it is shown the increase of the probability of detection of smaller targets, associated to a higher dynamic range of the system, consequently, allowing the study of RCS reduction to be more effective when dealing with targets covered by high attenuation ERAM. Frequency (GHz) Detectable RCS without circuit (dBsm) Detectable RCS with circuit (dBsm) 5.9 -09 -35 6.0 -16 -36 6.2 -15 -36 6.4 -11 -33 Table 2. Minimum detectable RCS values with and without the circuit (deviation: 0.7 dB). The results denote that the RCS measurements performed with the developed and built circuit improved the RCS patterns with a remarkable reduction of interfering signals in the frequency range. This consideration takes into account the testing environment being almost completely free of spurious signals that reduce precision of measurement systems and can lead to false conclusions in analyses of RCS patterns. These preliminary measurements support other applications in bigger anechoic chambers or even in outdoor measurements. 4. Reflectivity characteristics of simple and complex shapes targets and RCS reduction by using ERAM In this section it will be treated the reflectivity characteristics of simple and complex targets and discussed the experimental results of the RCS reduction research by using ERAM developed in Brazil. 4.1 Simple shapes targets The electromagnetic theory allows the RCS calculation of targets that can be mathematically well defined, considering its size and physical forms. In practice this statement refers to objects with simple geometries. The solutions for simple objects are very important for two reasons, firstly, these objects can be considered as reference targets and they can be constructed and used as calibration references to measure complex geometry targets; second, approximations of equations used to determine the RCS of complex geometry objects can be made by detailed knowledge of the behavior of objects of simple geometries and their combinations (Miacci, 2002). Table 3 shows the equations used for the RCS theoretical calculation for some simple geometry shapes in the optical region (Ruck, 1970; Knott et. al., 1993). In the next sections is presented some experimental results achieved by the research group in RCS measurements of targets with simple and complex geometries and its RCS reduction when applying ERAM. www.intechopen.com
  • 12.
    Applied Measurement Systems362 GeometryRCS (m2) Flat Plate 4 Sphere  =  a2 Diedral 8 Cylinder 4 Table 3. RCS of some simple geometries in optical region. 4.1.1 Dielectric lenses (Luneberg reflectors) In order to validate a RCS measurement setup, firstly, it can be used a certified reference target called Luneberg reflector. A Luneberg reflector (Figure 9 - left) is a sphere constituted of dielectric massive shells. Figure 9 (right) depicts a measured RCS pattern of this target using the setup described in section 3.1, in function of the aspect angles between 0 and 180o in the frequency of 9.375 GHz. The maximum power observed in this pattern corresponds to the RCS value of 45 m2, according to the certified value given by the Luneberg reflector’s manufacturer (Thomson CSF International Inc.). Using the relationship given by equation 9, it is possible to determine the RCS values of single targets in the same frequency (9.375 GHz). The almost constant intensity level of the signal, between the aspect angles of –65 and +65o, corresponds to the region with the same scattering level of the reflector, being a characteristic RCS pattern for this target. The obtained RCS pattern shows a good agreement with that one provided by the manufacturer. Using these data obtained with the Luneberg reflector it is possible to determine the RCS value for other single targets based on equation 9. www.intechopen.com
  • 13.
    Basics on RadarCross Section Reduction Measurements of Simple and Complex Targets Using Microwave Absorbers 363 Fig. 9. Luneberg reflector positioned in an anechoic chamber (left) and a measured RCS pattern at 9.375 GHz (right). 4.1.2 Flat plates RCS reduction measurements The RCS values of a perfect flat rectangular reflector can have its theoretical RCS value calculated as a function of the incident radiation frequency, according to equation depicted in Table 3. The RCS reduction method to evaluate a flat plate requires a double face panel, where one side is used as reflector material (reference) and the other is coated with ERAM. The panel is fixed on a rotating support, which is positioned in front of the receiving and transmitting horns according to the setup described in 3.1. The advantage of this methodology is that it allows the evaluation of the reference and ERAM, by rotating the device from 0 to 360o, evaluating both sides of the panel, one after the other. Figure 10 shows a simplified scheme of the device used in RCS method. With this method, it is not necessary to make two separate measurements, because the RCS pattern of the ERAM is made by rotating the device from 0 to 180o and the reference (metal plate-reflector) is made from 180 to 360o. Thus, it is a self-calibrating measurement (Knott et al., 1993). Fig. 10. Device scheme used for the RCS measurements. The tested ERAM coating was prepared at Materials Division/IAE/DCTA, from Brazil. The ERAM preparation involved the mixture of 60 % (w/w) of a commercial polyurethane matrix loaded with 40 % (w/w) of fillers, being carbonyl iron (20 %) and ferrites of MnZn (10 %), NiZn (5 %) and MgZn (5 %). Physico-chemical characteristics of the fillers and the polyurethane resin as well as the coating preparation procedures were previously described www.intechopen.com
  • 14.
    Applied Measurement Systems364 (Martin,2002). The ERAM was applied on the aluminum flat panel of 300 mm x 200 mm surface by brushing with thickness of 0.7 to 2.0 mm. RCS measurements were carried out at the frequency of 8 GHz and the panel (300 mm x 200 mm) was fixed on the rotating support (Figure 11) and rotated from 0 to 360o, at a scanning rate of 0.080 rad/s, characterizing both sides of the panel, i.e., the reference side and the ERAM painted side. From 0 to -1800 it is scanned the reference side and from 0 to + 1800 the ERAM coated side. Fig. 11. Flat plate assembled in an anechoic chamber: metal face (left) and ERAM face (right). Figure 12 shows the RCS pattern of the reference aluminum plate, obtained at 8 GHz, with a rotation of 180o. It is observed a peak at 0o corresponding to values of -25.3 dBm (that results in a RCS value about 32.1 m2 using an appropriate reference target), due to the normal incidence of the electromagnetic waves on the reference plate. The position of the plate is a critical point for the success of the measurements, where changes of  8o, for example, can change the signal intensity for nearly –35 dBm. This abrupt dropping of the signal for angles different from 0o is due to the flat geometry of the target, scattering the electromagnetic wave impinged on it in different directions of the receiving antenna. Fig. 12. RCS pattern of an aluminum plate (300 mm x 200 mm), at 8 GHz. Afterwards, RCS measurements were carried out with the panel having one side coated by ERAM. Figure 13 shows the RCS pattern expressed in dBm and in square meters, both www.intechopen.com
  • 15.
    Basics on RadarCross Section Reduction Measurements of Simple and Complex Targets Using Microwave Absorbers 365 obtained at 8 GHz. In the range of 0 to -180o it is observed a peak at –900, corresponding to the normal incidence of the radiation on the reference side of the panel. (a) (b) Fig. 13. RCS measurements of the panel (300 mm x 200 mm), at 8 GHz: (a) in dBm and (b) in m2. Reference side (-180o to 0o) and ERAM coated side (00 to +180o). The attenuation obtained at the frequency of 8 GHz, presented above, at the incidence angle of 90o is about 10 dB. The measurements showed clearly that the RCS values decrease when the ERAM is applied on the flat plate. The processed ERAM coating is able to attenuate nearly 94 % of the electromagnetic wave, when impinged at 90o, at 8 GHz. 4.1.3 Dihedral and trihedral corner reflectors Corner reflectors consist in geometries of special interest in electromagnetic scattering problems because they provide a large bistatic or monostatic radar cross section over a broad range of observation and aspect angles. The large echoes from these targets arise from the multiple reflections between two or three mutually orthogonal flat surfaces forming the reflectors. Dihedral corners have been used by many works in RCS reduction studies and also as RCS calibration target (reference target). Trihedral corners yield large backscattering RCS over a wide azimuth and elevation angular ranges and are widely used for external radar calibration. Both dihedral and trihedral corners are usually present in mechanical structures of ships, aircraft and vehicles, contributing as efficient scattering centers of such targets. Thus RCS reduction of such geometric corner structures is of great importance in the design and construction of ships and aircraft which will be under surveillance of radar systems. It has been reported that RCS reduction of dihedral corners can be achieved by altering the mutual orthogonality of the flat surfaces. This technique involves changes in original engineering design of the target. Meanwhile, the use of ERAM can also overcome this problem. This section shows the results involving the RCS reduction of a square dihedral and trihedral corner reflectors, coated with ERAM developed at Materials Division/IAE/DCTA. The characterization was performed using an anechoic chamber in the frequency range of 8 – 12 GHz. www.intechopen.com
  • 16.
    Applied Measurement Systems366 RCSmeasurements were carried out at the frequencies of 8, 10 e 12 GHz. In each frequency, the dihedral and the trihedral were fixed on the rotating support and rotated from –90º to +90º, at a scanning rate of 0.15 rad/s. In this process two pieces were utilized, one as reference and the other coated with the ERAM (previously described). Figure 14 shows the assembly of a dihedral inside the anechoic chamber used in this work. Fig. 14. Assembly of a dihedral on the azimuth positioner. Figure 15 shows the results at 10 GHz of the reference dihedral (-180o to 0o) and this target coated with ERAM (0o to +180o). The dihedral RCS pattern is characterized by multiple reflections of the wave between the orthogonal faces, with two peaks in the aspect angles of –135o and –45o. These peaks are attributed to the wave normal incidence on the flat side of the dihedral. It can be observed at 10 GHz (Figure 15) an attenuation of nearly 13.6 dB and 10 dB at -135o and –45o, respectively in the RCS pattern of the ERAM coated dihedral, in comparison to the reference one. Between +45o and +135o angles it is verified an attenuation of 20 - 24 dB, attributed to the multiple reflections of the wave between the orthogonal faces of the dihedral. Fig. 15. RCS pattern of a dihedral (120 mm x 120 mm), reference side (-180º to 0º), ERAM coated side (0º to +180º). Figure 16 depicts the results at 8 GHz of both, the reference trihedral (-180o to 0o) and the ERAM coated one (0o to +180o). The trihedral RCS pattern is characterized by multiple reflections of the wave among the three faces. In a similar way, the resulted RCS pattern is similar to that one verified for dihedrals. At 8 GHz, the RCS pattern shows a reduction of 17 dB for the ERAM coated trihedral in comparison to the reference one, between the aspect angles of +45o and +135o. However, in the angle range of +135o to +180o and 0o to 45o is observed a signal increase related to the reference trihedral. www.intechopen.com
  • 17.
    Basics on RadarCross Section Reduction Measurements of Simple and Complex Targets Using Microwave Absorbers 367 Fig. 16. RCS pattern of a trihedral (120 mm x 120 mm), reference side (-180º to 0º), ERAM coated side (0º to +180º). 4.1.4 Cylinders The RCS of a metal cylinder has well-known theoretical equations and making use of some considerations, the RCS of a cylinder can be calculated. However, unlike the perfectly conducting sphere, the cylinder is sensitive to wave polarization. The calculations involving cylinders generally assume that the axial length of the cylinder is large compared to the wavelength. The RCS pattern of a cylinder can be represented by an almost constant value over the entire range of the aspect angle that should, ideally, result in an omnidirectional pattern. The advantage of using a metal cylinder with a low roughness, as support for testing the reflectivity of ERAM, lies on RCS values nearly constant with the angle of the incident wave. Therefore, the ERAM coated cylinder characterization is more influenced by possible variations of ERAM texture, homogeneity of the absorbing additives distribution and also the absorber thickness. Possible variations of these parameters will result in change of RCS pattern as a function of aspect angle of the incident wave. Figure 17 shows the cylinder mounted on the positioner, located inside an anechoic chamber, uncoated (Figure 17a) and ERAM coated (Figure 17b). (a) (b) Fig. 17. Assembly of an uncoated (a) and a coated (b) cylinder inside an anechoic chamber for RCS reduction measurements. www.intechopen.com
  • 18.
    Applied Measurement Systems368 Figure18 depicts the plotted RCS pattern of a metallic cylinder of 32 cm of length and 15 cm of diameter, rotating the cylinder from +90o to –90o on its axes and keeping the TX and RX antennas in the same position, at 9.375 GHz. The determined RCS value is constant and omnidirectional, equal to 1.61 m2. The cylinder RCS measurement needs a tight adjusts on the dielectric support to avoid contributions of the reflected waves from this apparatus. Fig. 18. RCS pattern of a cylinder at 9.375 GHz. The received power level is almost constant at 9.375 GHz (-49.7  1.0 dBm) rotating the support in 360o around its vertical axe. This curve is typical for this kind of target and it is attributed to the cylinder shape, which contributes only as a line when the wave impinges on it. Afterwards, using the same device and the same cylinder it was obtained the RCS pattern of this target coated with a processed ERAM (Figure 19). Fig. 19. RCS patterns of cylinder without ERAM (black curve) and coated with ERAM (red curve) at 10 GHz (left) and 12 GHz (right). Figure 19 shows the RCS pattern of the cylinder at 10 GHz and 12 GHz coated with the ERAM presenting 1.2 mm of thickness loaded with NiZn ferrite and carbon black. In this case, the pattern shows the reflectivity variation in function of the aspect angles, characterizing a RCS reduction of the target. This variation is attributed to the heterogeneity of the processed ERAM, related to both the ferrite and carbon black particles distribution and the absorber thickness. www.intechopen.com
  • 19.
    Basics on RadarCross Section Reduction Measurements of Simple and Complex Targets Using Microwave Absorbers 369 4.2 Complex shapes targets The total RCS of a target of complex geometry can be determined by various techniques of different levels of complexity. One approach involves dividing the object into several parts, and these should approach targets of simple geometry. The determination of the RCS of each of these parts, the sum of their individual contributions to the total reflected field, taking into account their respective phase angles and reflectivity, provide the final value of the target RCS of complex geometry. A complex target has multiple scatters interacting with each other, changing the RCS as a function of aspect angle. For those targets, the peaks of RCS pattern may be many wavelengths apart, but they can add up constructively or destructively by a fraction of degree. The RCS pattern of a complex target is a function of many variables in the radar system and environmental measures. In addition to the change in aspect angle and shape of the target, there are multipath and atmospheric effects. The main reflection mechanisms of a complex object are: specular reflection, surface waves, edges diffraction and cavities. In the next section will be treated the RCS studies of complex targets (mainly missiles) done by the Materials Division/IAE/DCTA from Brazil. 4.2.1 Missiles Missiles possess one of the most fundamental complex geometries to RCS prediction and electromagnetic characterization. These ones present a relatively simple geometry in comparison with more elaborate targets, such as aircraft and ships. However, these shapes allow detailed studies of the scattering phenomenon of the simple geometries that constitute them (Ruck, 1970). In this section, it is shown some RCS results achieved in the characterization of a hypothetical missile and a real missile section, in the microwave range of 5 to 7 GHz. ERAM application on the studied targets is also evaluated. 4.2.1.1 Characterization of a hypothetical missile in indoor measurements in C-band A prototype was projected and constructed and called ‘hypothetical missile’. The purpose is to understand the behavior of an actual complex target, from the well known physical and mechanical characteristics of a prototype. The dimensions of the hypothetical missile correspond to those of a cylinder measuring 0.32 m x 0.15 m and four square flat plates measuring 0.15 m sideways. The study presented in this section intends to compare the results obtained experimentally with data obtained theoretically, by predictions based on literature (Knott, 1993). An algorithm to simulate the radar signature of complex geometry was developed with the purpose of both estimating the contributions of each simple component of the target and assisting the analyses of the experimental measurements (Miacci, 2006). The foreseen aspect, by simulation, of the RCS pattern for this type of target is shown in Figure 20. This figure demonstrates the appearance of the peaks relative to the frontal, back and sides contributions of the target. Figure 20 shows also a view inside the anechoic chamber, where the system was assembled for the RCS experimental measurements for the frequency range of 5.8 to 6.4 GHz. www.intechopen.com
  • 20.
    Applied Measurement Systems370 Fig.20. Simulated RCS pattern for the Hypothetic Missile at 6.0 GHz and the Hypothetic Missile placed in the anechoic chamber. The same missile was placed in the anechoic chamber and characterized in accordance with the procedures and the RCS patterns obtained at frequencies 6.0 GHz and 6.4 GHz are shown in Figure 21. Comparing Figures 20 and 21 good agreements of the patterns is verified. However, the figures relative to the experimental measurements show less detailing of the secondary lobes. From these patterns, the RCS values can be calculated for the hypothetical missile, as shown in Table 4. Fig. 21. RCS pattern measured from the Hypothetic Missile at 6.0 GHz (left) and 6.4 GHz (right). Frequency (GHz) RCS maximum (dBsm) 5.9 09.2 6.0 11.5 6.2 11.9 6.4 13.0 Table 4. Experimental RCS Values of the Hypothetical Missile (deviation: 0.7 dB). The analysis of Table 4 shows the maximum RCS variation of the hypothetical missile (9.2 – 13.0 dBsm) as a function of frequency, hence evidencing the sensibility of this measure with small variations on the wavelength of incident radiation. From such measurements it can be affirmed that the system is reliable to accomplish RCS measurements of complex geometry targets. 4.2.1.2 RCS reduction of the hypothetical missile Reflectivity measurements of the Hypothetical Missile coated with ERAM were performed (Figure 22) and the results were compared with those presented in preceding section. In www.intechopen.com
  • 21.
    Basics on RadarCross Section Reduction Measurements of Simple and Complex Targets Using Microwave Absorbers 371 order to improve the evaluation of the ERAM effect on the Hypothetical Missile, this material was applied in only a portion of this target under test, i.e., a face of the missile was not covered with the absorber. Thus, we applied the ERAM on the front and over one side, while the rear and the other side did not have their surfaces coated (Figure 23). Fig. 22. View of the Hypothetical Missile with applying of ERAM. Fig. 23. Reflectivity curve of the Hypothetical Missile partially covered with ERAM, at 6.2 GHz (left) and 6.4 GHz (right). Table 5 shows the results and compares the RCS reductions achieved. Frequency (GHz) RCS Reduction (dB) Measured RCS (dBsm) 5.9 16 -6.8 6.0 19 -7.5 6.2 19 -7.1 6.4 21 -8.0 Table 5. RCS reduction with the ERAM on the Hypothetical Missile (deviation: 0.7 dB). The analysis of Table 5 shows that the RCS reduction values (16 - 21 dB) are in accordance with the attenuation values of the used ERAM (~ 20 dB attenuation). This behavior shows that the proposed experimental method is effective for the study of RCS reduction of complex geometries. The main contributions are highlighted in the figures. www.intechopen.com
  • 22.
    Applied Measurement Systems372 4.2.1.3Characterization of a missile’s section in indoor range in C-band After verifying the reliability of the parameters adopted in the employed methodology, the characterization of the actual complex target was performed. For this, the selected section of the actual missile was placed in the anechoic chamber (Figure 24). The results obtained in the reflectivity measurements are illustrated in Figure 25. Fig. 24. View of the missile’s section positioned in the anechoic chamber. Fig. 25. RCS patterns of the missile’s section at 6.0 GHz (left) and 6.4 GHz (right). Figure 25 represent the obtained curves that are typical of the reflectivity patterns of the missile’s section characterized in the anechoic chamber at a frequency range of 5.9 to 6.4 GHz. The comparison of these figures shows that the frequency increase is accompanied by greater detailing of the patterns. This behavior shows a larger contribution of the secondary lobes. These figures reveal also the real complexity of the RCS patterns of complex targets. The results of these measurements suggest the presence of phenomena commonly seen in experiments performed with this type of geometry. As the missile’s section presents similar geometry to that one observed in the hypothetical missile, it is expected that its pattern adjust adequately to those measured for the hypothetical missile. However, the presences of triangular-shaped flat plates (the missile’s warp) and the irregular aspect of the surface contribute with new peaks, increasing the complexity of the pattern. Besides the front part of the missile is not a perfect flat plate, since before this area has the boundary with the tracking compartment, modifying the outline of this target’s reflectivity pattern, contributing also to the complexity of the RCS pattern. www.intechopen.com
  • 23.
    Basics on RadarCross Section Reduction Measurements of Simple and Complex Targets Using Microwave Absorbers 373 Another phenomenon observed is with regard to the non-symmetry of the pattern between the angles of –180 to 0º and 0 to +180º, which reveal peaks of different shapes and amplitudes. This is due to the contributions of physical details of the missile, such as compartments of electronic circuits, conduits where the cables pass through and connectors integrated to the cylindrical body of the target. Such devices positioned on the missile’s body, which at first seem to be of little influence, cause wave scattering on the target’s surface, which alter the reflection as a whole, such as diffraction edges and traveling waves. These constructive attributes of the missile are displayed in the measurements and results in alterations in the pattern peaks. These results justify the complexity of the reduction of the target’s RCS of complex geometry, as foreseen in literature (Ufimtsev, 1996). The measured RCS values for these cases can be seen in Table 6. Frequency (GHz) Maximum RCS (dBsm) 5.9 7.3 6.0 7.9 6.2 10.2 6.4 10.5 Table 6. Experimental RCS values for the missile’s section (deviation: 0.7 dB). 4.2.1.4 RCS reduction of a missile’s section ERAM was used covering selected faces of the missile, i.e., the faces covered and uncovered resulted in a pattern for direct comparison of RCS reduction. Analogously to make with the hypothetical missile, ERAM was applied on the front part and on one side, while the rear and the other side remained uncoated (Figure 26). Figure 27 show the RCS reduction patterns obtained at 6.0 and 6.4 GHz. Similarly to that observed in the Hypothetical Missile measurements, it is verified the RCS reduction of the faces with ERAM. In a similar way, the application of ERAM promotes attenuation values of the target’s RCS close to those determined for the ERAM (~ 20 dB). Table 7 shows the reduction obtained in this case. Fig. 26. View of the missile’s section covered with ERAM. www.intechopen.com
  • 24.
    Applied Measurement Systems374 Fig.27. Reflectivity curve of the missile’s section partially covered with ERAM at 6.0 GHz (left) and 6.4 GHz (right). Frequency (GHz) RCS Reduction (dB) Measured RCS (dBsm) 5.9 11.5 -4.2 6.0 14.0 -6.1 6.2 18.5 -8.3 6.4 18.0 -7.5 Table 7. RCS reduction of the missile’s section coated with ERAM (deviation: 0.7 dB). 5. Conclusions This work shows a reliable methodology for RCS measurements of simple and complex targets. Indoor RCS measurements of simple and complex targets in C and X-band are explored and the results show good agreement with the literature. Reflectivity measurements of the studied targets coated with electromagnetic radiation absorbing materials demonstrate that the proposed measurement system is satisfactory for RCS reduction studies. This work presents also, results of an active cancellation circuit as an enhancement technique for the RCS measurements. The proposed circuit increases the detection probability of smaller targets, associated with a greater dynamic range of the measurement system. Therefore, the proposed circuit makes the study of RCS reduction more effective concerning small targets covered with high attenuation ERAM. An increase of dynamic range of up to 26 dB at 5.9 GHz frequency is observed. Consequently, the minimum detectable RCS values using the proposed circuit increased significantly, as for instance -9.0 dBsm (without the circuit) up to -35 dBsm (with the circuit) at 5.9 GHz. The recovering of any targets with a determined ERAM developed at Materials Division/IAE/DCTA in Brazil it was possible to compare and to discuss the influence of the ERAM on the observed RCS reduction. The used methodology showed useful for attending aeronautical and telecommunication applications. For the first time in Brazil, the RCS of missile’s sections (hypothetical missile and an actual missile section) was experimentally determined, in C-band in an anechoic chamber. www.intechopen.com
  • 25.
    Basics on RadarCross Section Reduction Measurements of Simple and Complex Targets Using Microwave Absorbers 375 The evaluated RCS measurement system proved to be effective, with measured values within the expected error range (lower than 1 dB). The obtained results enable to conclude that this methodology is applicable in the characterization of various types of simple and complex geometry targets in indoor and outdoor ranges, attending the far-field condition. In function of the results obtained, employing the presented system, further in-depth studies of RCS reduction is feasible for other military platforms, given its functionality. 6. Acknowledgment The authors acknowledge FAPESP (São Paulo Research Foundation) (Process 03/00716-4 and 11/03093-4), CNPq (National Council for Scientific and Technological Development) (Process N. 305478/2009-5) for the financial support and also to Dr. Carlos Frederico de Angelis from INPE/Brazil and the Ministry of Defense / Aeronautics Command, for their collaboration and support in this project. 7. References Balanis, C. A. (1982) Antenna theory, analysis and design, Harper & Row, ISBN 0-47160-352-X New York, USA Bhattacaryya, A. K.; Sengupta, D. L. (1991), Radar cross section analysis and control, Artech House, ISBN 0-89006-371-0, Norwood, USA Birtcher, C. R.; Balanis, C. A. (1994), RCS measurements, transformations and comparisons under cylindrical and plane wave illumination. IEEE Transactions on Antennas and Propagation, v. 42, n. 3, p.329-333. Blake, L. V. (1986), Radar range performance analysis, Artech House, ISBN 0-89006-224-2, Norwood, USA Burgess, L. R., Berlekamp, J. (1988) Understanding Radar Cross-Section Measurements. Microwaves Systems News and Communications Technology, p. 54-61. Crispin, J. W.; Siegel, K. M. (1968), Methods of radar cross section analysis, Academic Press, New York, N.Y., USA Currie, N. C. (1989), Radar reflectivity measurement: techniques and applications, Artech House, ISBN 0-89006-345-1, Norwood, USA Dybdal, R. B. (1987) Radar cross section measurements. Proceedings of the IEEE, v. 75, n. 4, p.498-516. Jasik, H.; Johnson, R.C. (1984) Antenna engineering handbook, 2 ed., Mcgraw Hill, New York, USA Jenn, D. C. (1995), Radar and laser cross section engineering, AIAA Education Series, Washington, DC, USA Knott, E. F.; Schaeffer, J. F.; Tuley, M. T. (1993) Radar cross section (2nd ed.), Artech House, ISBN 1-891121-25-1, Norwood, USA. Kouyoumjian, R. G.; Peters JR. (1965), Range requirements in radar cross section measurements. Proceedings of the IEEE, v. 53, p. 920-928. Martin, I. M.; Dias, J. C.; Rezende, M. C. (2002), Reflectivity in the microwave range of polyurethane coatings loaded with NiZn ferrites. Journal of Materials Research, v.1, n.1, p. 1-10 Miacci, M. A. S. (2002), Experimental Measurements of the Microwave Backscattering of Single Shapes Targets, (In Portuguese), Dissertation (Master of Science) – ITA, Brazil www.intechopen.com
  • 26.
    Applied Measurement Systems376 Miacci,M. A. S. (2006) Improvement of Missile RCS Measurements by using of Active Cancellation Technique, (In Portuguese), Thesis (PhD) – ITA, Brazil Ross, R. A. (1966), Radar cross section of rectangular flat plates as function of aspect angle. IEEE Transactions on Antennas and Propagation, v. AP-14, p. 329-335. Ruck, G. T. (1970), Radar cross section handbook, Plenum Press, New York, USA. Skolnik, M. I. (1990), Radar handbook (2nd ed.), Mc Graw Hill, ISBN 0-07-057913-X, New York, USA. Thomson Inc. (1988), Luneberg Reflectors and Lenses, Technical Bulletin, September, 8 p, France. Ufimtsev, P.Y. (1996), Comments on: Diffraction principles and limitations for RCS reduction techniques. Proceedings of the IEEE, v. 84, n.12, p.1828-1851. www.intechopen.com
  • 27.
    Applied Measurement Systems Editedby Prof. Zahurul Haq ISBN 978-953-51-0103-1 Hard cover, 390 pages Publisher InTech Published online 24, February, 2012 Published in print edition February, 2012 InTech Europe University Campus STeP Ri Slavka Krautzeka 83/A 51000 Rijeka, Croatia Phone: +385 (51) 770 447 Fax: +385 (51) 686 166 www.intechopen.com InTech China Unit 405, Office Block, Hotel Equatorial Shanghai No.65, Yan An Road (West), Shanghai, 200040, China Phone: +86-21-62489820 Fax: +86-21-62489821 Measurement is a multidisciplinary experimental science. Measurement systems synergistically blend science, engineering and statistical methods to provide fundamental data for research, design and development, control of processes and operations, and facilitate safe and economic performance of systems. In recent years, measuring techniques have expanded rapidly and gained maturity, through extensive research activities and hardware advancements. With individual chapters authored by eminent professionals in their respective topics, Applied Measurement Systems attempts to provide a comprehensive presentation and in-depth guidance on some of the key applied and advanced topics in measurements for scientists, engineers and educators. How to reference In order to correctly reference this scholarly work, feel free to copy and paste the following: Marcelo A. S. Miacci and Mirabel C. Rezende (2012). Basics on Radar Cross Section Reduction Measurements of Simple and Complex Targets Using Microwave Absorbers, Applied Measurement Systems, Prof. Zahurul Haq (Ed.), ISBN: 978-953-51-0103-1, InTech, Available from: http://www.intechopen.com/books/applied-measurement-systems/basics-on-radar-cross-section-reduction- measurements-of-simple-and-complex-targets-using-microwave-a