Downloaded 29 times
![These data processors convert data produced by the signal processor into a form that is readily interpretable by radar
operators. They implement Human machine interface (HMI) designs that are used to process inputs received from
the operator. Often tactical information is stored and used by the data processing system
B.
Time delay estimation method
For detection echoes in noisy signals and estimation of their delay cross-correlation method is widely
used. In this method the cross-correlation function between the two digital sequences xT(nT) and xE(nT),
representing the transmitted and echo signals is calculated [9]:
where T is the sampling interval, s(nT) is the geneted and n(nT) are uncorrelated noises, is the
coefficient of estimating signal attenuation, D is
the determined delay time. This method is in
(1)
pulse-echo measurements used.
The correlation of the two sequences is given by:
The statistical expectation of this sequence is:
(2)
where Css(kT) is the sampled auto-correlation
function of the signal s(t). For a finite energy
signal equation (4) have a peak for k=kD. In
practice the delay time D can be estimated by
(3)
finding the peak of the correlation (3).
In NDT applications very often the delay of the signal and distance till defect is found from the peak value
of the signal envelope. The envelope of the narrowband signals may be determined using the Hilbert
transform. In the case of narrowband signals it is a fast and simple method to estimate small time delays.
The Hilbert transform of the reference echo signal r(t) is defined as:
(5)
Where the integral is a Cauchy Principal Value (CPV); * denotes convolution. The Hilbert kernel is
denoted by
and the received echo signal is
s(t)= r(t - where is the delay time.
),
The cross correlation between s(t) and r(t) will not have maximum at the time lag but a zero crossing. It
is necessity of this method that it is easier to find a zero crossing than a peak in a noisy signal. Assuming
that r(t) is narrowband, e.g., its energy is concentrated in frequency intervals B around ±f0 and that B
<<1
the cross correlation Rsr(0) can be approximated as](https://image.slidesharecdn.com/subsystemsofradarandsignalprocessing111-131114111622-phpapp02/75/Subsystems-of-radar-and-signal-processing-3-2048.jpg)
![(6)
where
is the energy of r(t) and
w0=2 0.
f
(6)
The cross-correlation method is combined with co
method of digital Windows. In this method ultrasonic
segmented at different depths by partially overlapping
C.
called
signals are
windows.
De-Convolution in samples
In thin samples the reflected signals are overlapping thus making detection of defects in the sample and
accurate measurements impossible. For improvement of spatial resolution various filtering techniques
known as the inverse filtering (de-convolution), usually in the frequency domain, are used: homomorphic
(cepstrum) processing and parametric identification. For example, the power cepstrum has been proposed
for detecting echoes in thin composite materials and noisy seismic signals. These techniques can be used
for relatively low signal-to-noise ratios and high echo distortion.
In the power cepstrum method [12] the convolution is represented by the product of their respective Fourier
transforms S( and H( where S( and H( is the Fourier transformed ultrasonic signal and noise.
)
),
)
)
The system response h(t) can be separated from the signal by simply dividing X( by S( and taking the
)
)
inverse transform of it. The inverse Fourier transform is defined of the log-normalized Fourier transform:
(4)
where q is called the frequency and x(t) is the obtained waveform. The low-frequency ripples can be
reduced by low-pass filtering:
(5)
Where, qc is a cut-off frequency which may be determined for a given measurement system and the material
configuration.
Homomorphic de-convolution method enables to reduce the pulse width for imaging of defects in thin laminates of
composite. The core idea of this method is to convert the product S(
)H( into a sum by applying a logarithmic
)
function. The complex spectrum is defined as the inverse Fourier transformation of the log-normalized Fourier
transform of the input signal, which is reverted to the time or the frequency domain.
IV.
Stratosphere troposphere Radar (ST radar)
This would lead to prediction of accurate weather patterns and provide warning of severe climatic conditions like
torrential rains, cloud bursts etc. It would provide better information about agriculture, civil aviation and disaster
management and recovery. In general, it would provide information about wind dynamics and atmospheric activity
of the country.](https://image.slidesharecdn.com/subsystemsofradarandsignalprocessing111-131114111622-phpapp02/75/Subsystems-of-radar-and-signal-processing-4-2048.jpg)
![A. Operation
It is basically a monostatic radar which would use the Doppler beam swinging technique (DBS) and spaced antenna
drift (SAD) technique. It will be developed as an Active Aperture Distributed Circular Phased Array using solid
state modules and Digital Signal processing techniques. It would cover a height region from 1 to 20 Km covering
the troposphere slightly beyond the tropopause into the lower stratosphere. It is a wind profiler that has its center
frequency in the WPC band with a bandwidth of 190-210 MHz having minimum bandwidth of 5 MHz.
B.Wind Profiler: A wind profiler is a type of weather observing equipment that uses radar or sound waves
(SODAR) to detect the windspeed and direction at various elevations above the ground. It is used to find the speed
with which wind is propagating and the altitude of atmospheric irregularities with respect to the radar. A typical
wind profiler works in the frequency ranges of 45-65MHz, 404-482MHz, 915-924MHz, 1280– 1357.5MHz. The
following section discusses the radar based wind profiler. The targets of the wind profiler are the irregularities in the
refractive index
A wind profiler is a type of weather observing equipment that uses radar or sound waves (SODAR) to detect the
windspeed and direction at various elevations above the ground. It is used to find the speed with which wind is
propagating and the altitude of atmospheric irregularities with respect to the radar. A typical wind profiler works in
the frequency ranges of 45-65MHz, 404-482MHz, 915-924MHz, 1280– 1357.5MHz. Another important point to
note is that the scale of the target should be about half of the wavelength of the transmitted radiation. This is the
necessary condition which ensures the scattering of the incident wave. The larger the target the greater is the
strength of the scattered signal.
References
[1]
[2]
[3]
[4]
[5]
[6]
[7]
[8]
[9]
www.sameer.gov.in
Introduction to Radar systems 2nd edition by Merill Skolnik
NEETS module – Navy electronics and electrical Training Module
Report and materials provided by the organisation
ocw.mit.edu
http://www.turnpoint.net/wireless/cantennahowto.html
http://www.radartutorial.eu/08.transmitters/tx01.en.html
http://www.minicircuits.com/pdfs/D17I+.pdf
http://ocw.mit.edu/resources/res-ll-003-build-a-small-radar-system-capable-of-sensing-range-doppler-and-synthetic-aperture-radar-imagingjanuary-iap-2011/lecture-notes/MITRES_LL_003IAP11_lec02.pdf](https://image.slidesharecdn.com/subsystemsofradarandsignalprocessing111-131114111622-phpapp02/75/Subsystems-of-radar-and-signal-processing-5-2048.jpg)

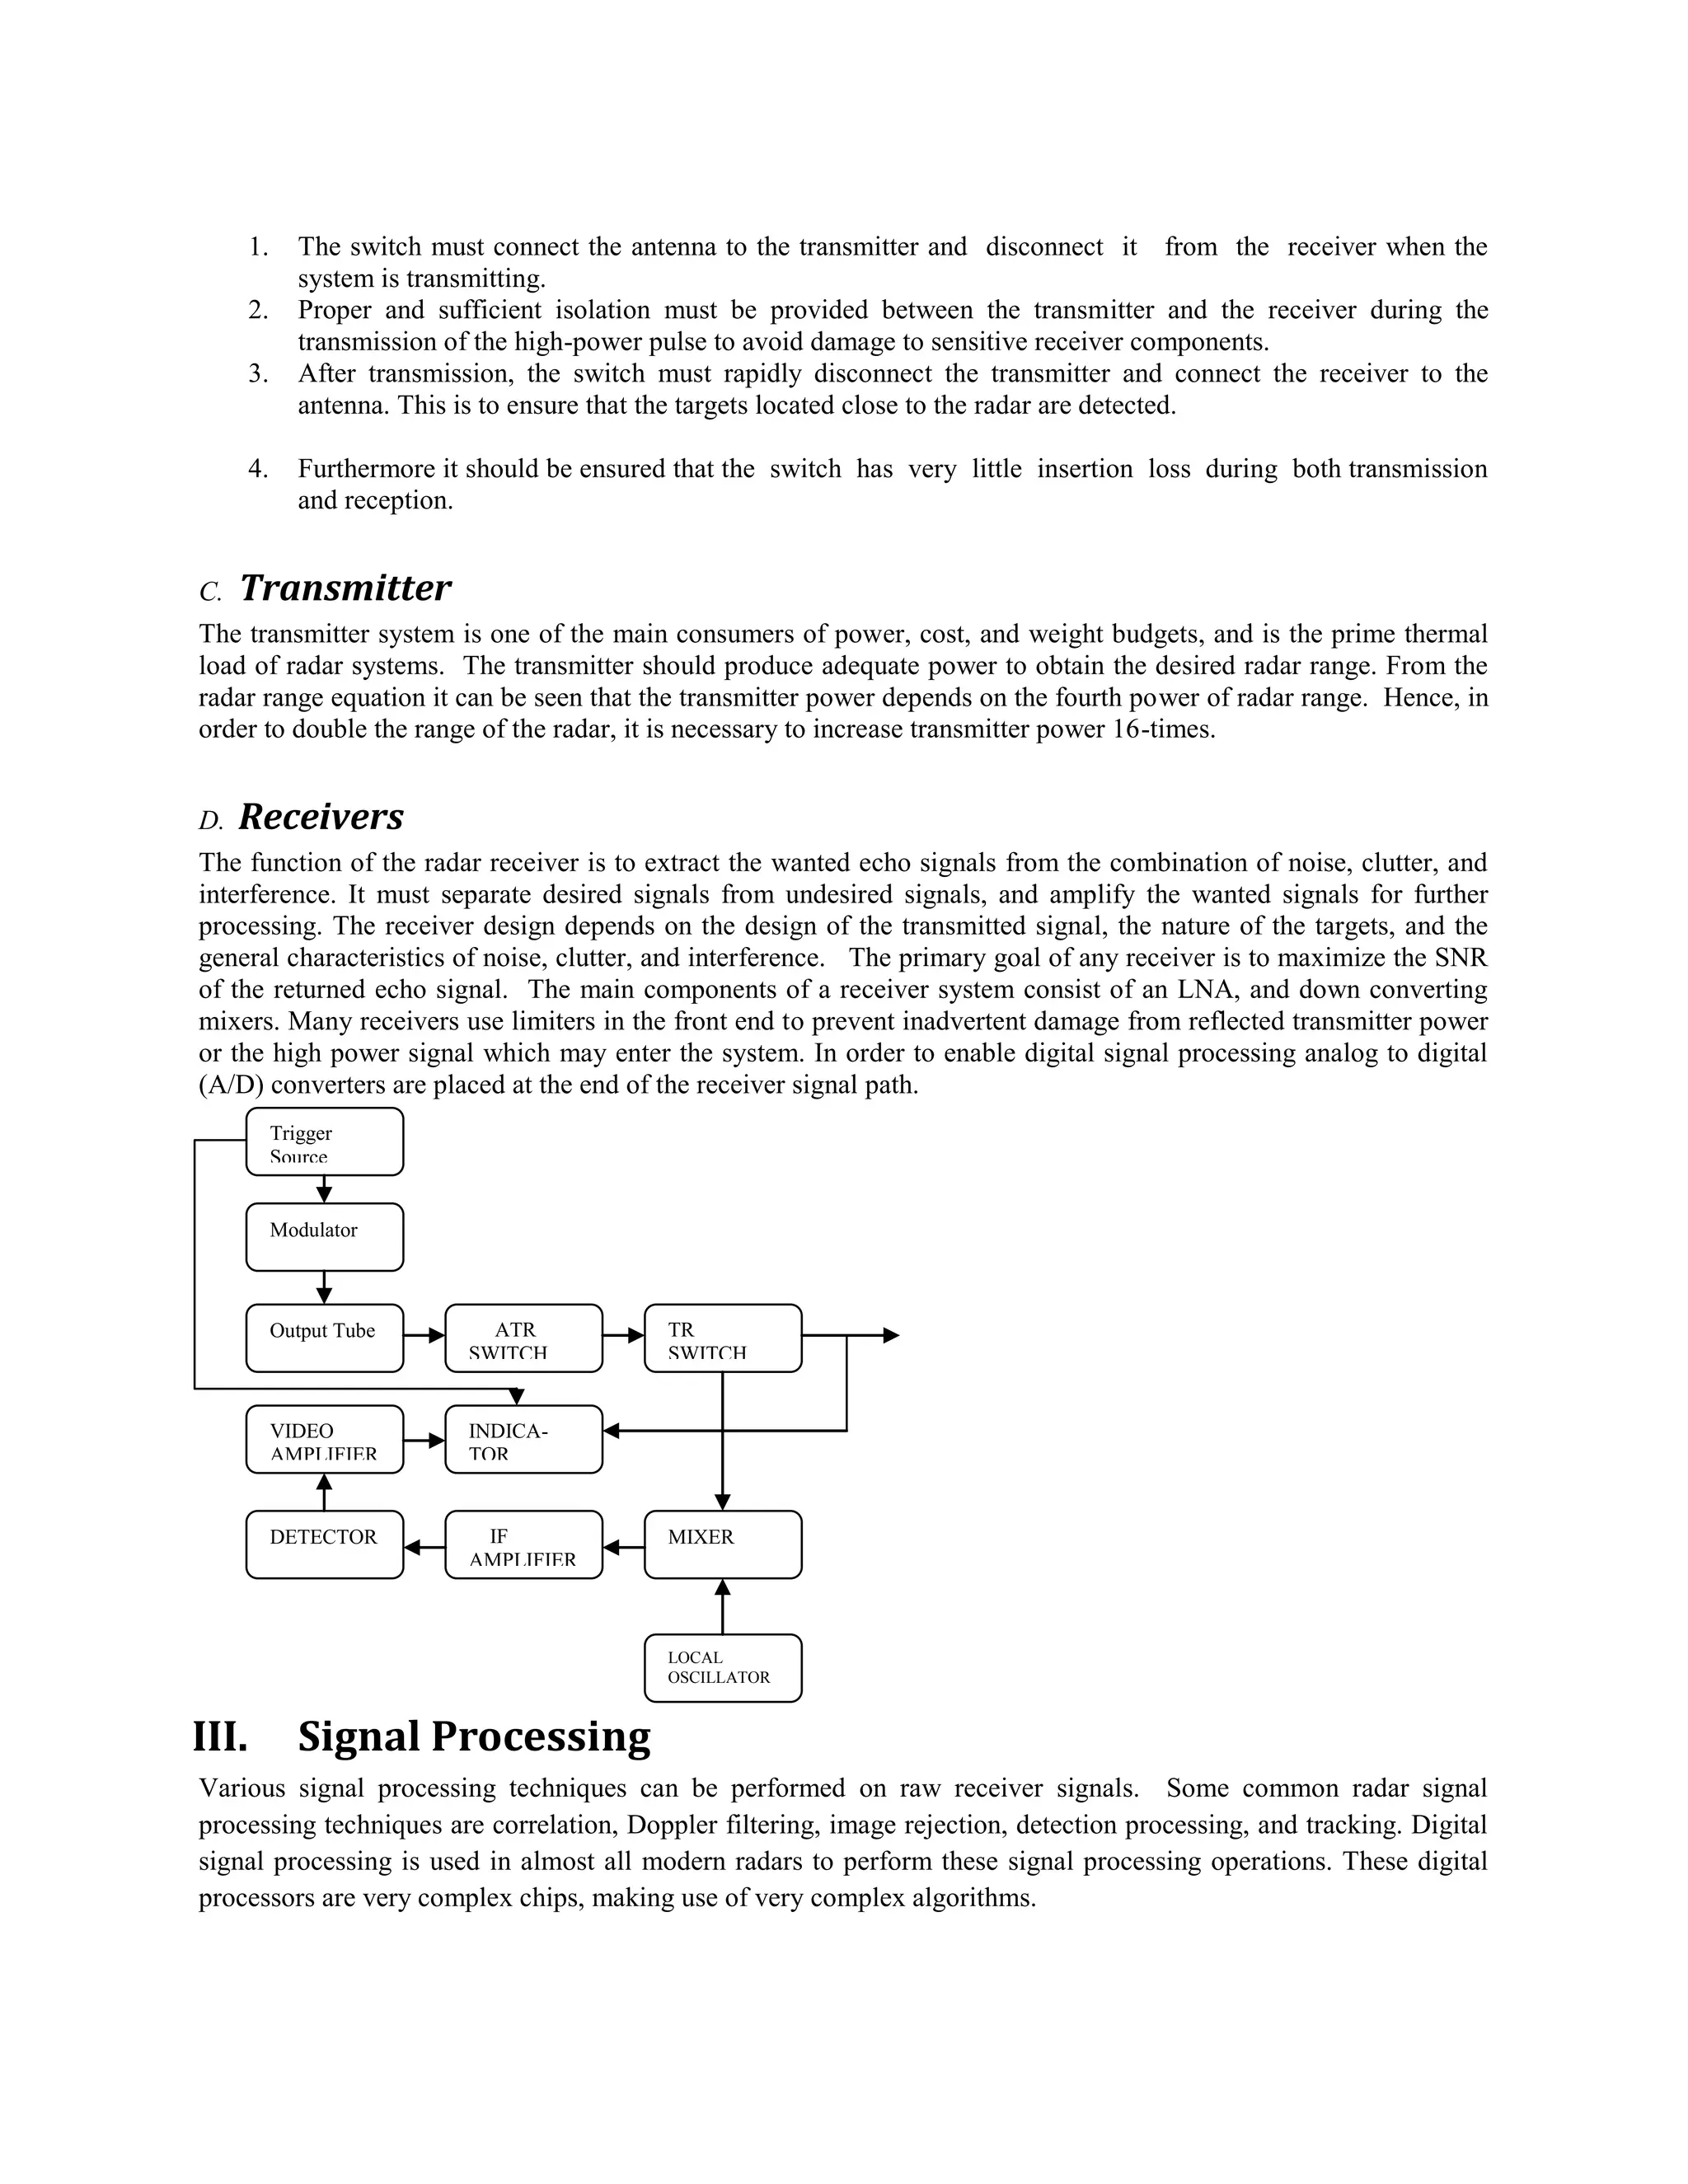
This document discusses subsystems of radar and signal processing, specifically focusing on ST (Stratosphere Troposphere) radar. It begins by introducing the goals of understanding basic radar concepts and studying ST radar. It then provides an overview of key radar subsystems including antennas, duplexers, transmitters, and receivers. The document concludes by describing common signal processing techniques used in radar like correlation, Doppler filtering, and detection processing.