Downloaded 747 times

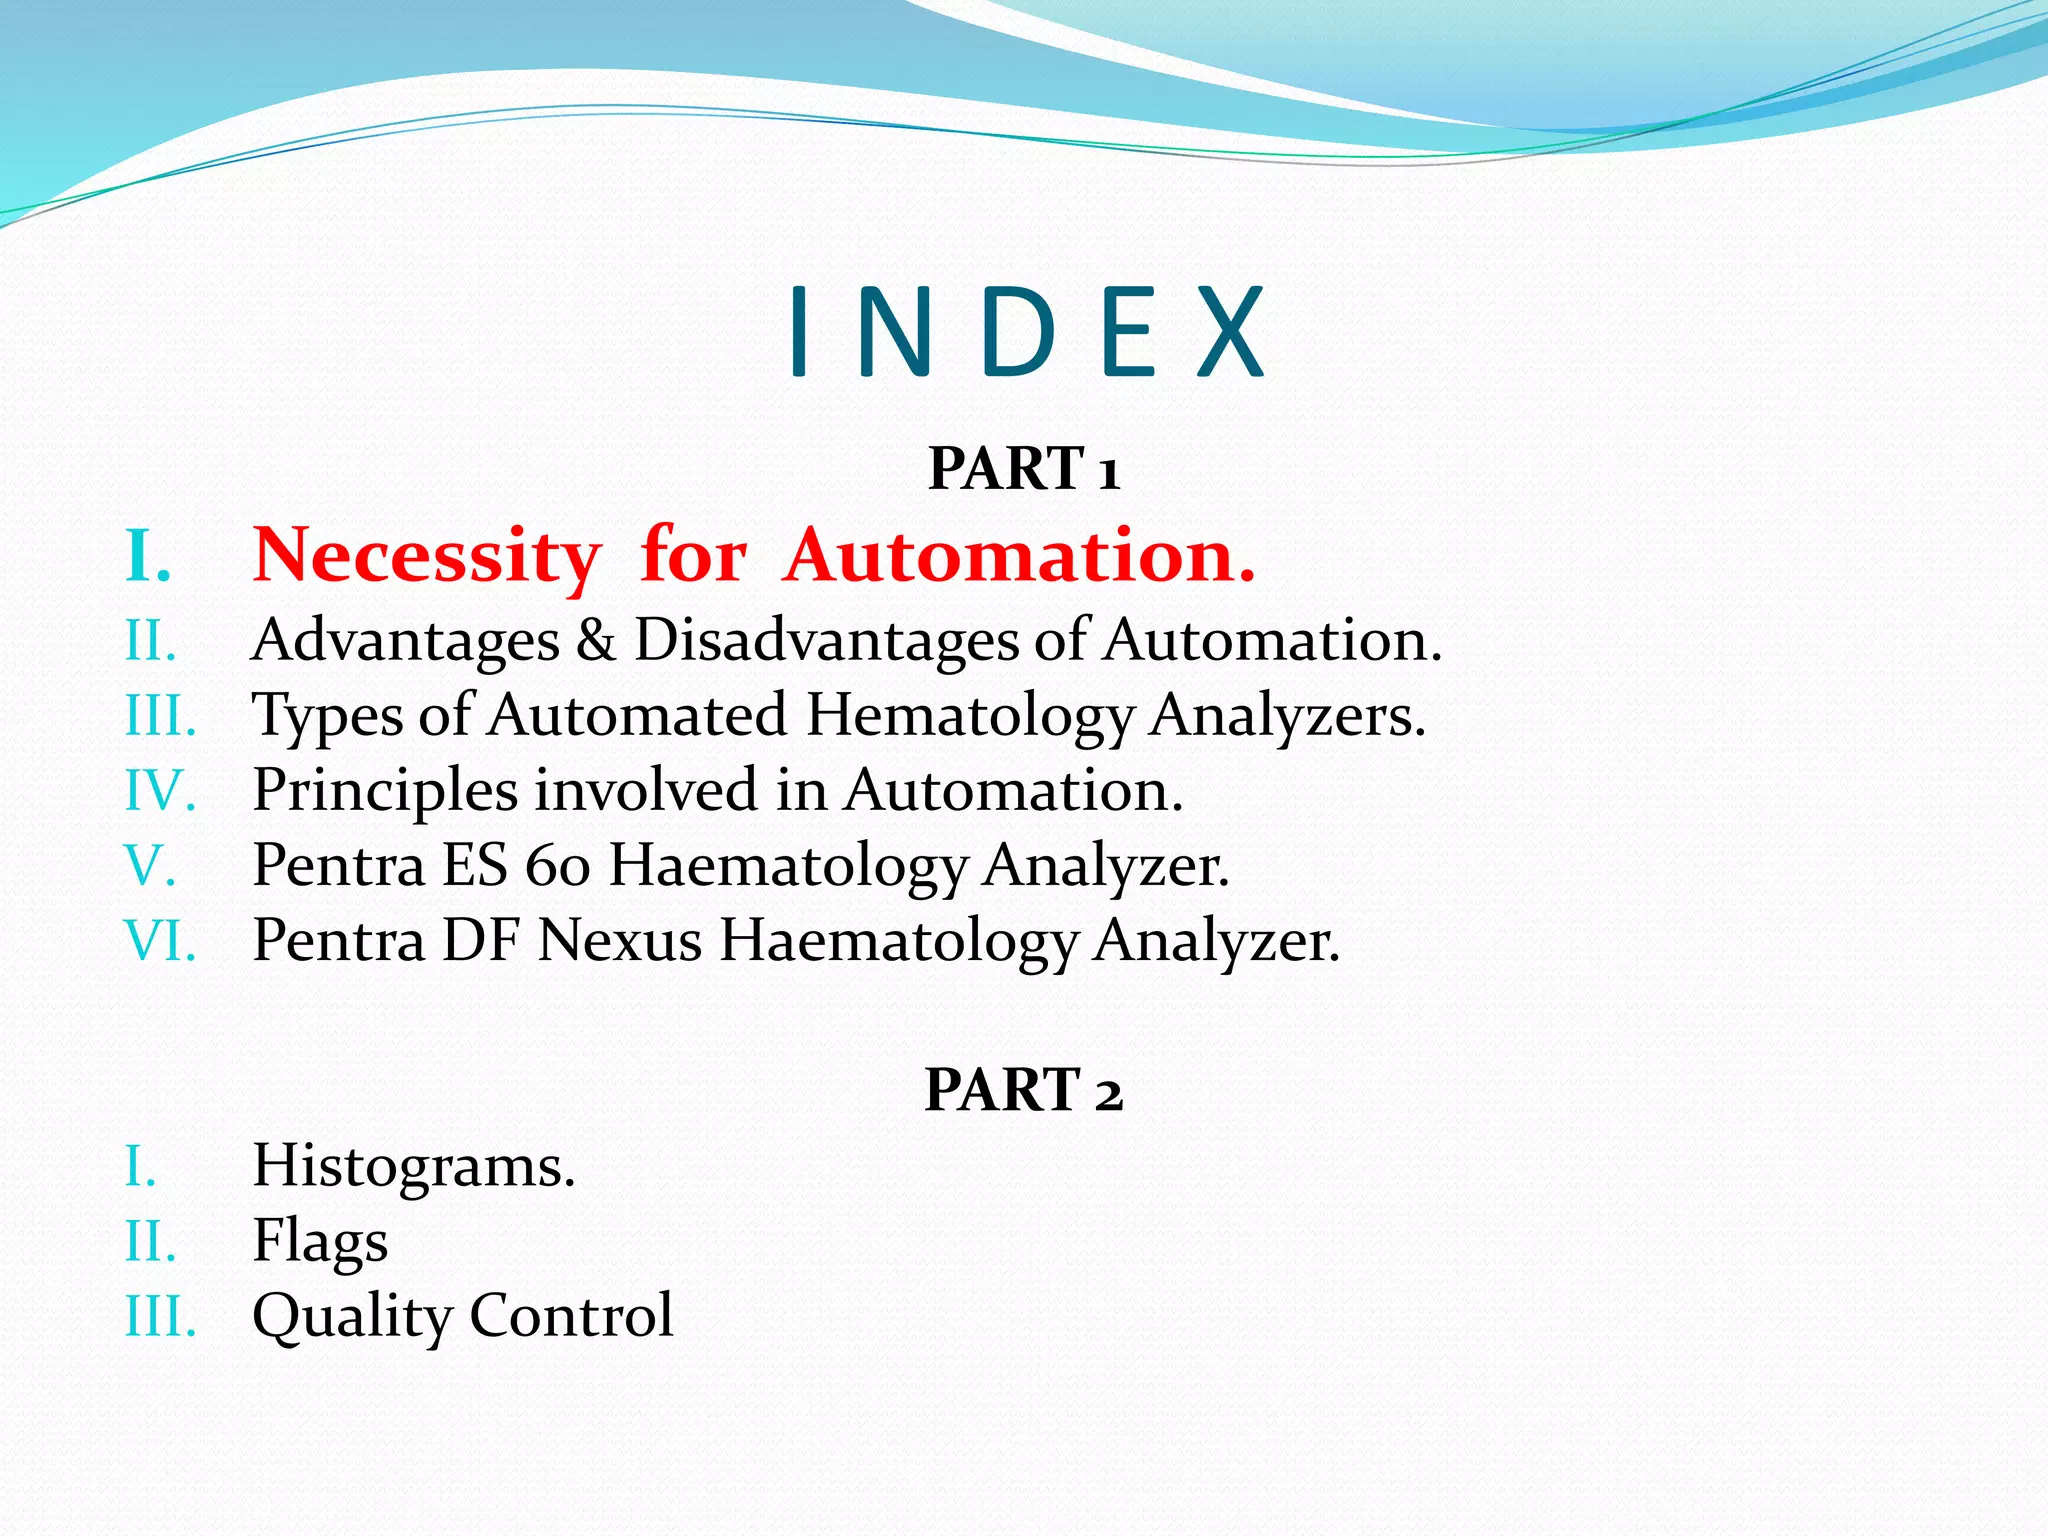
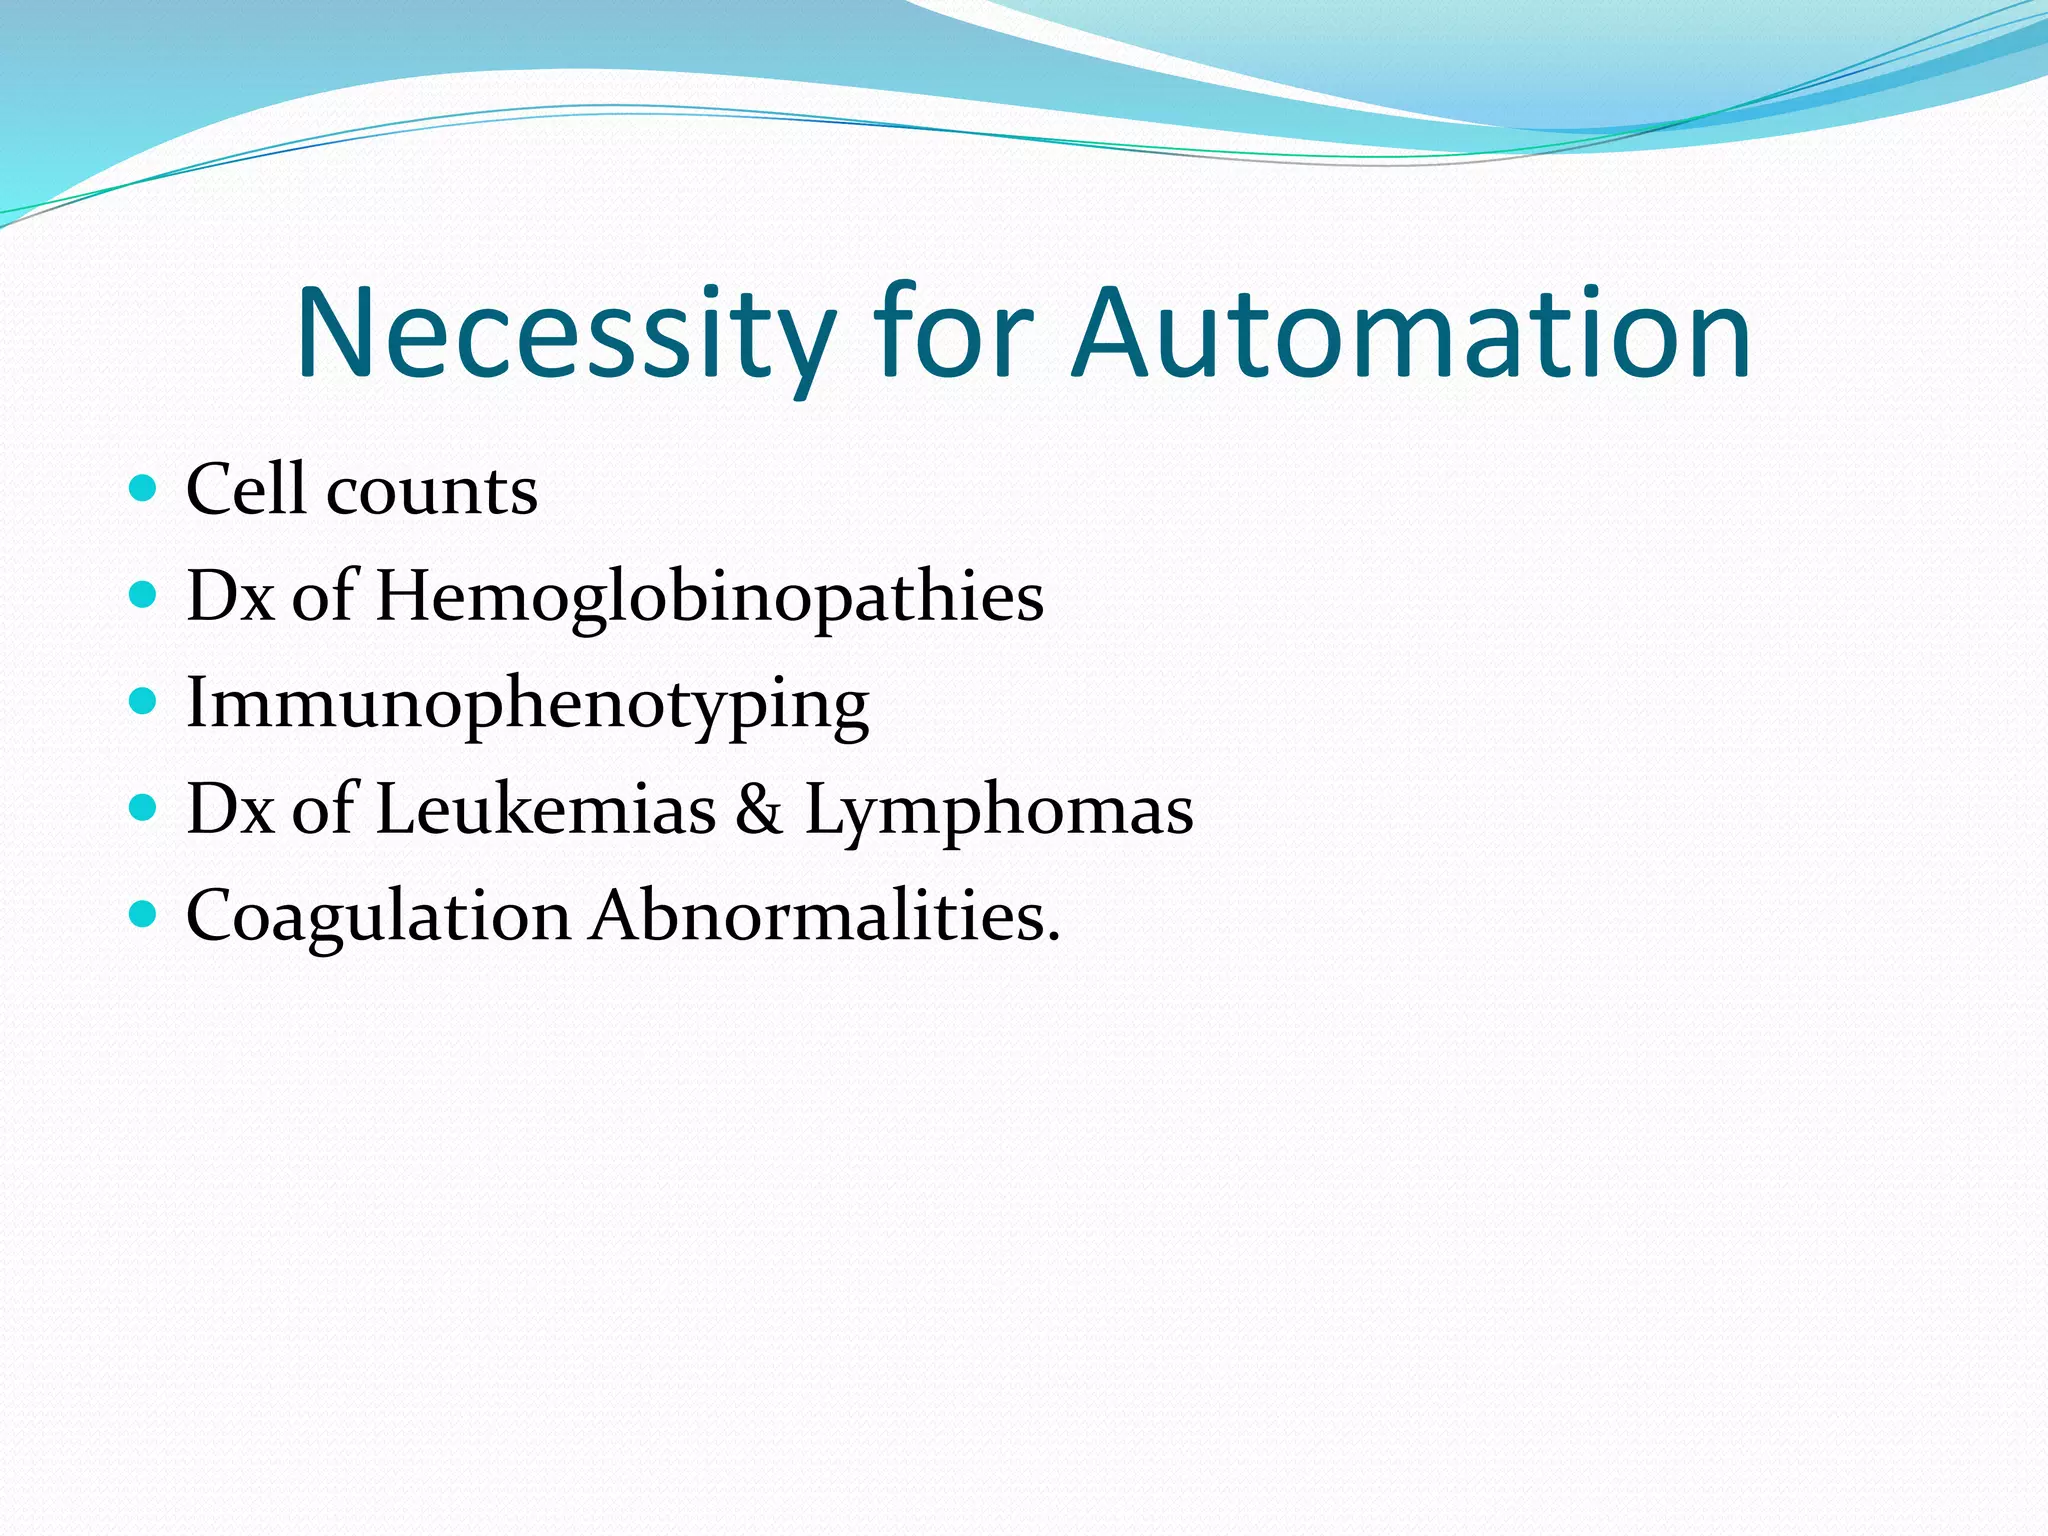
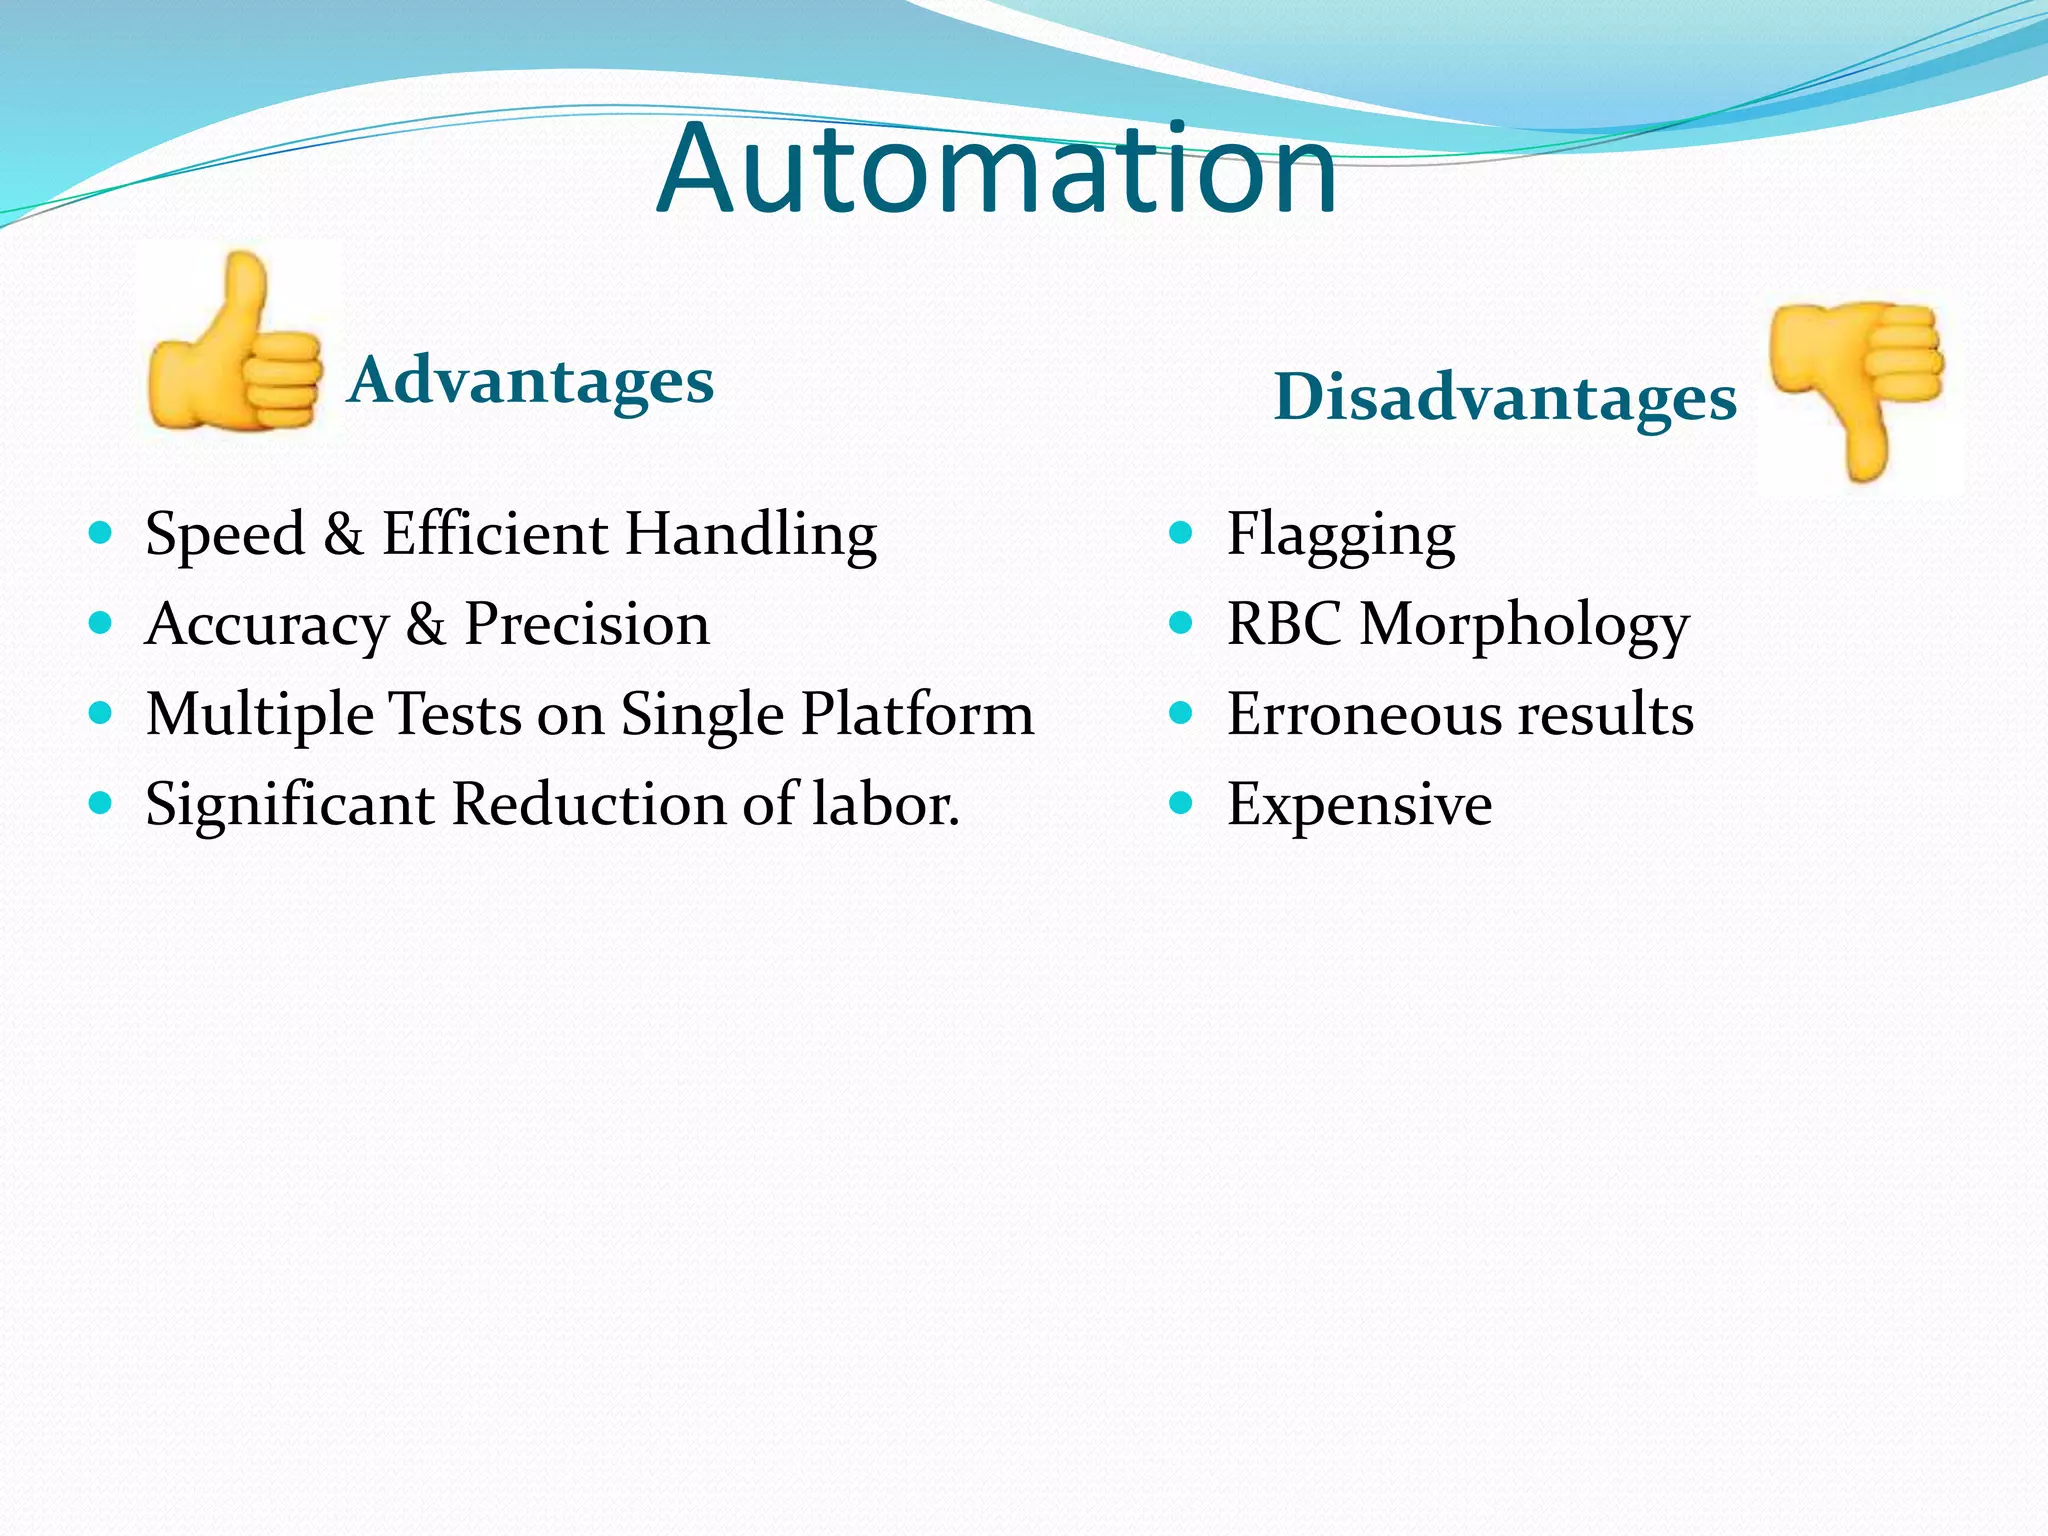
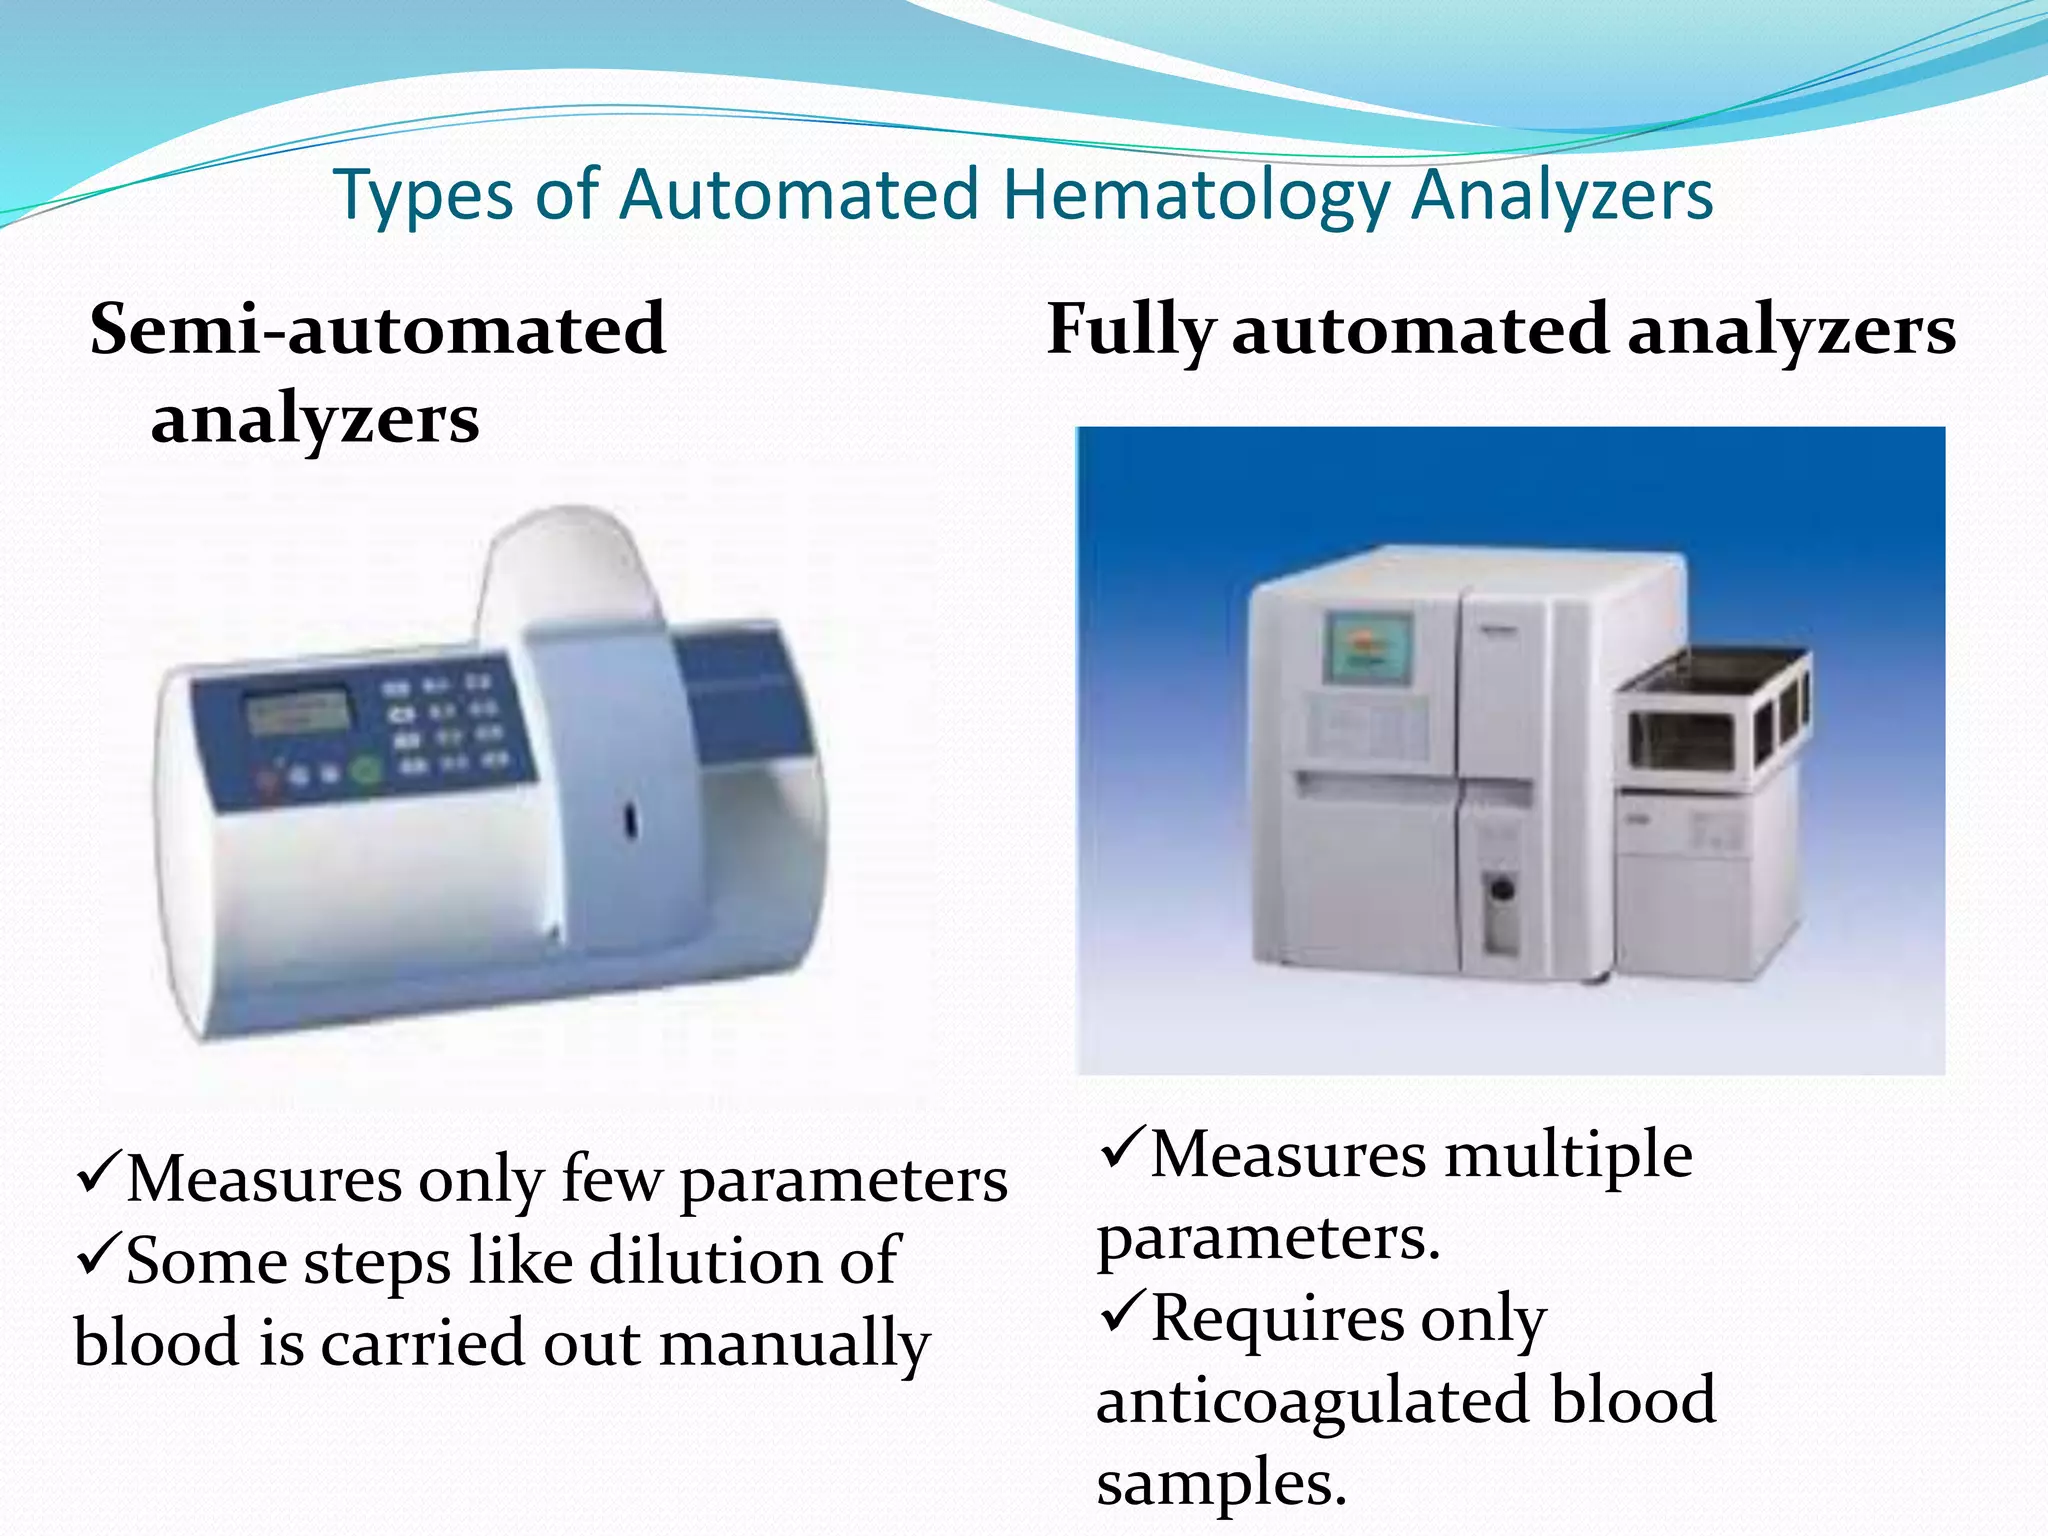
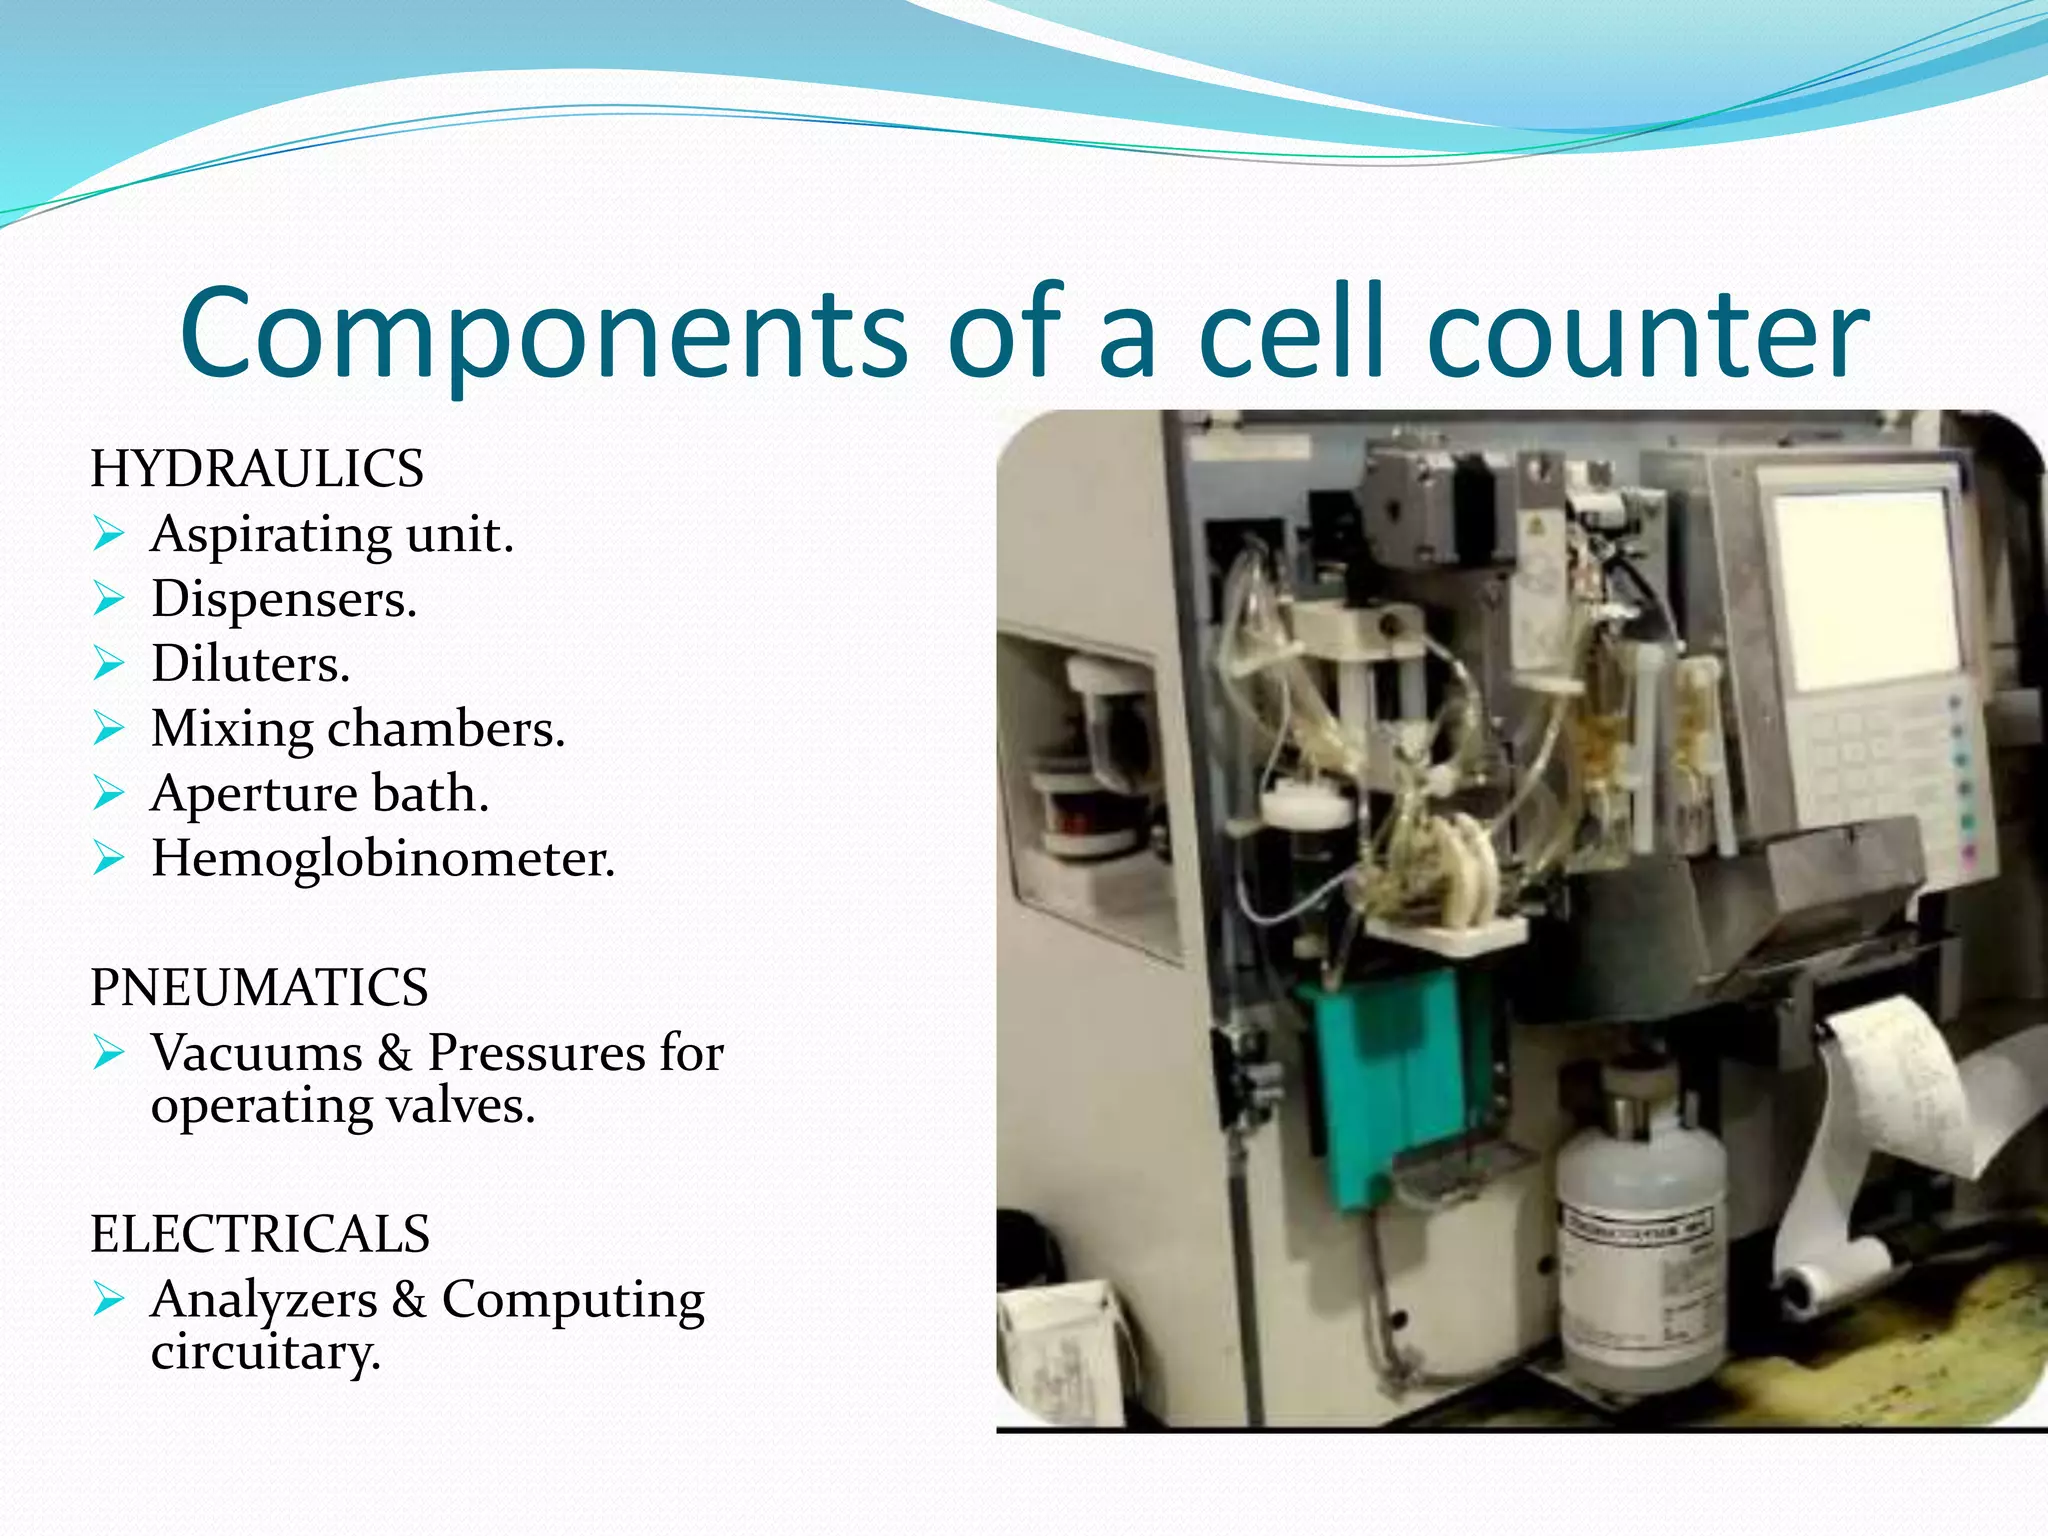
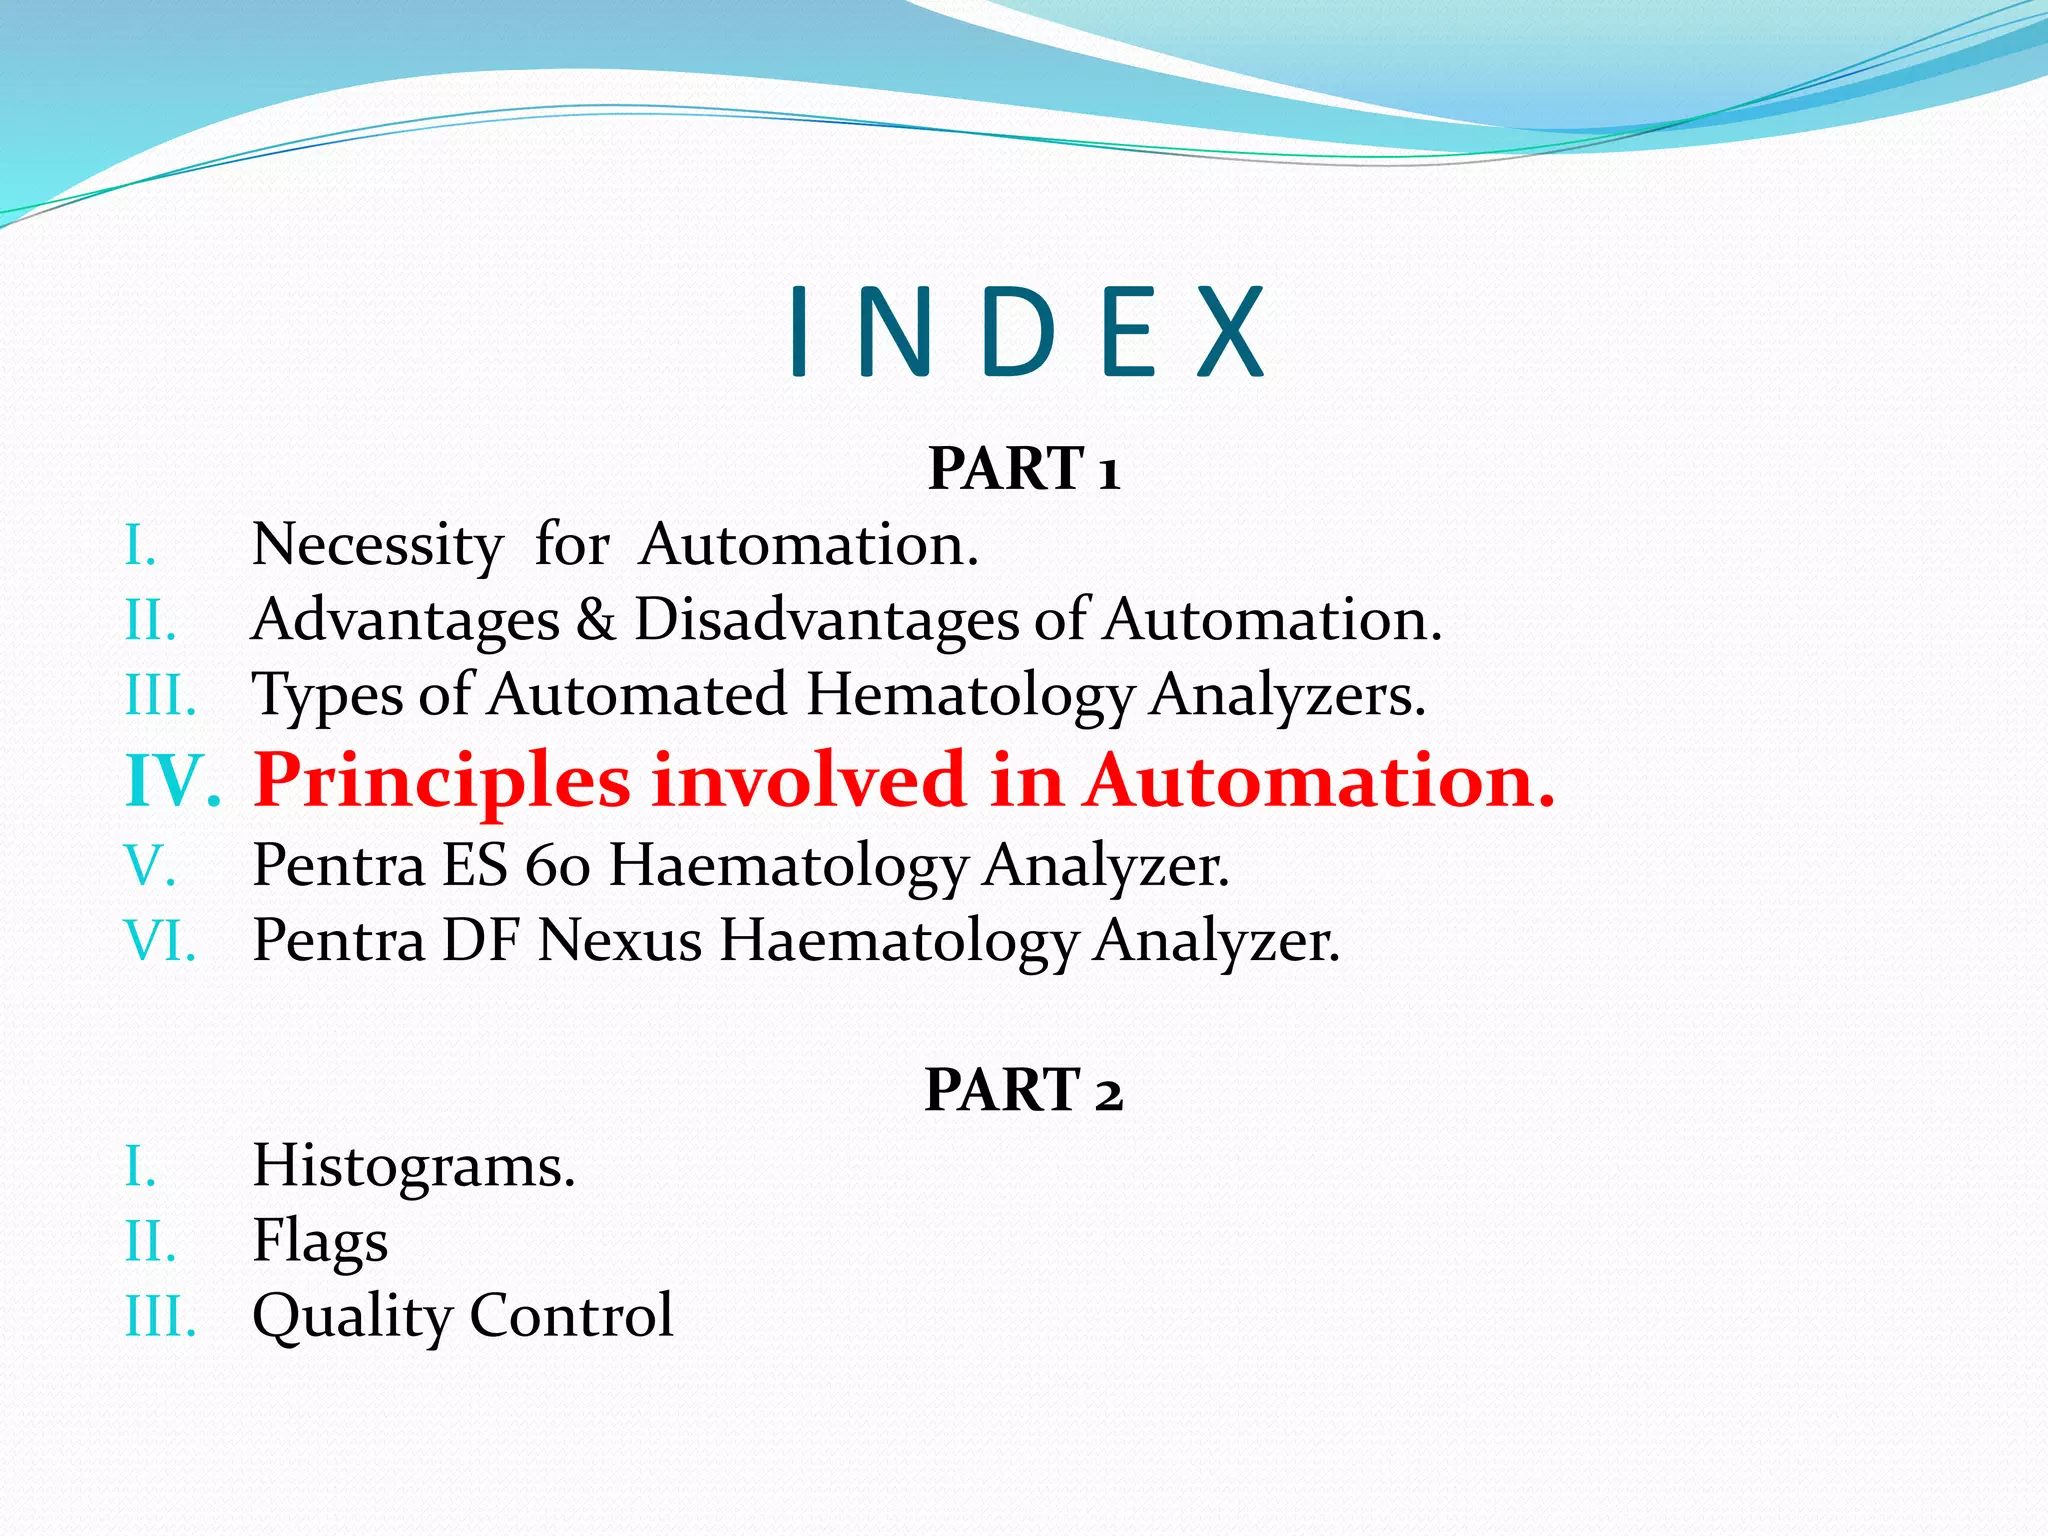
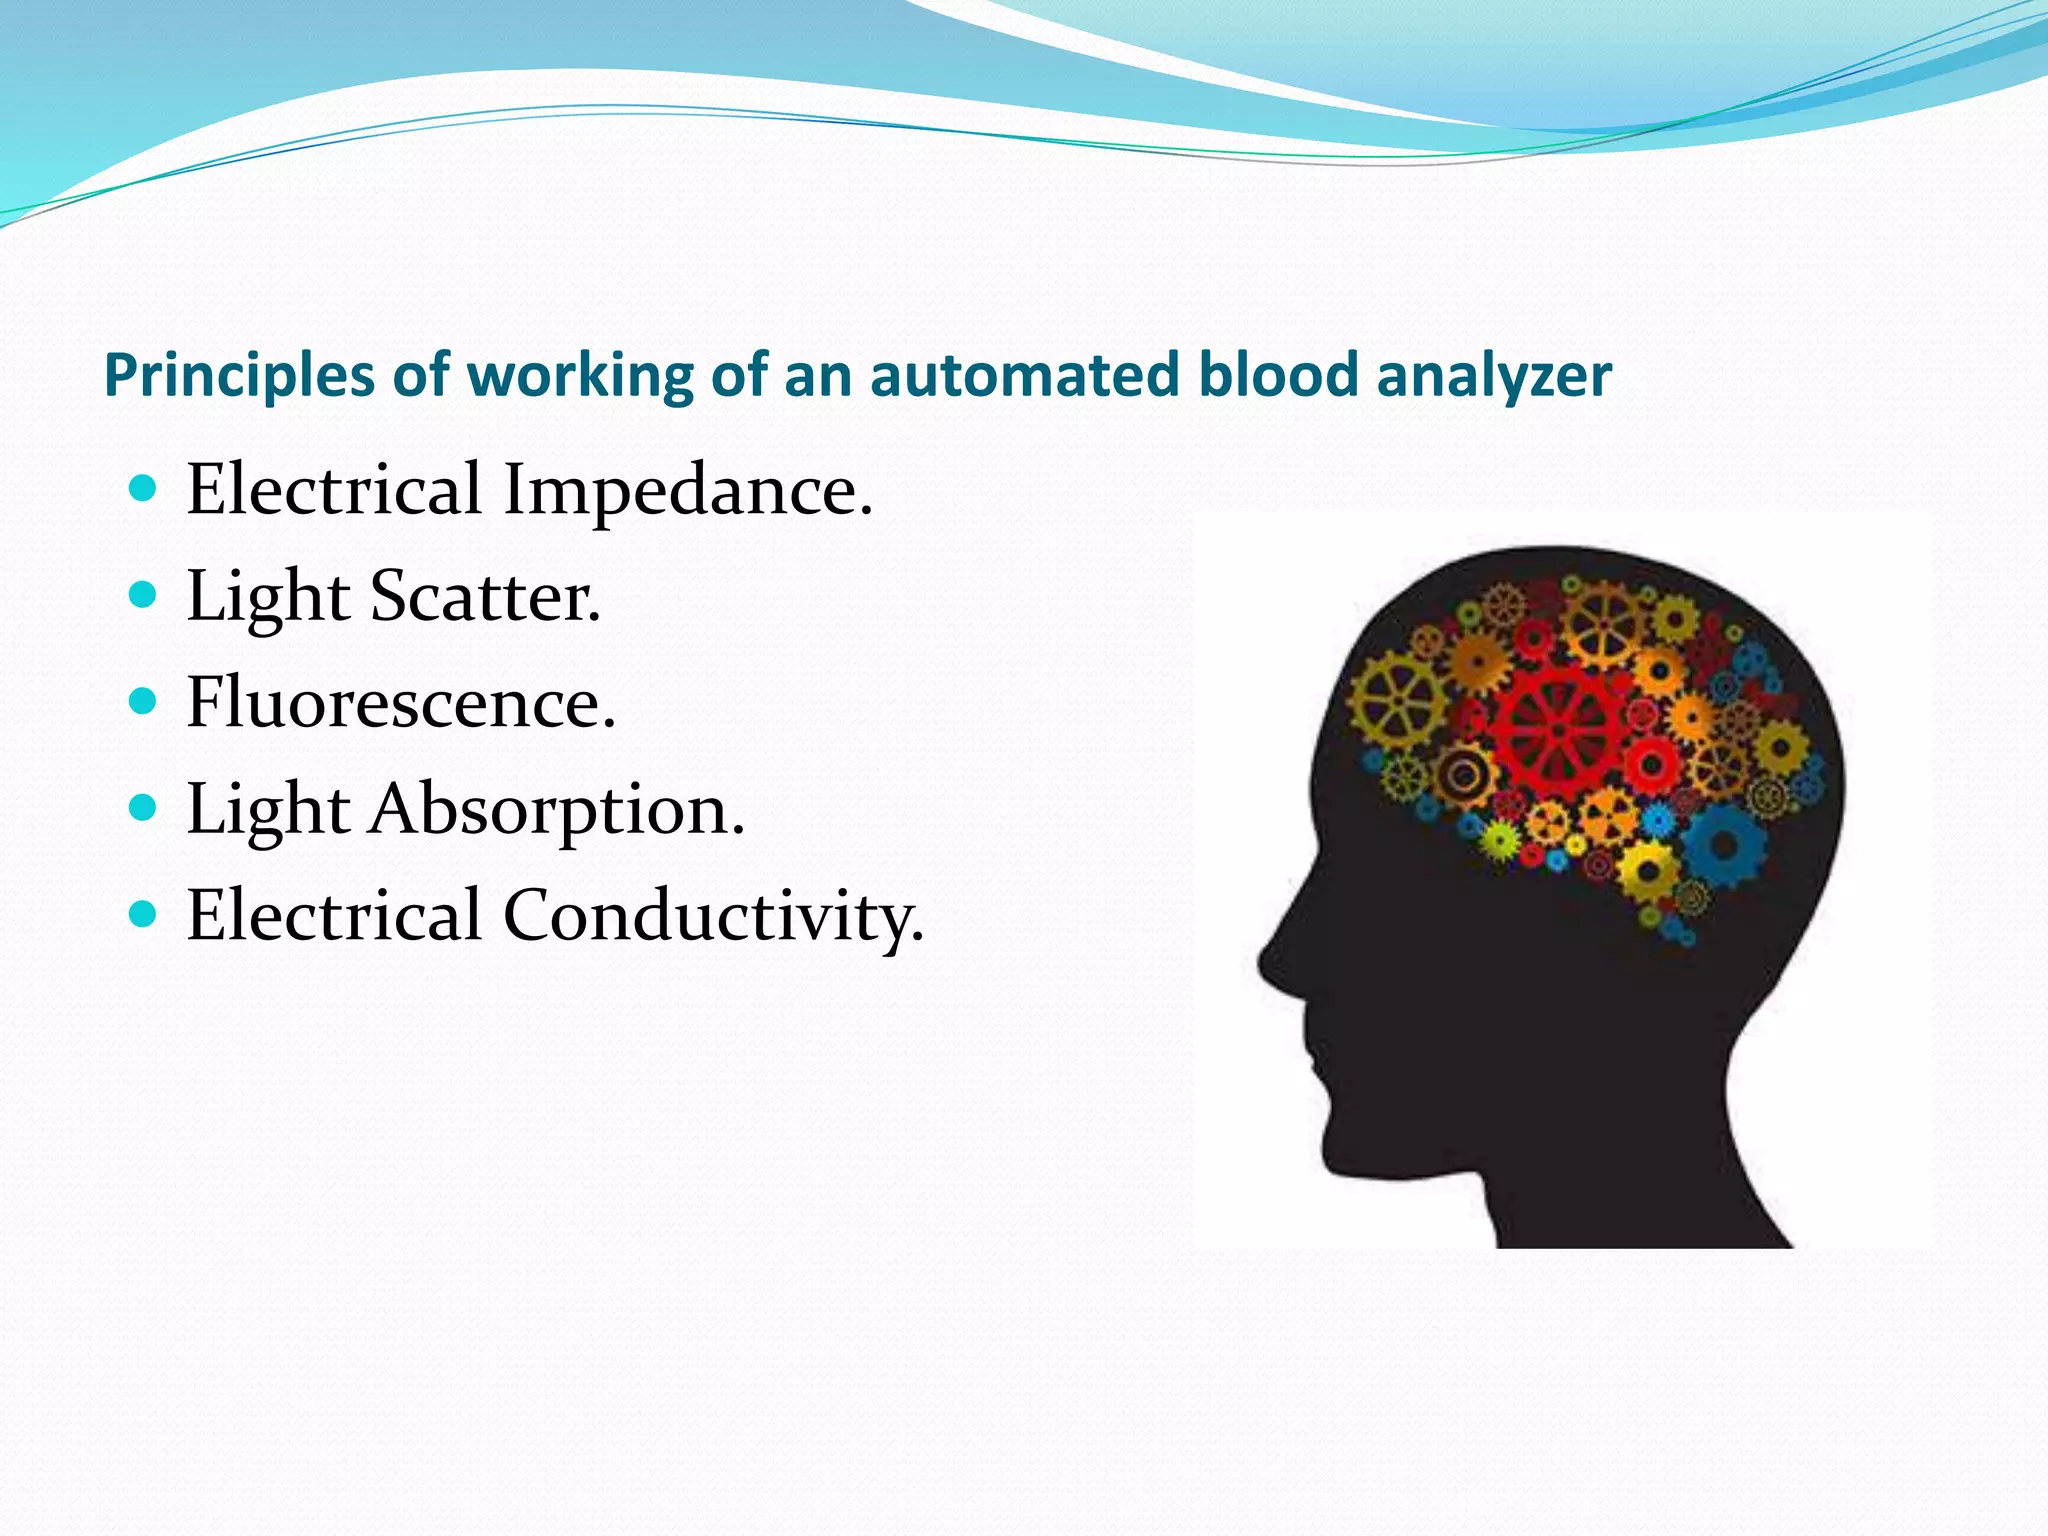
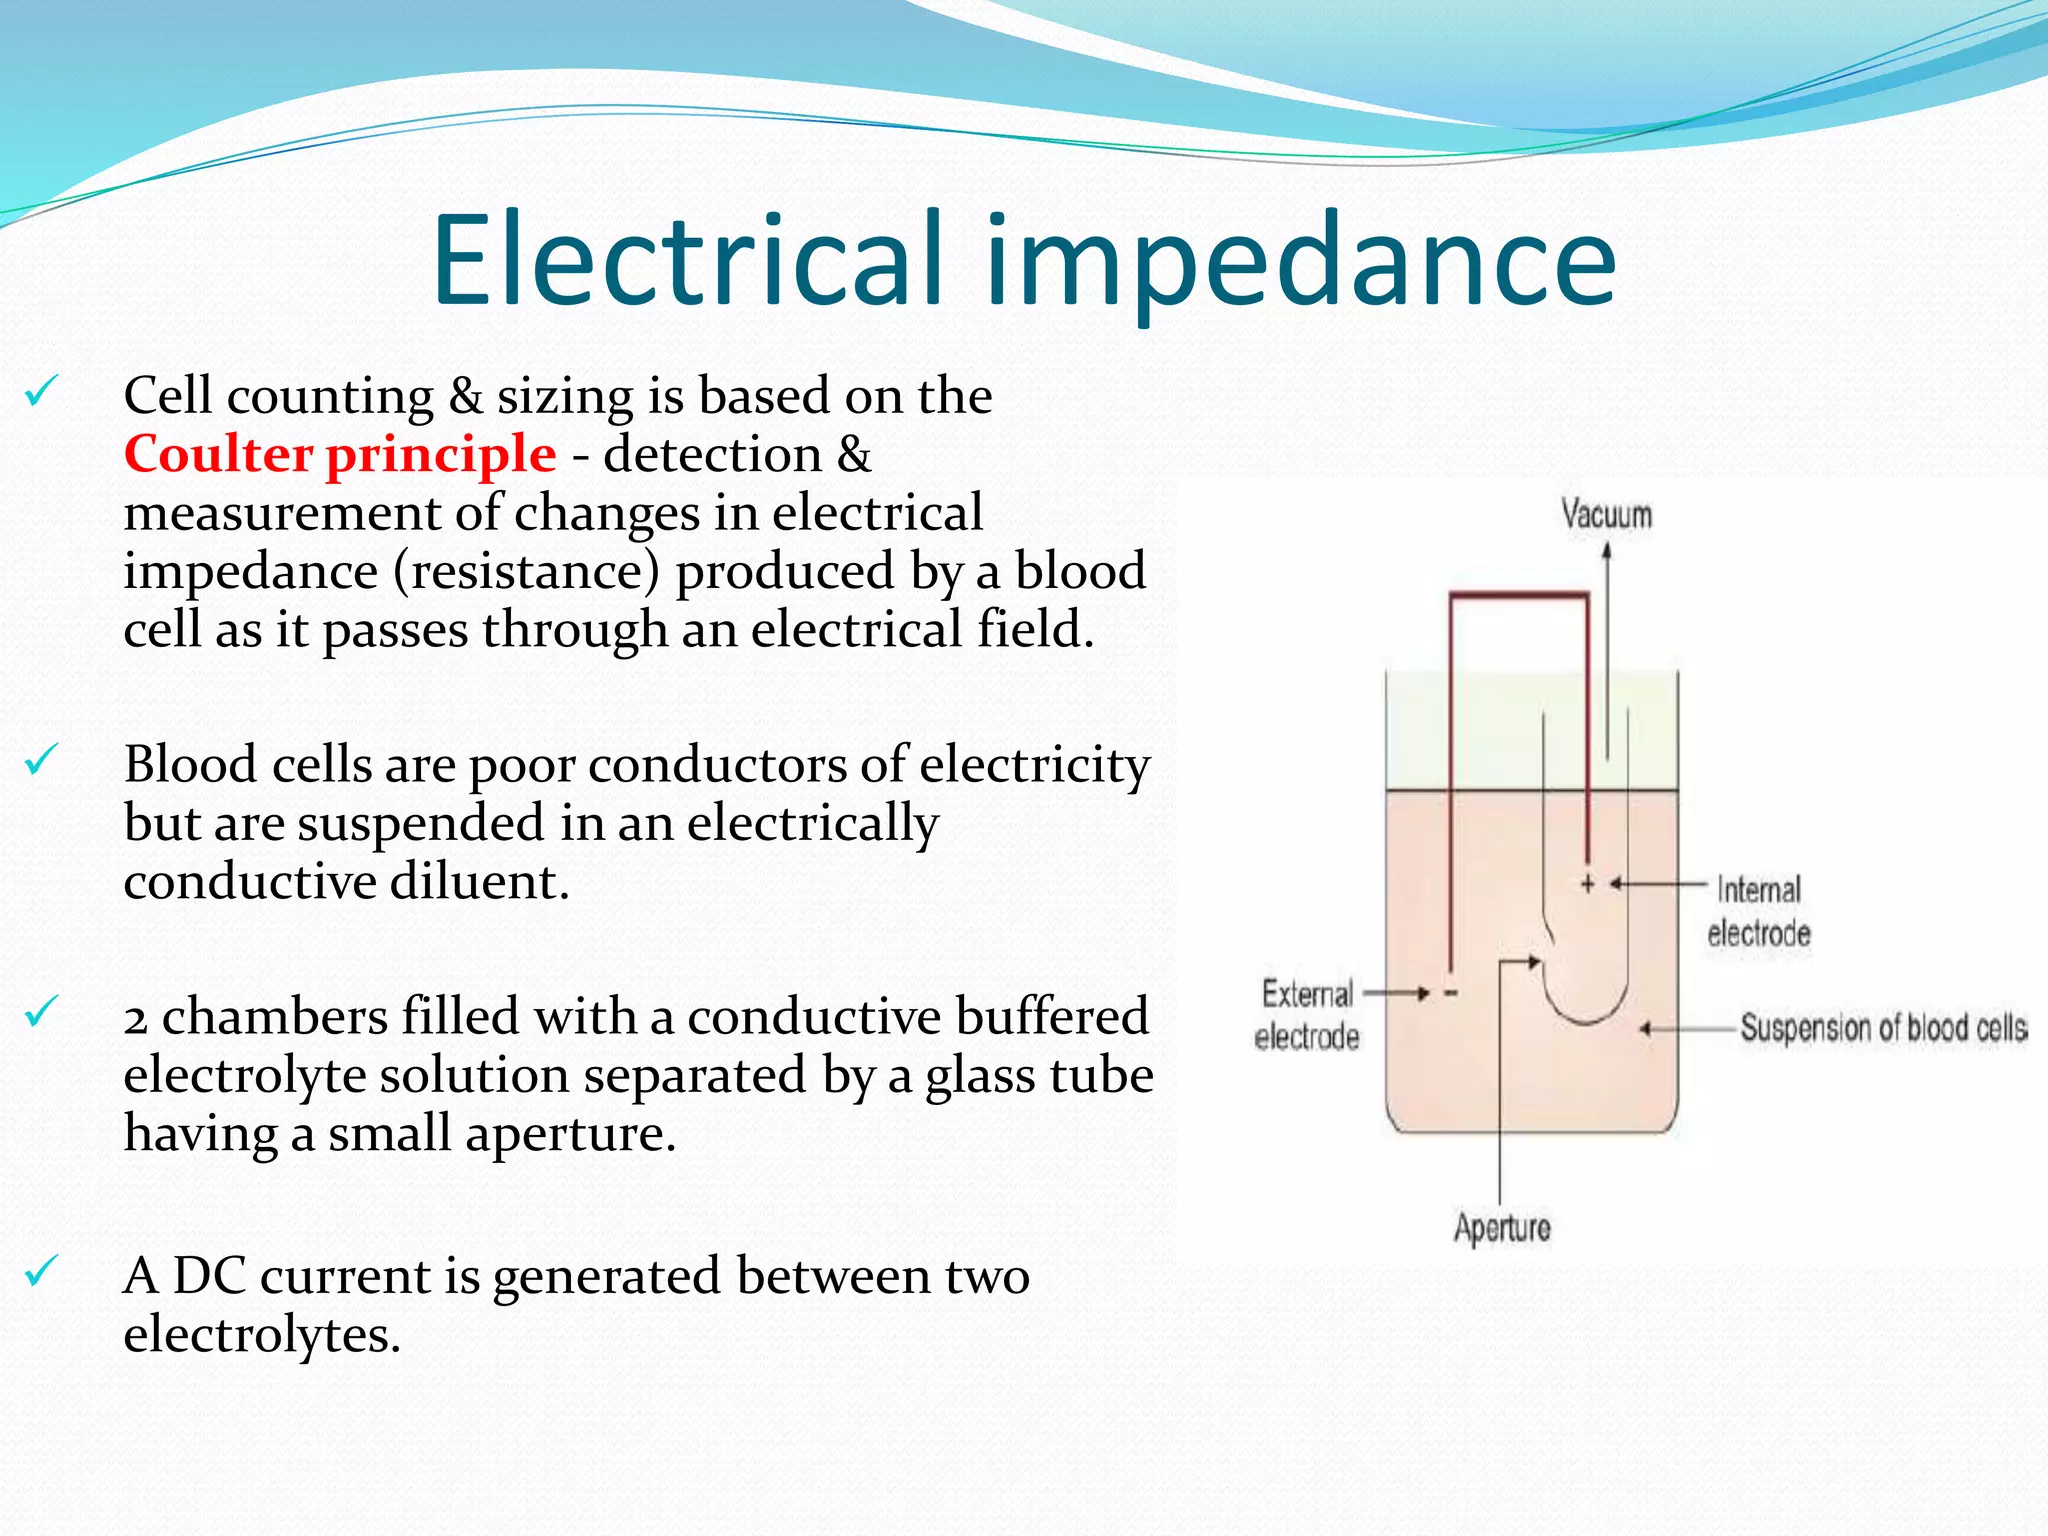
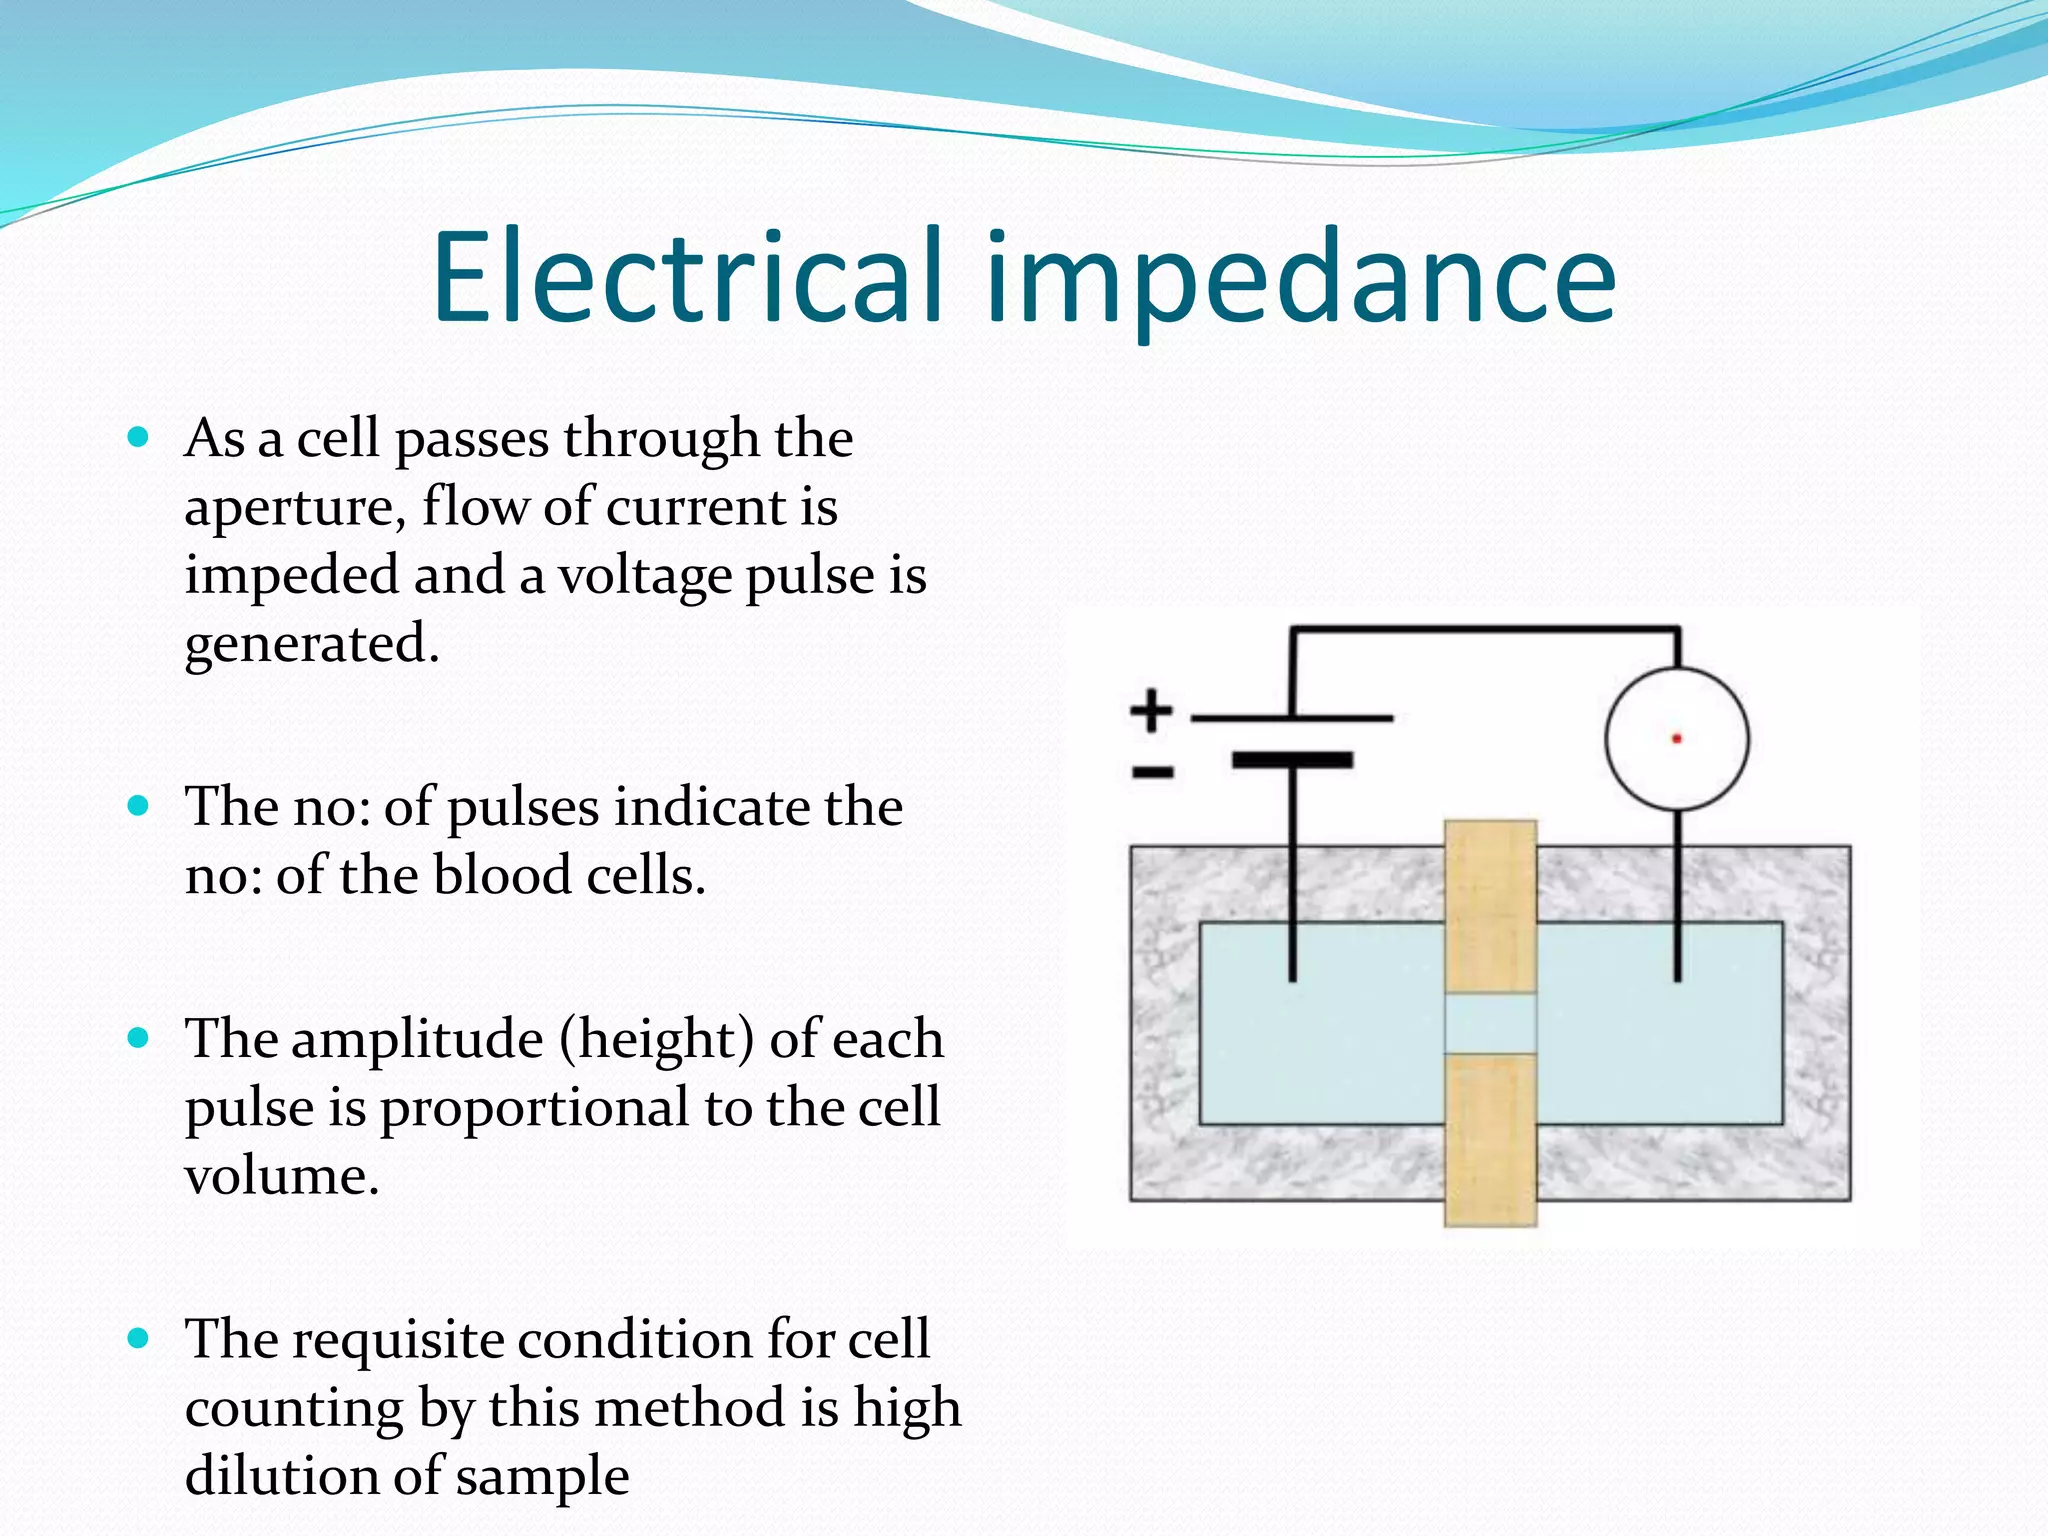
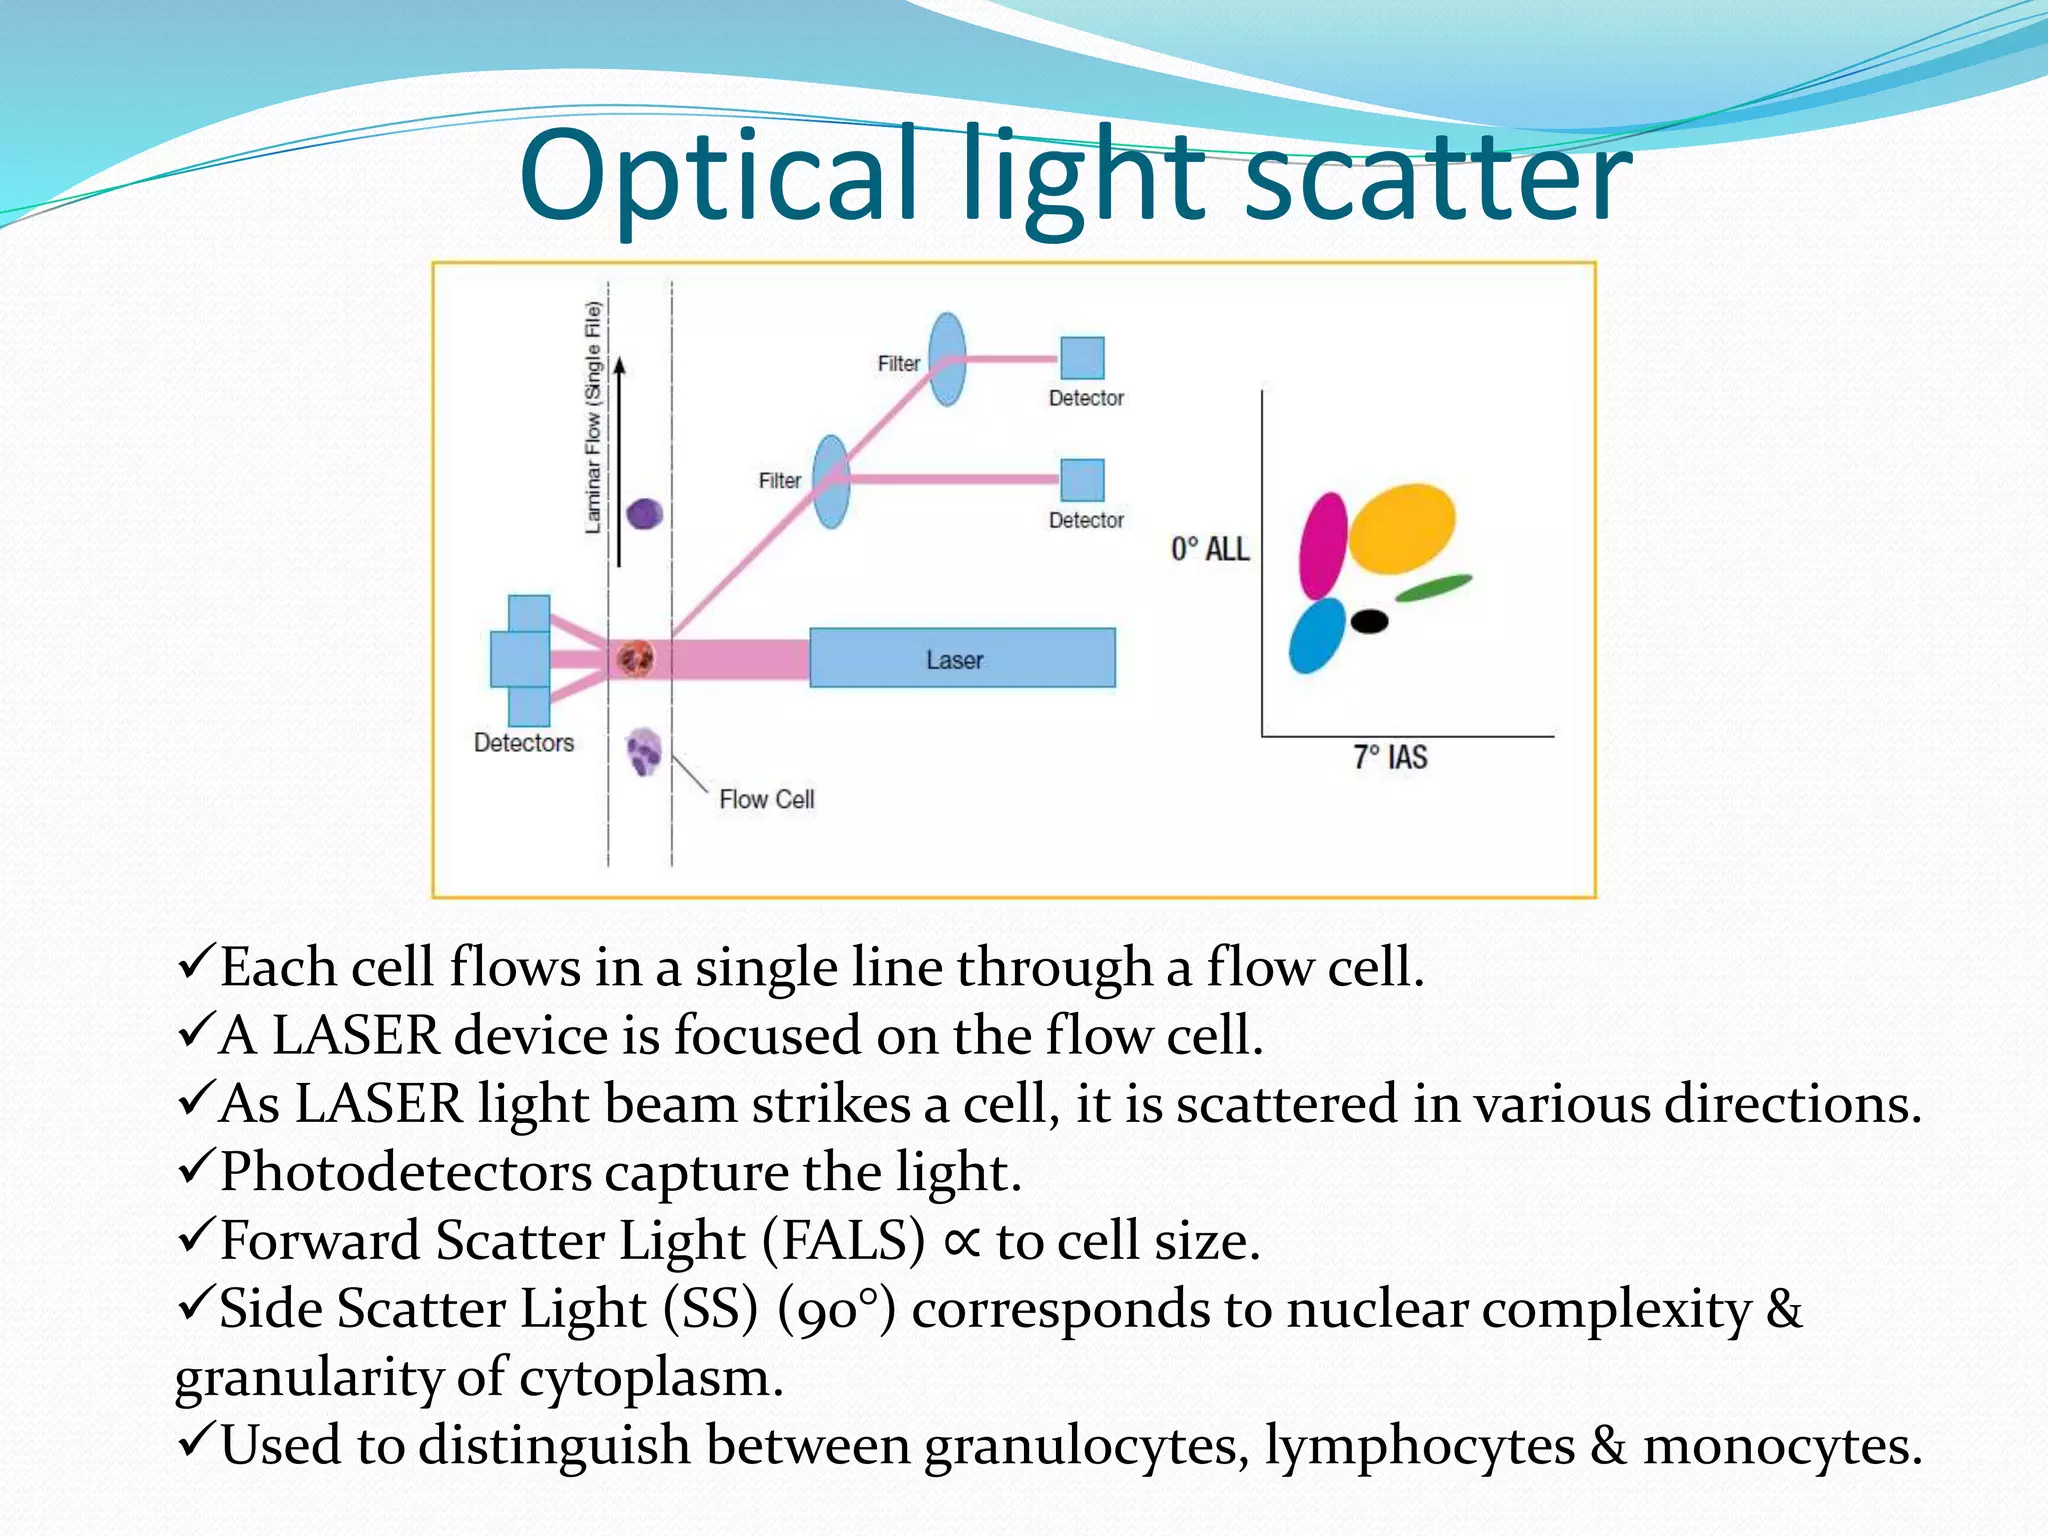
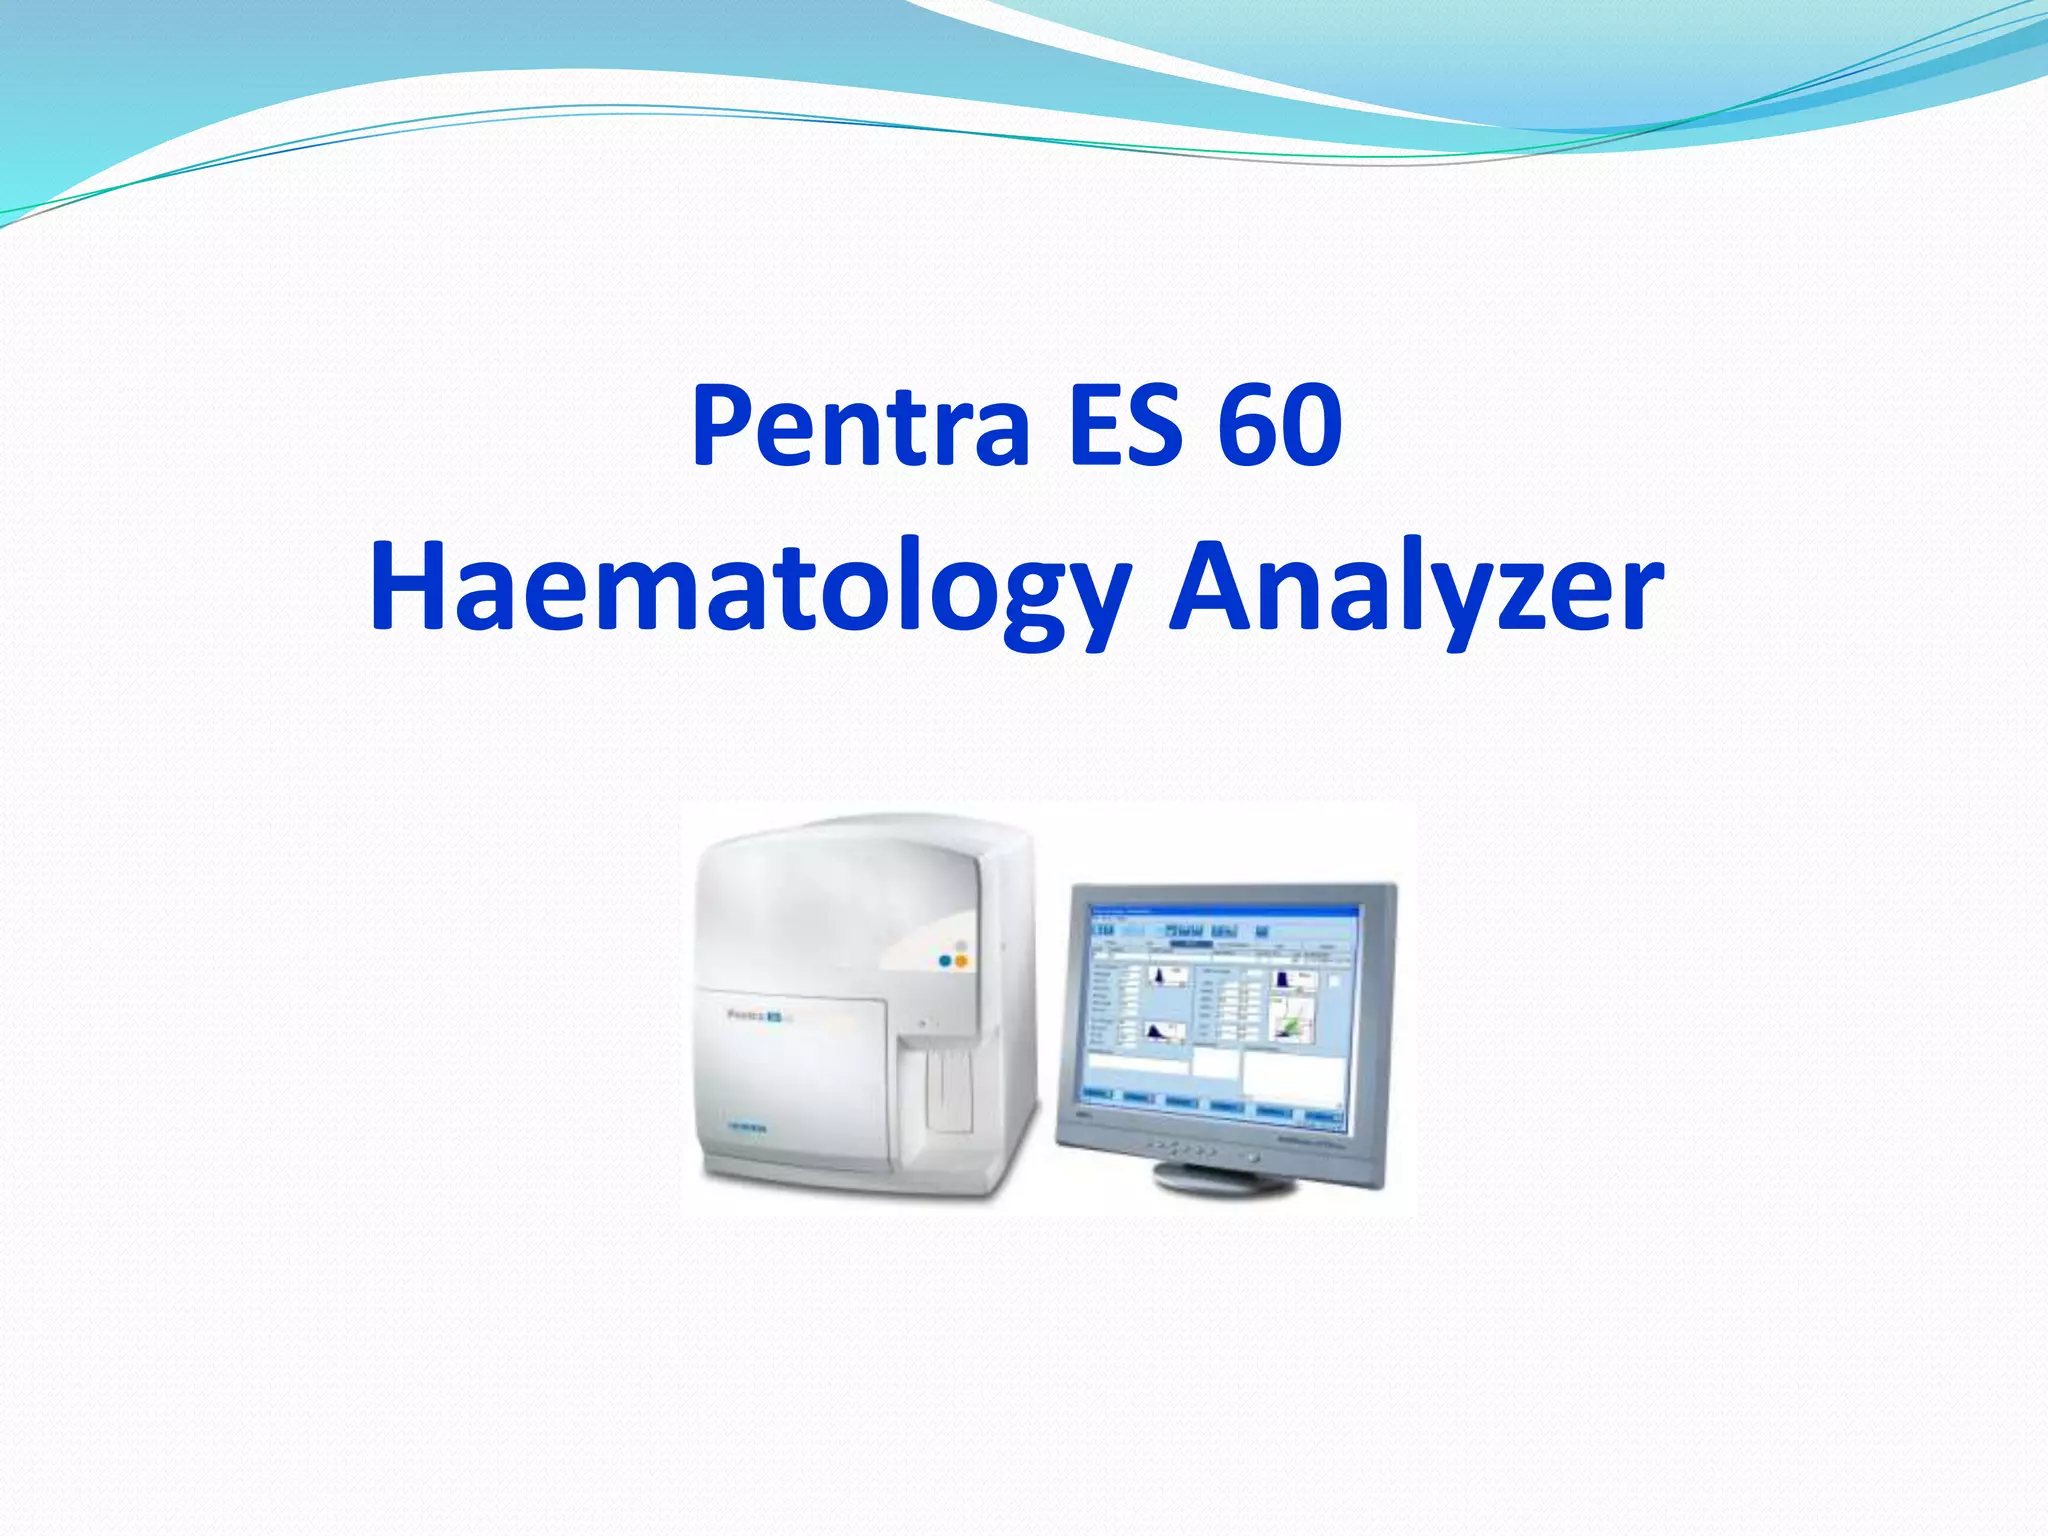
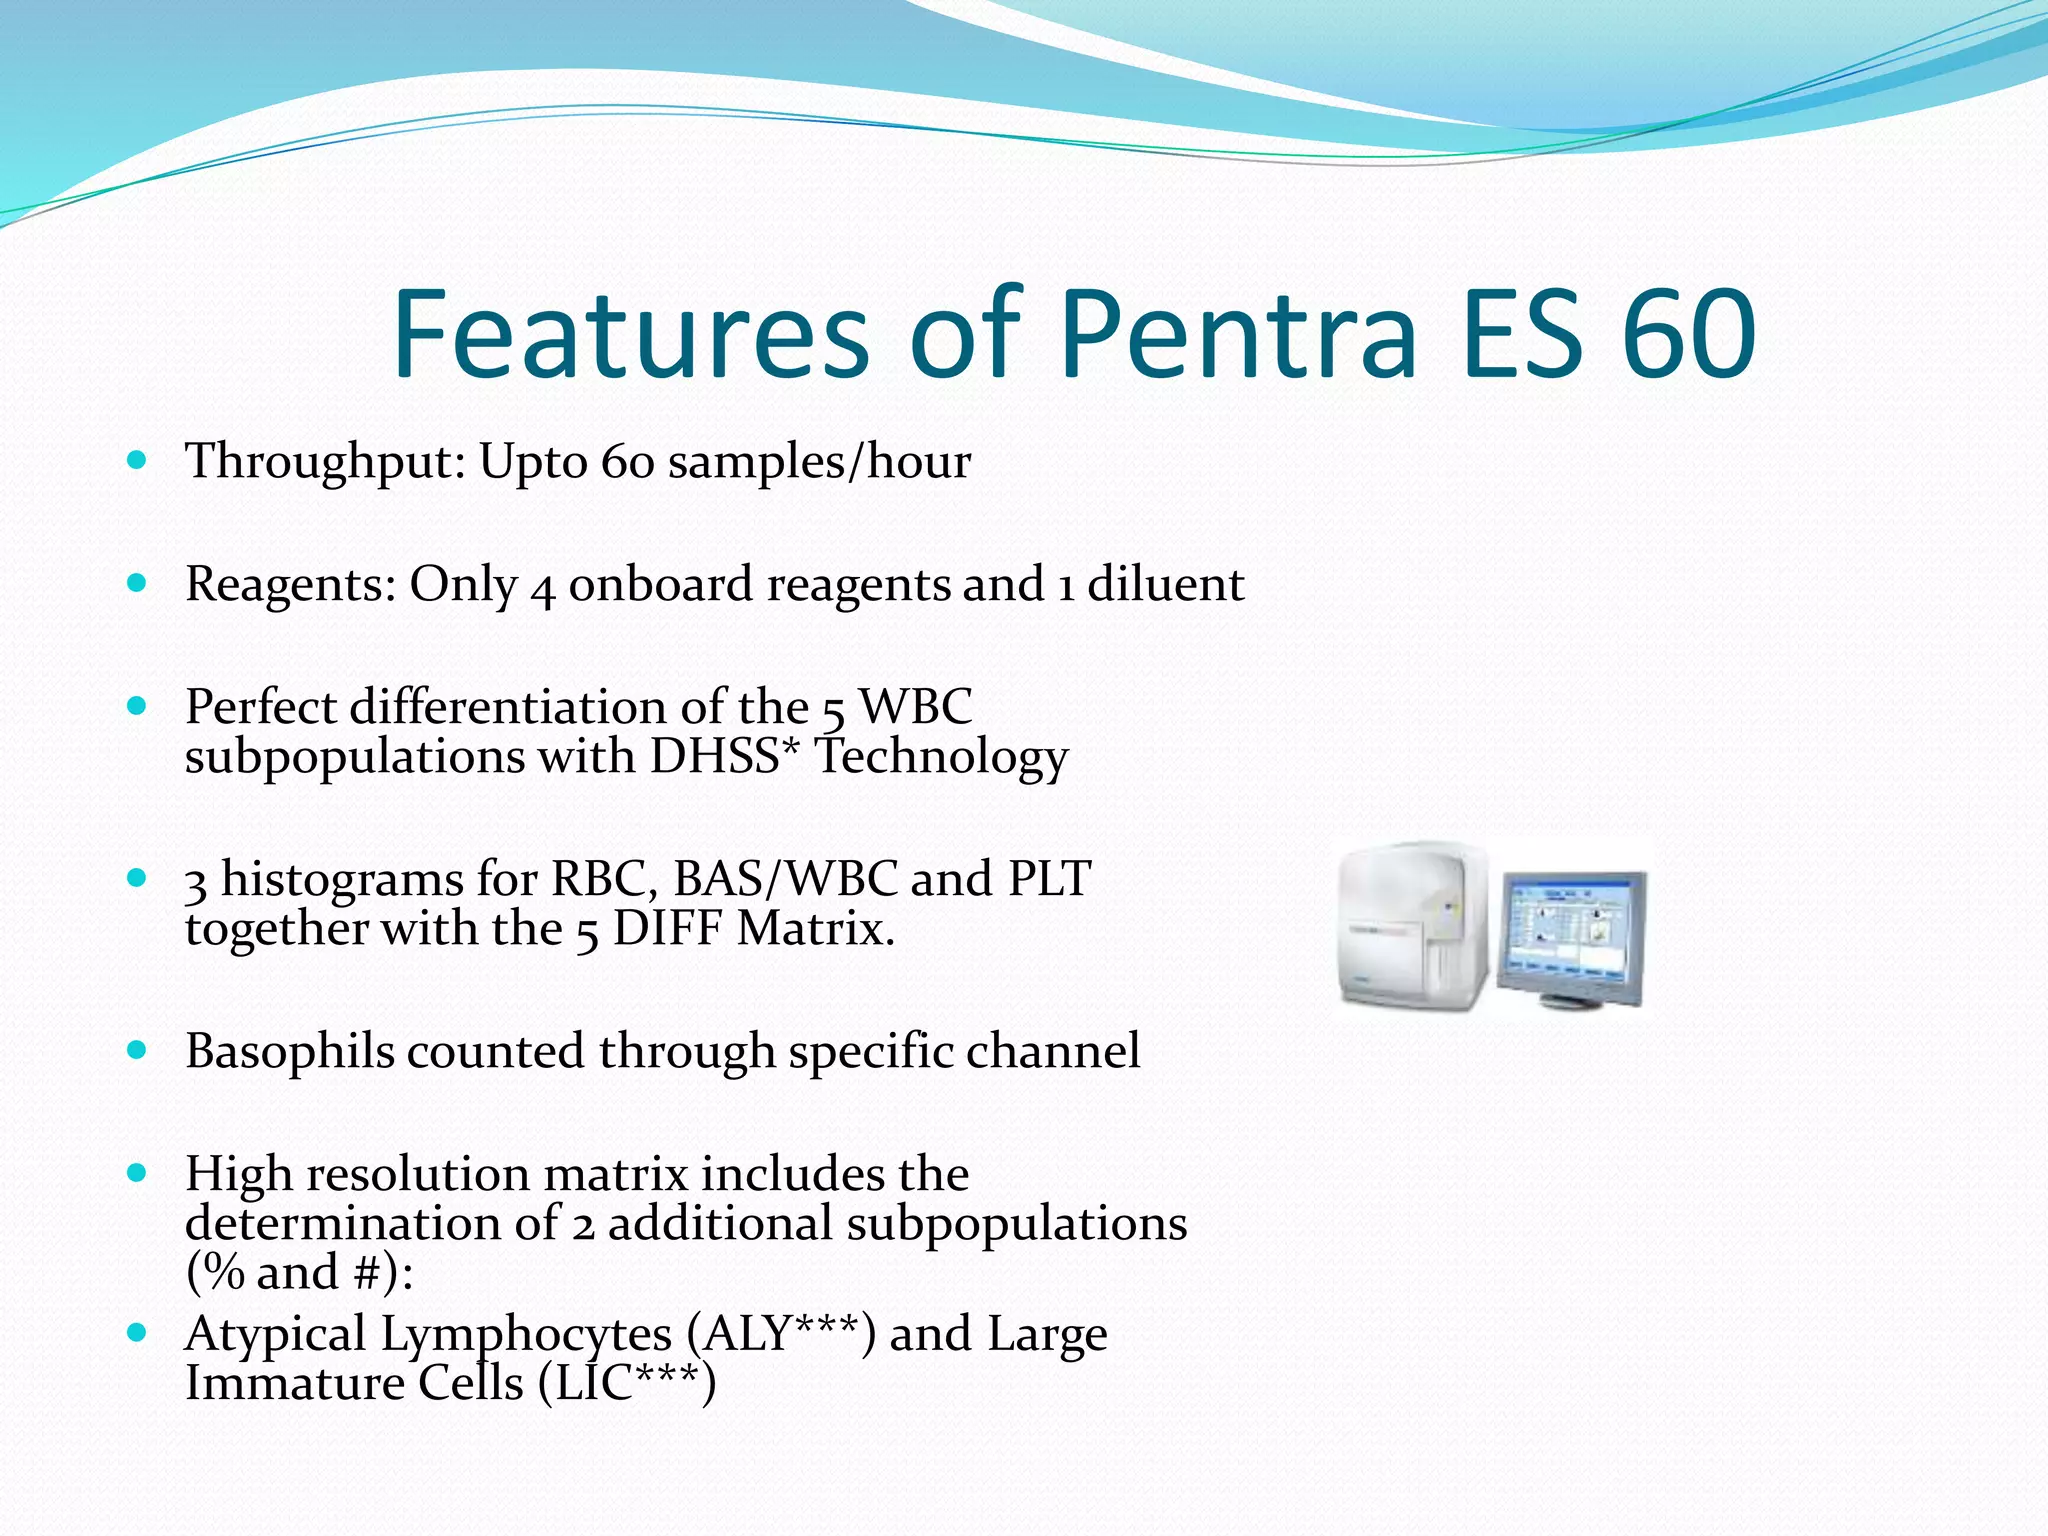
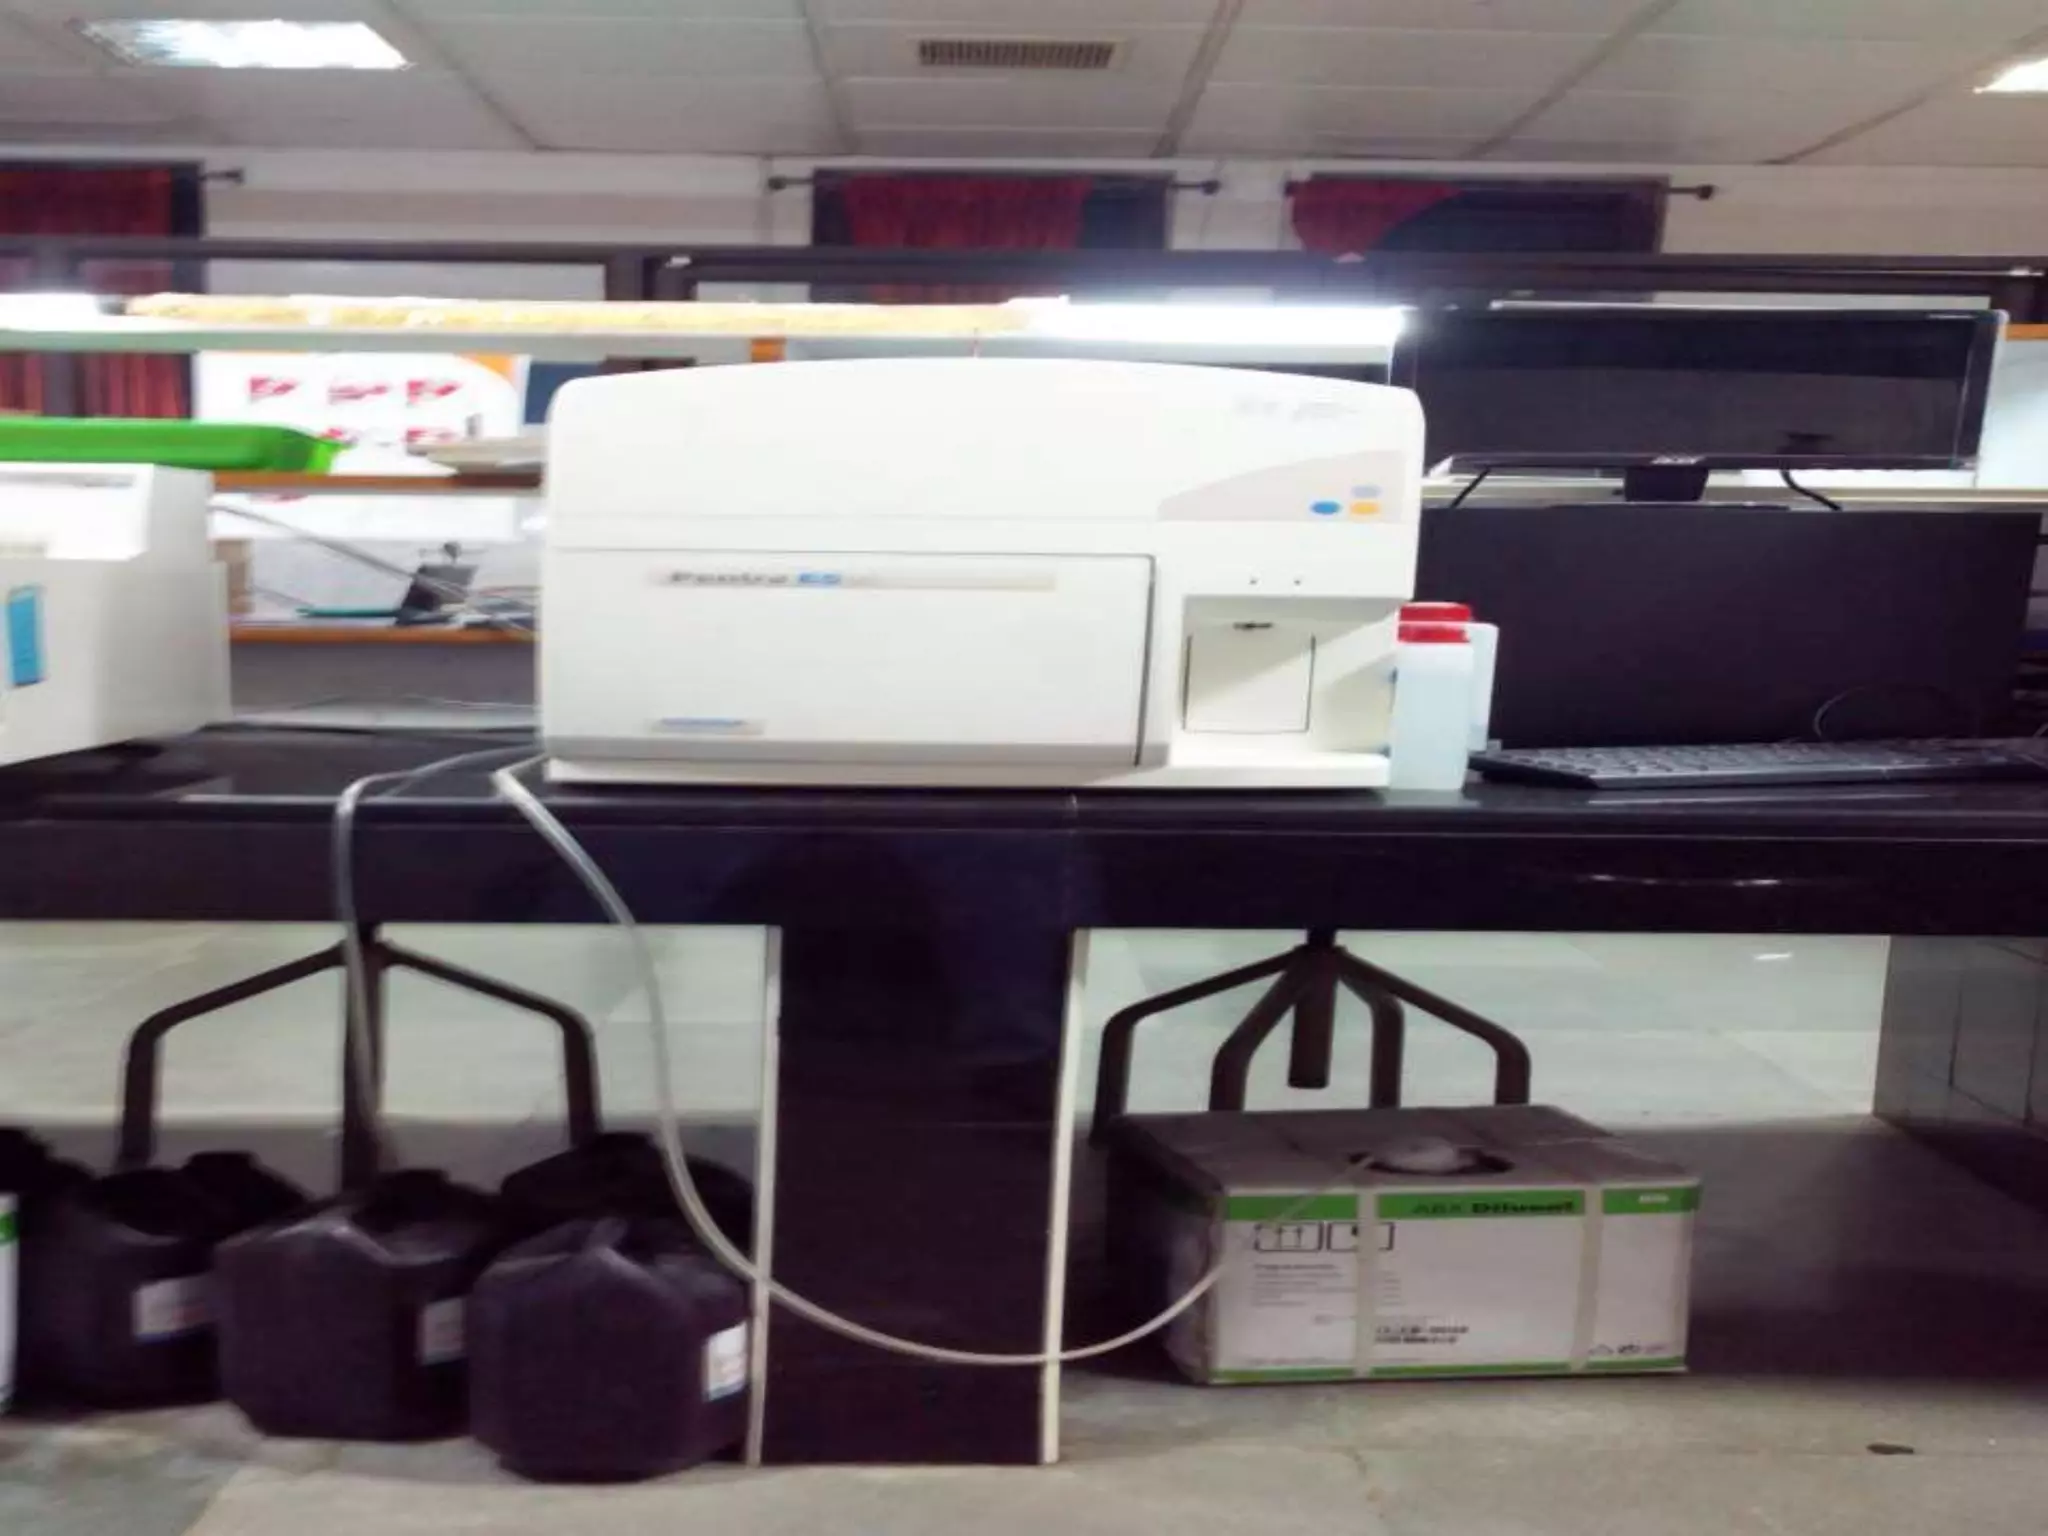
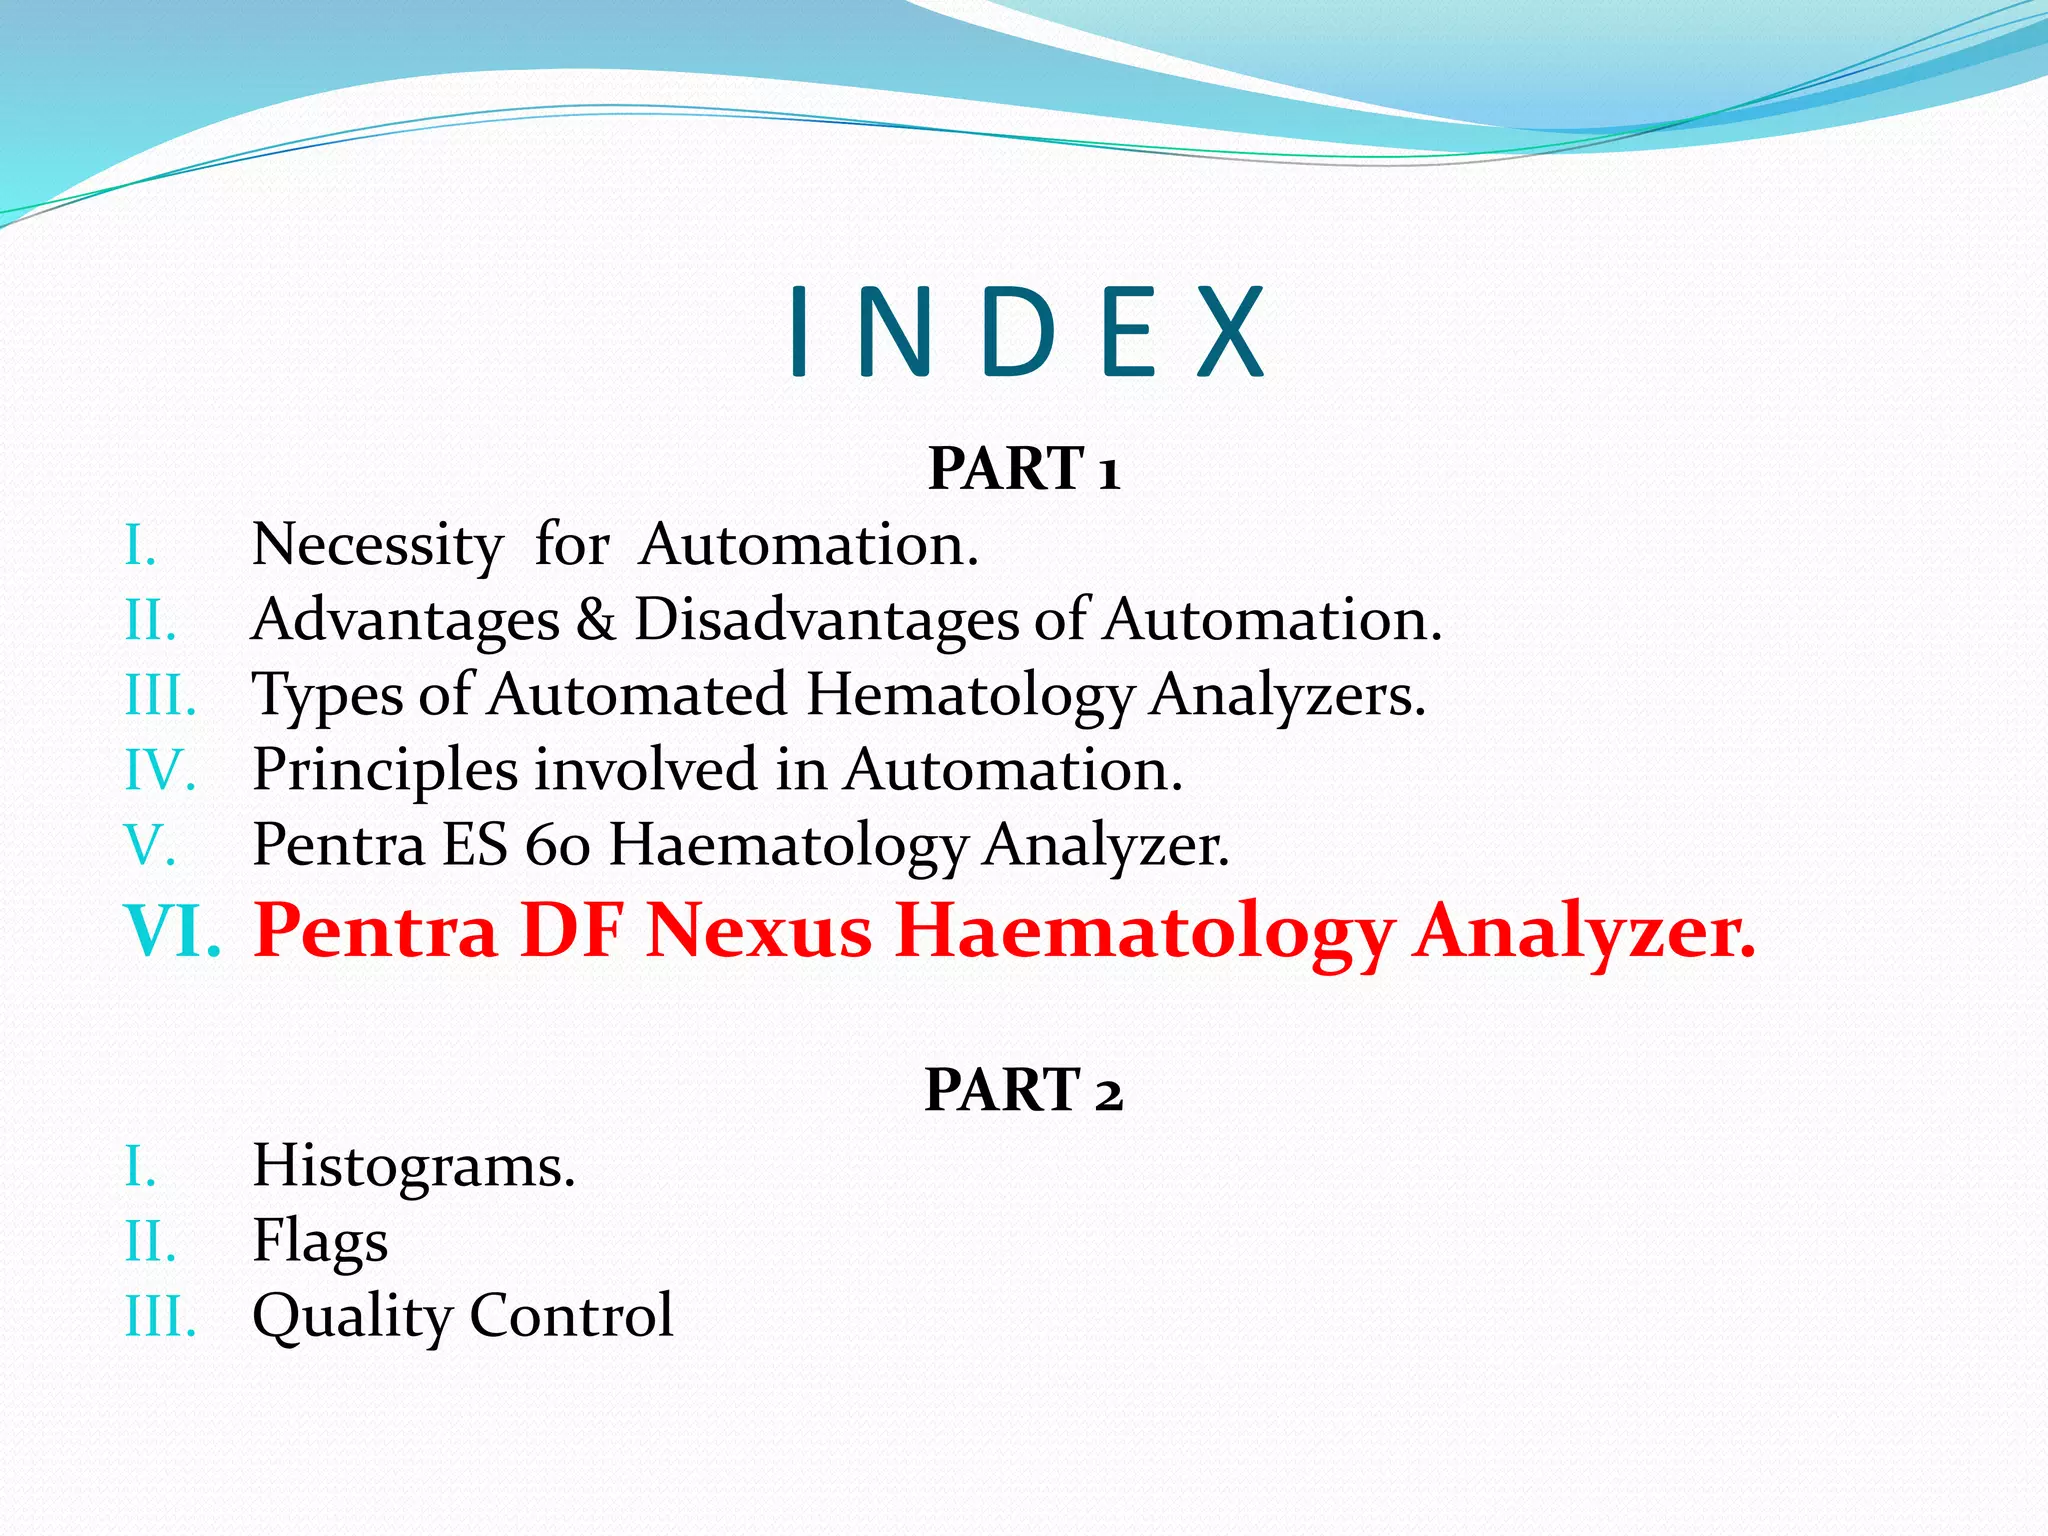
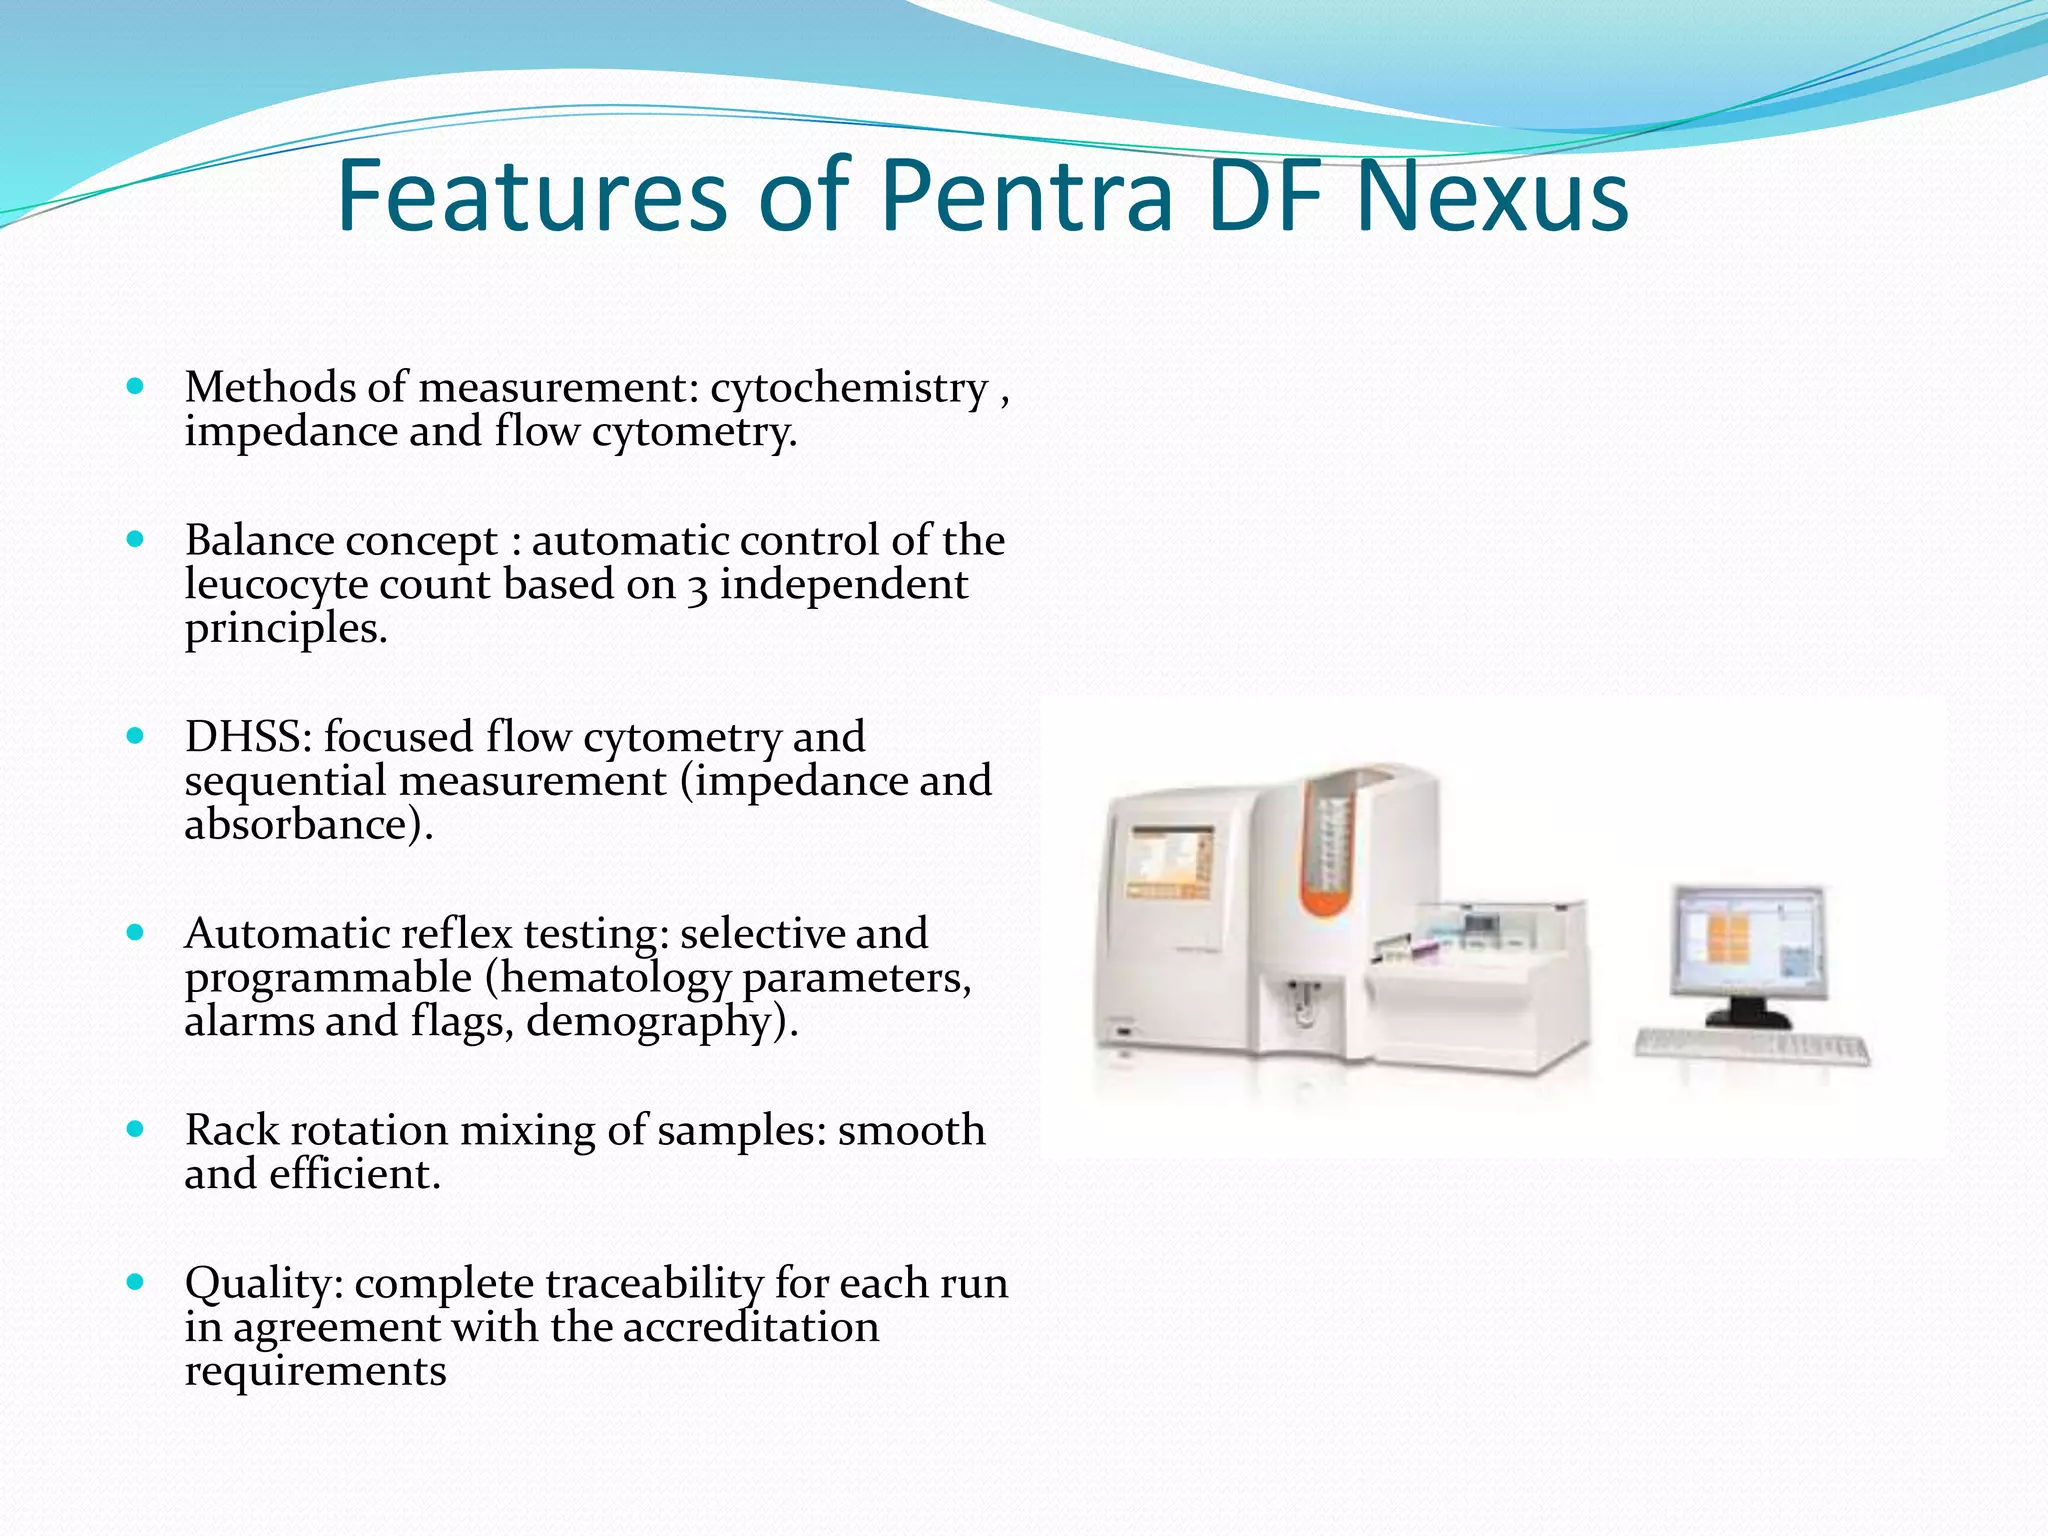
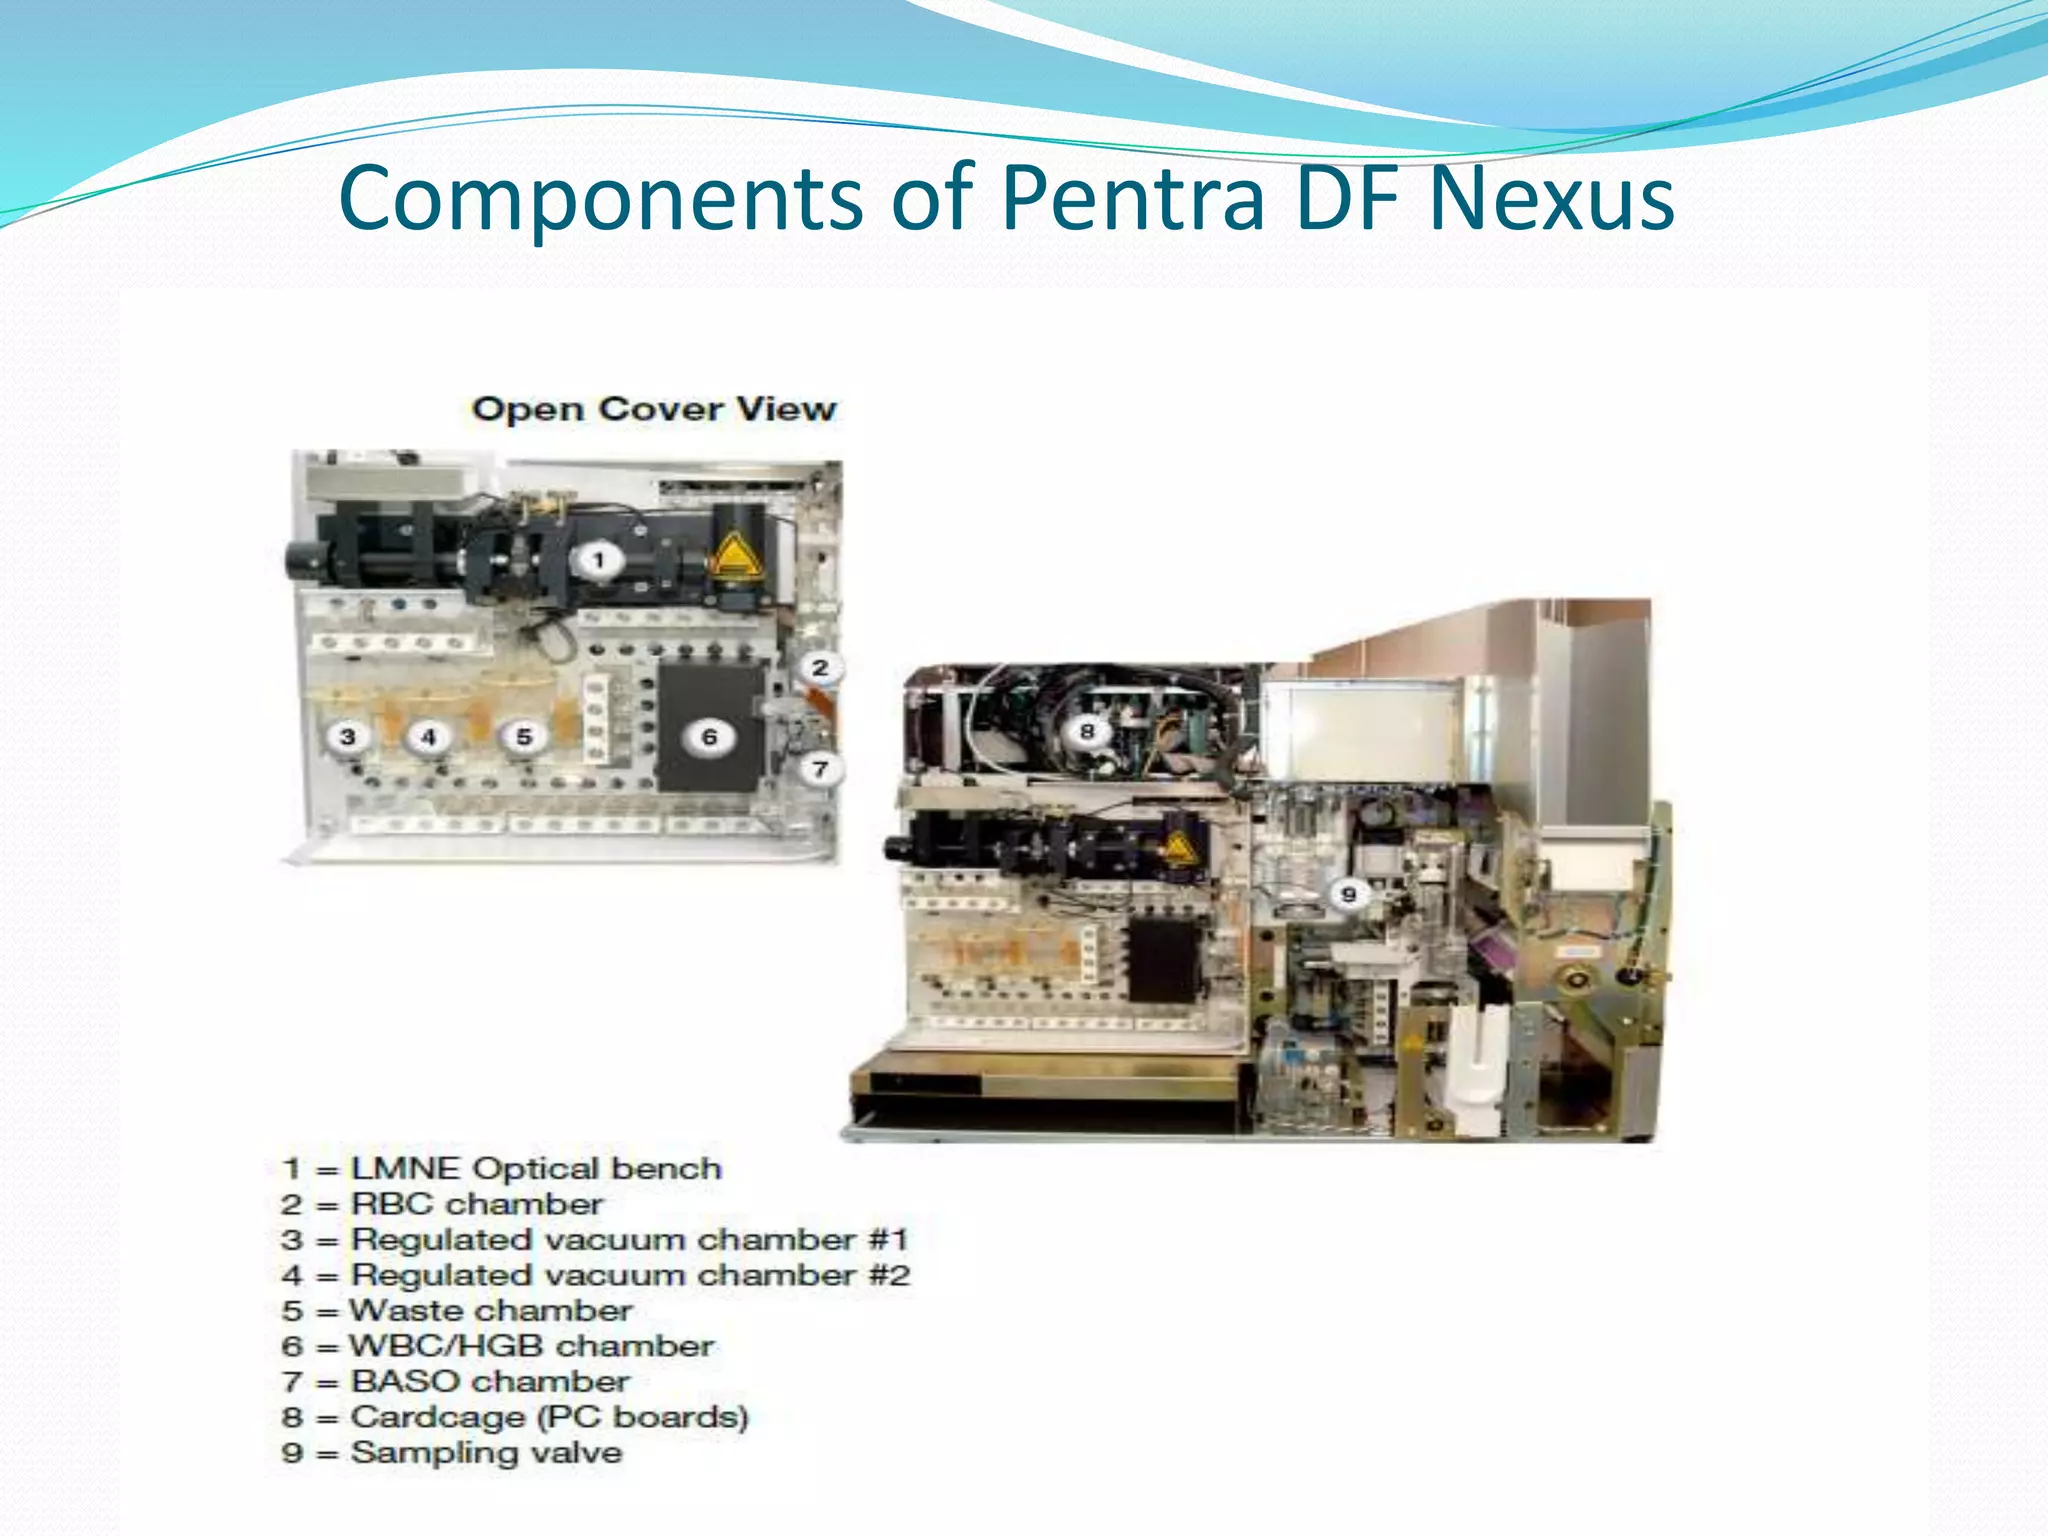
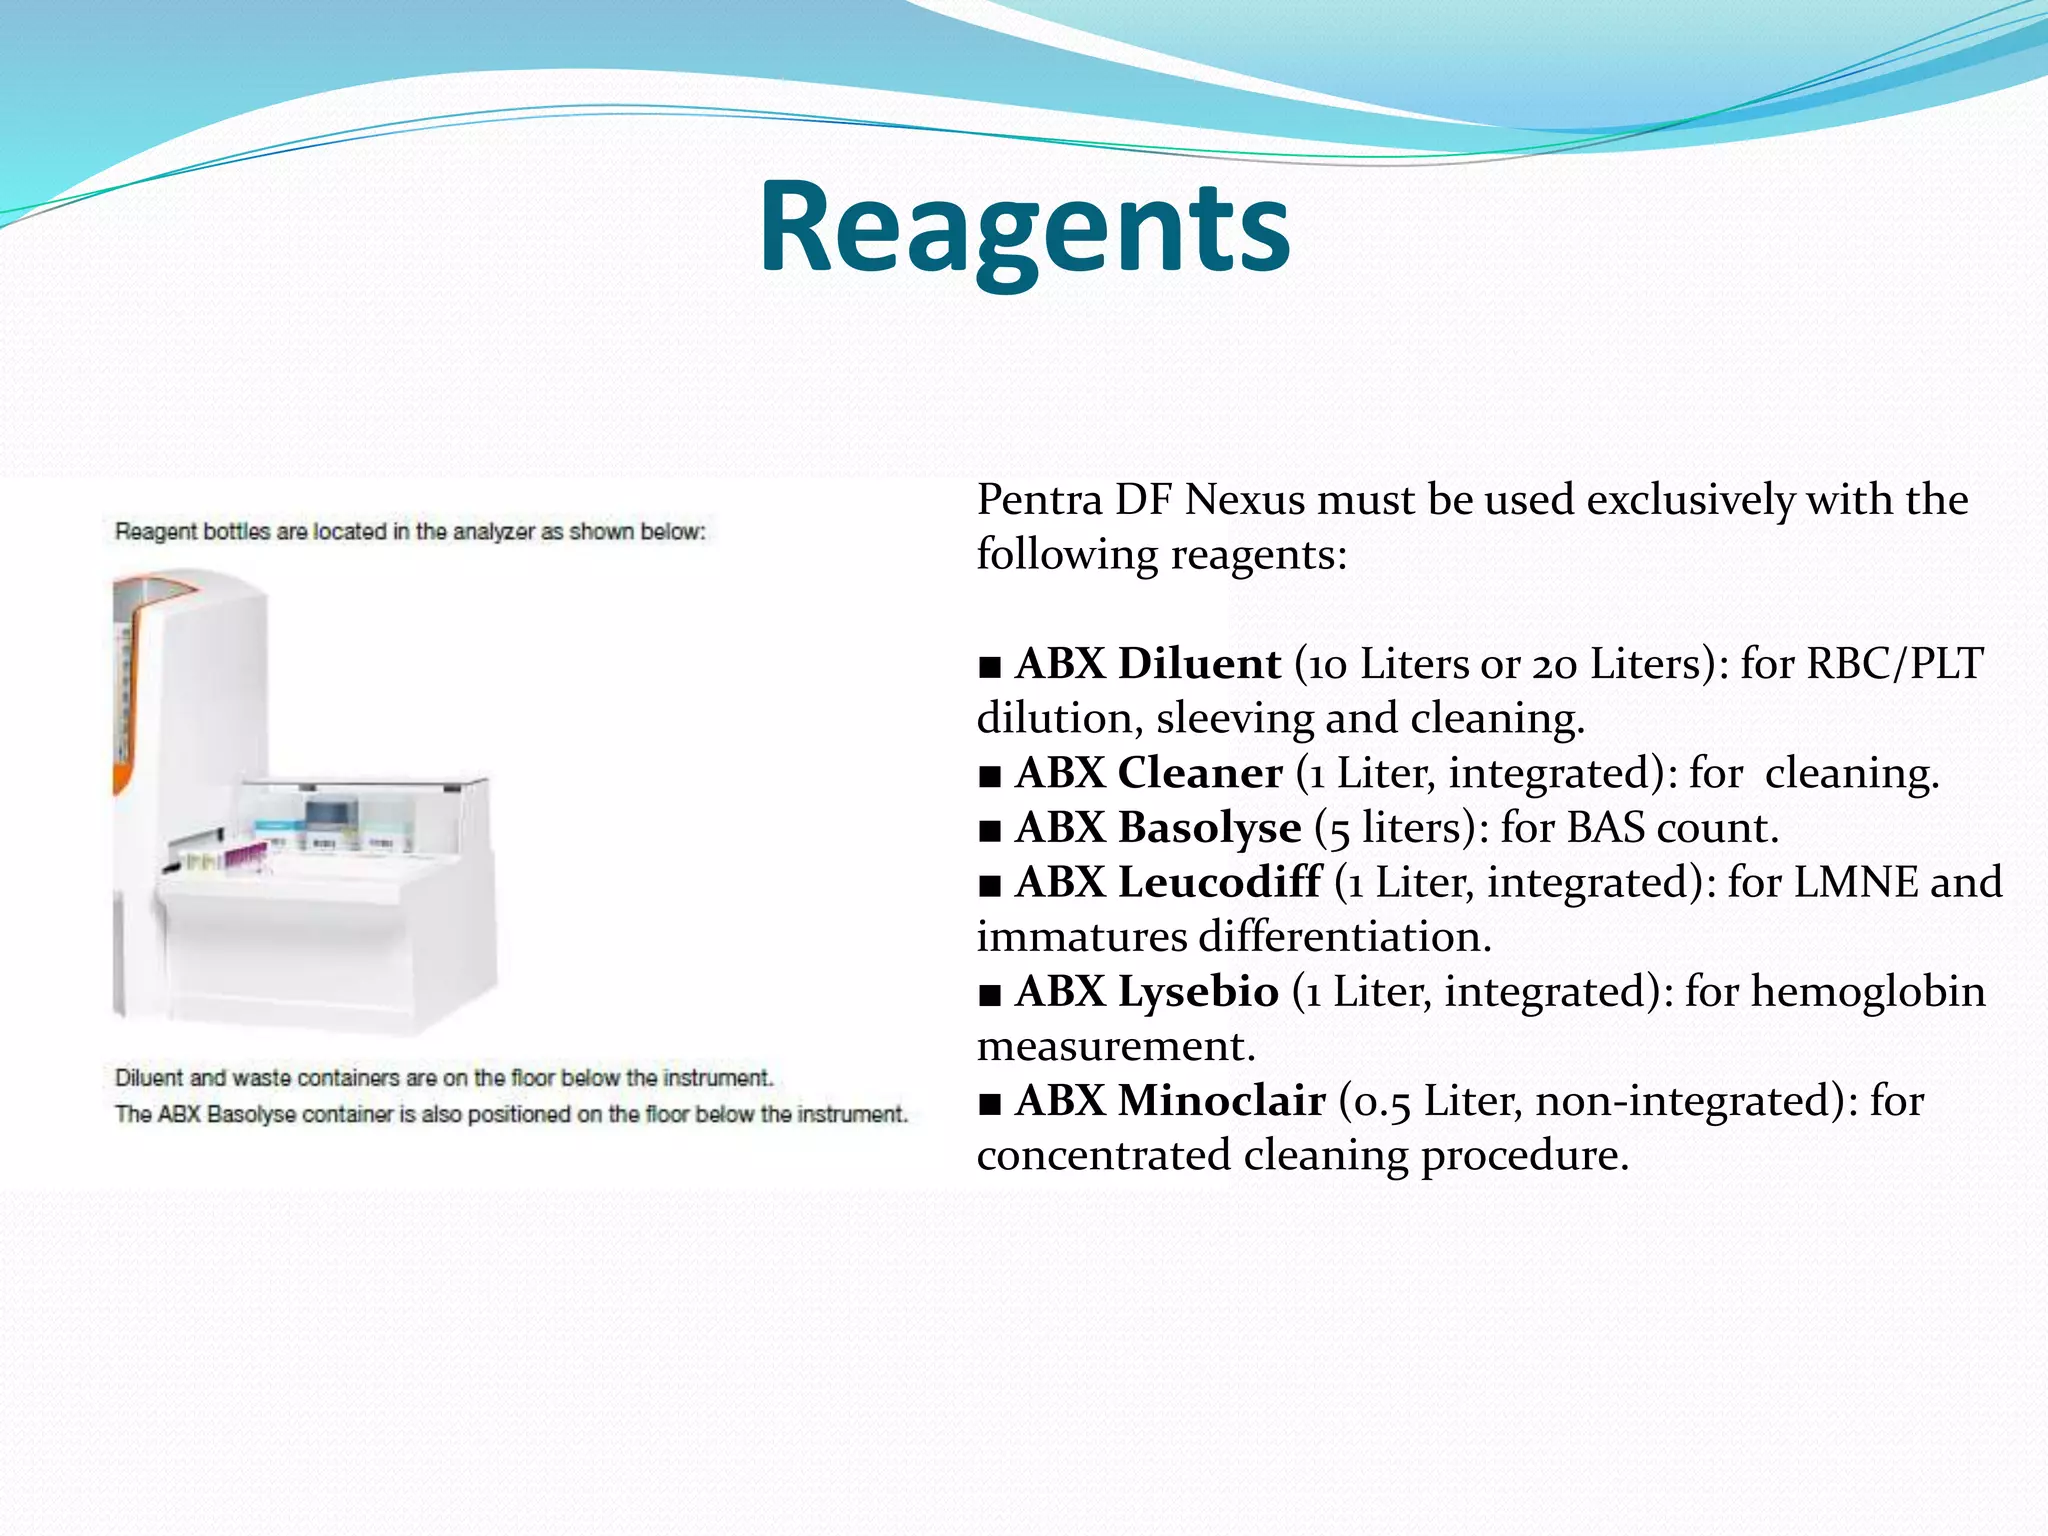
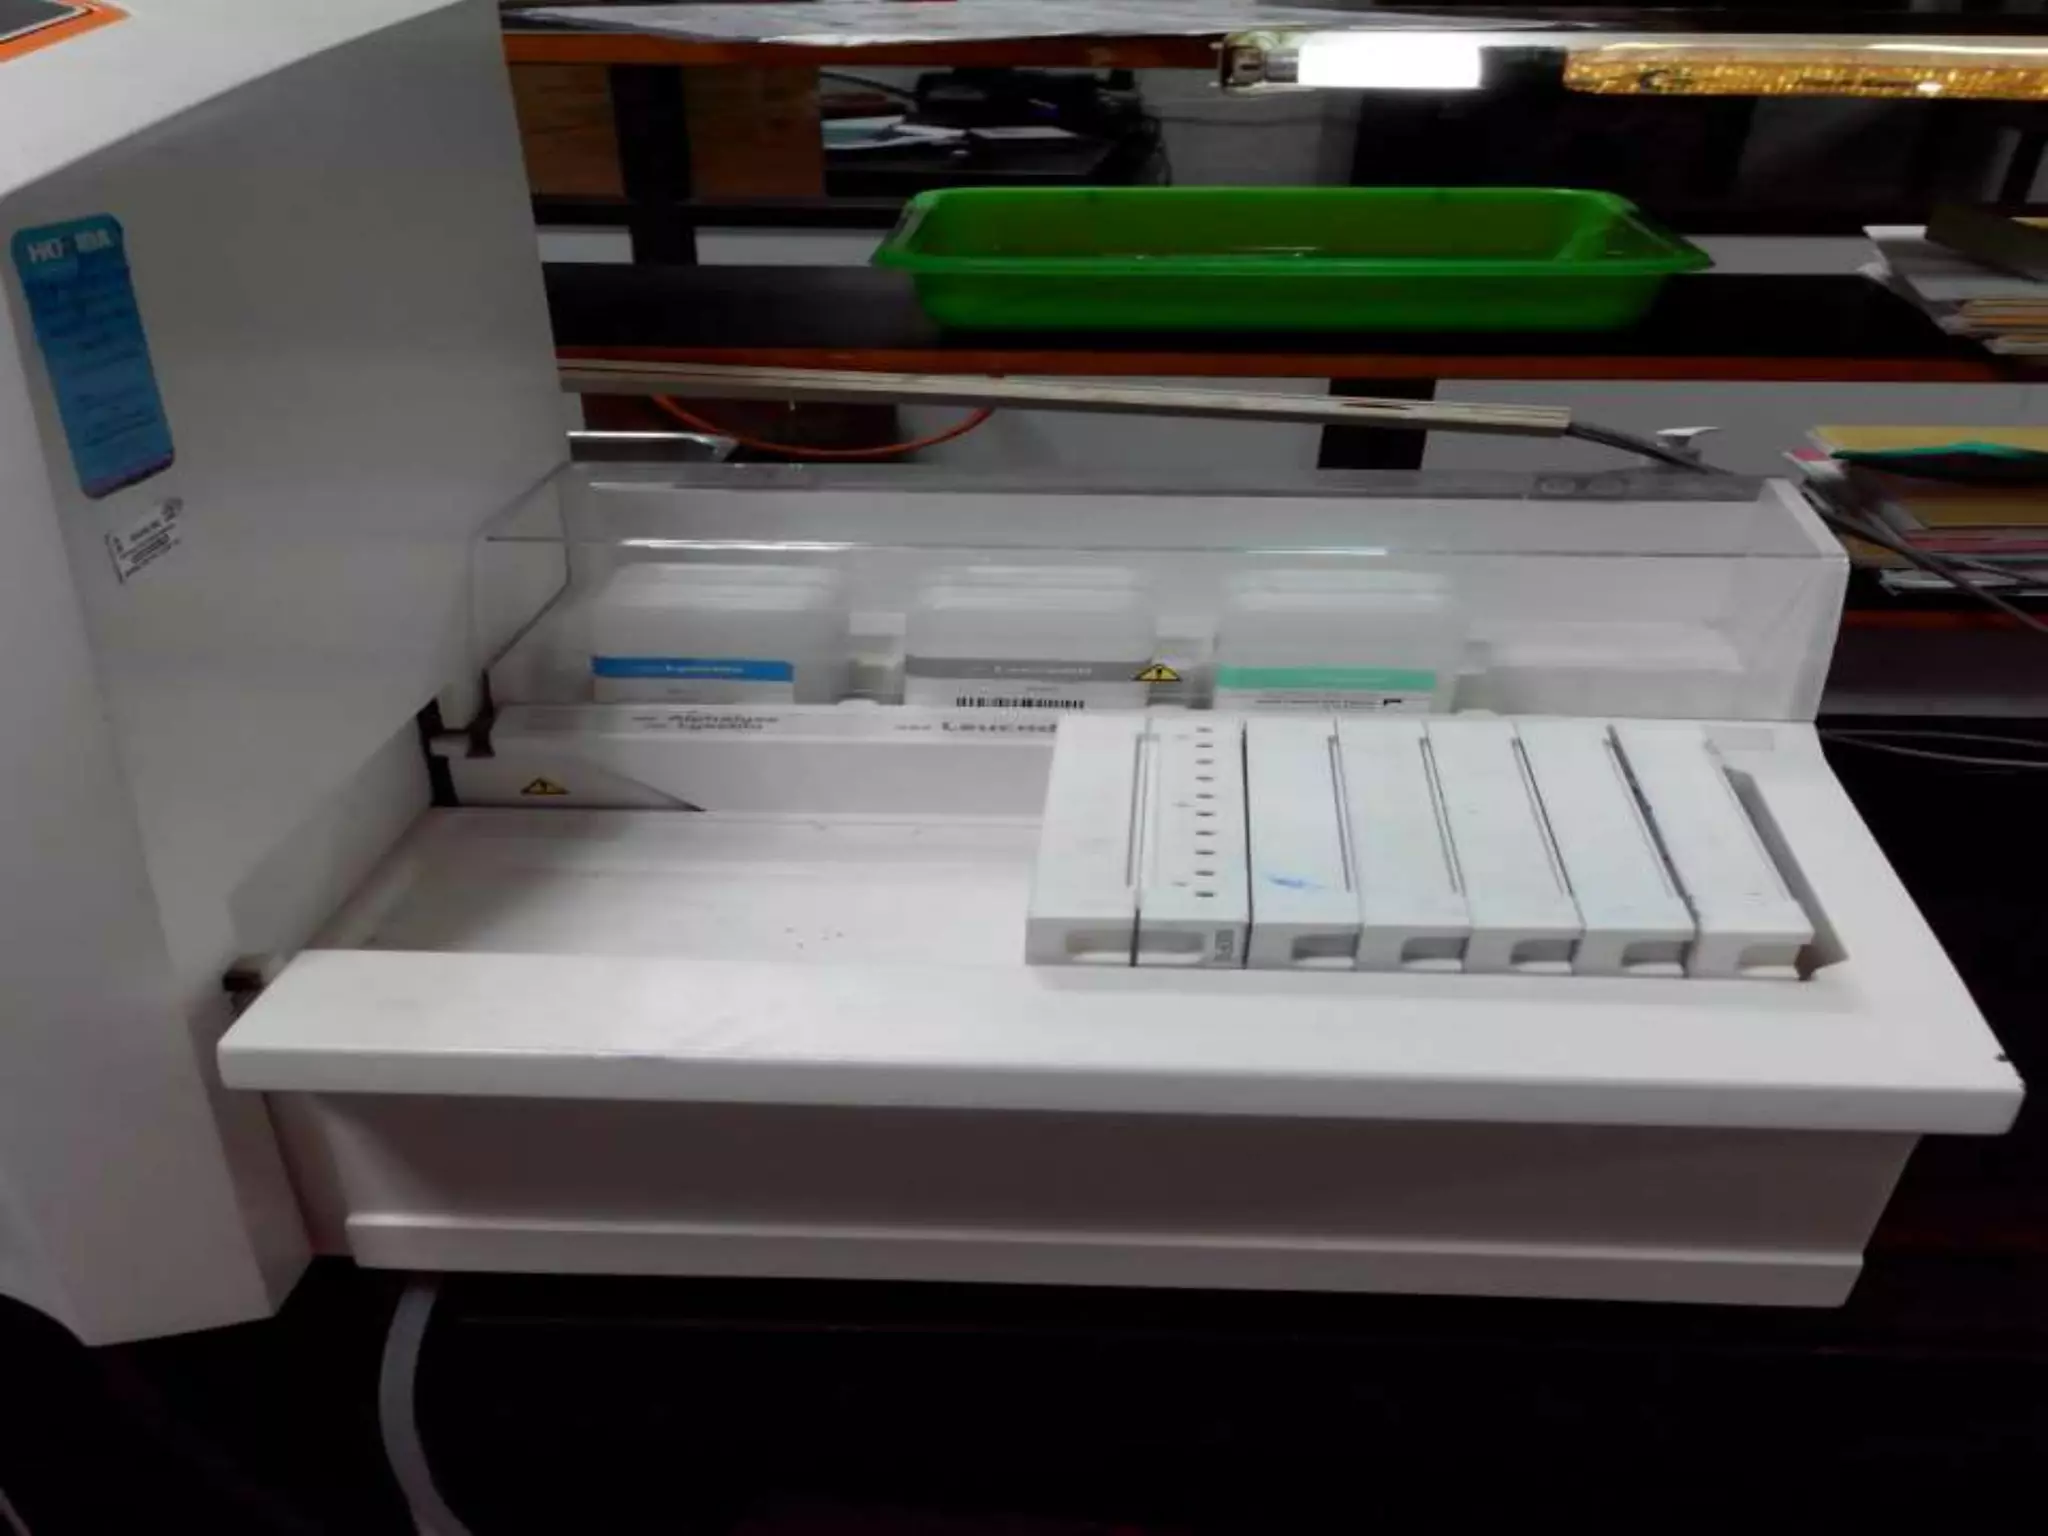
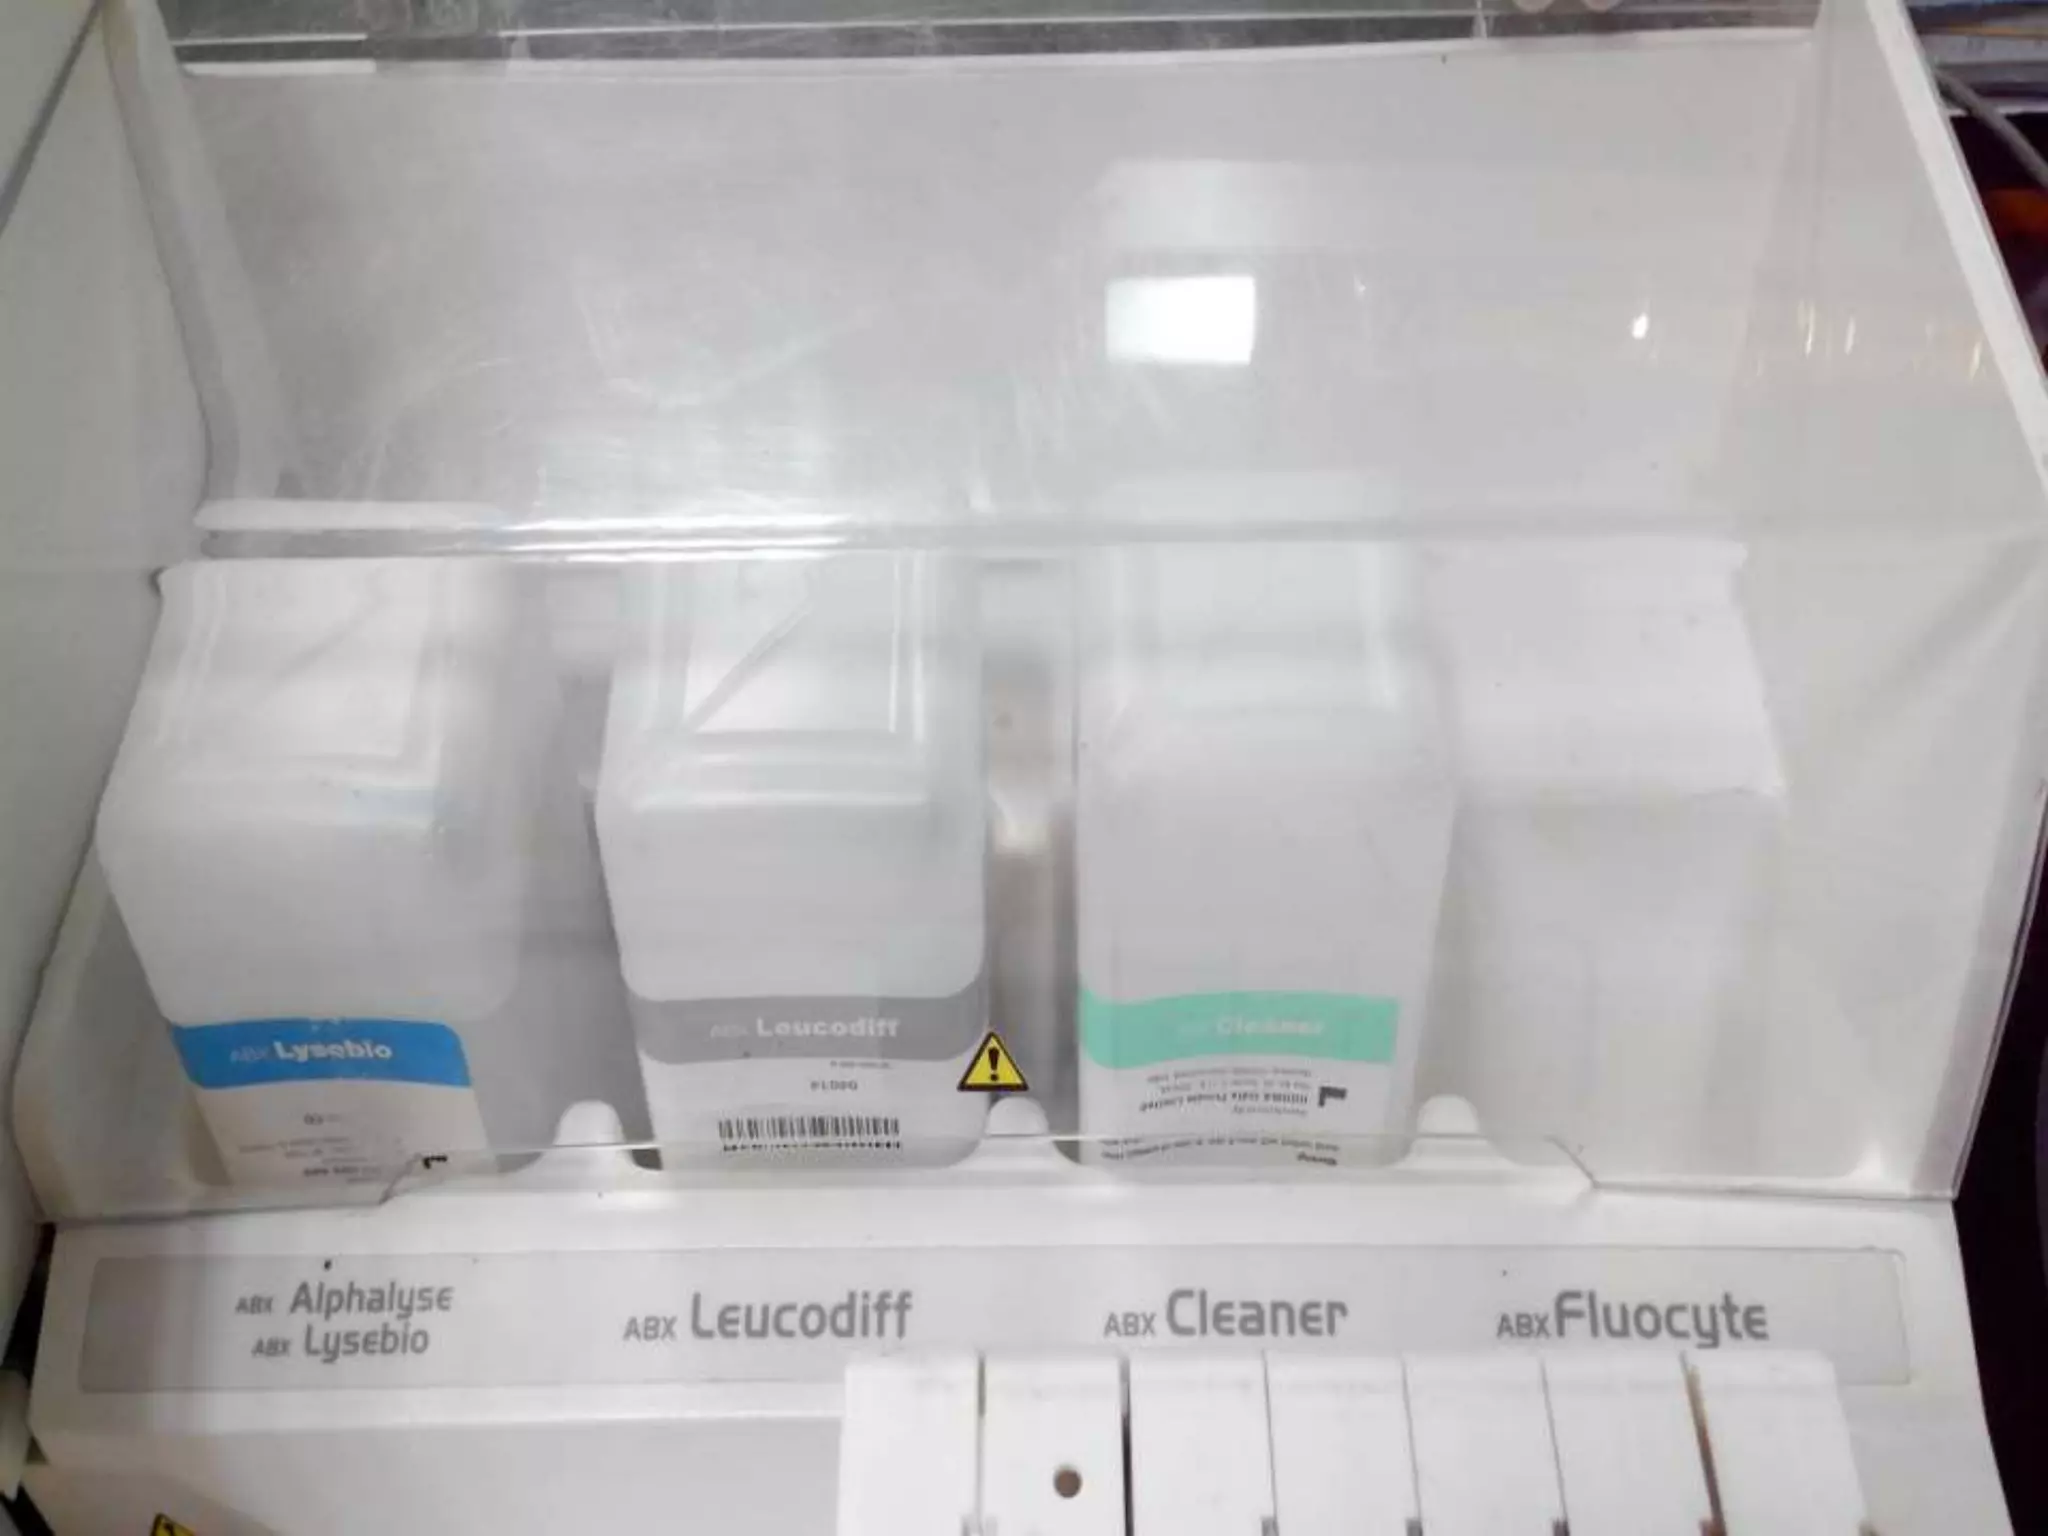
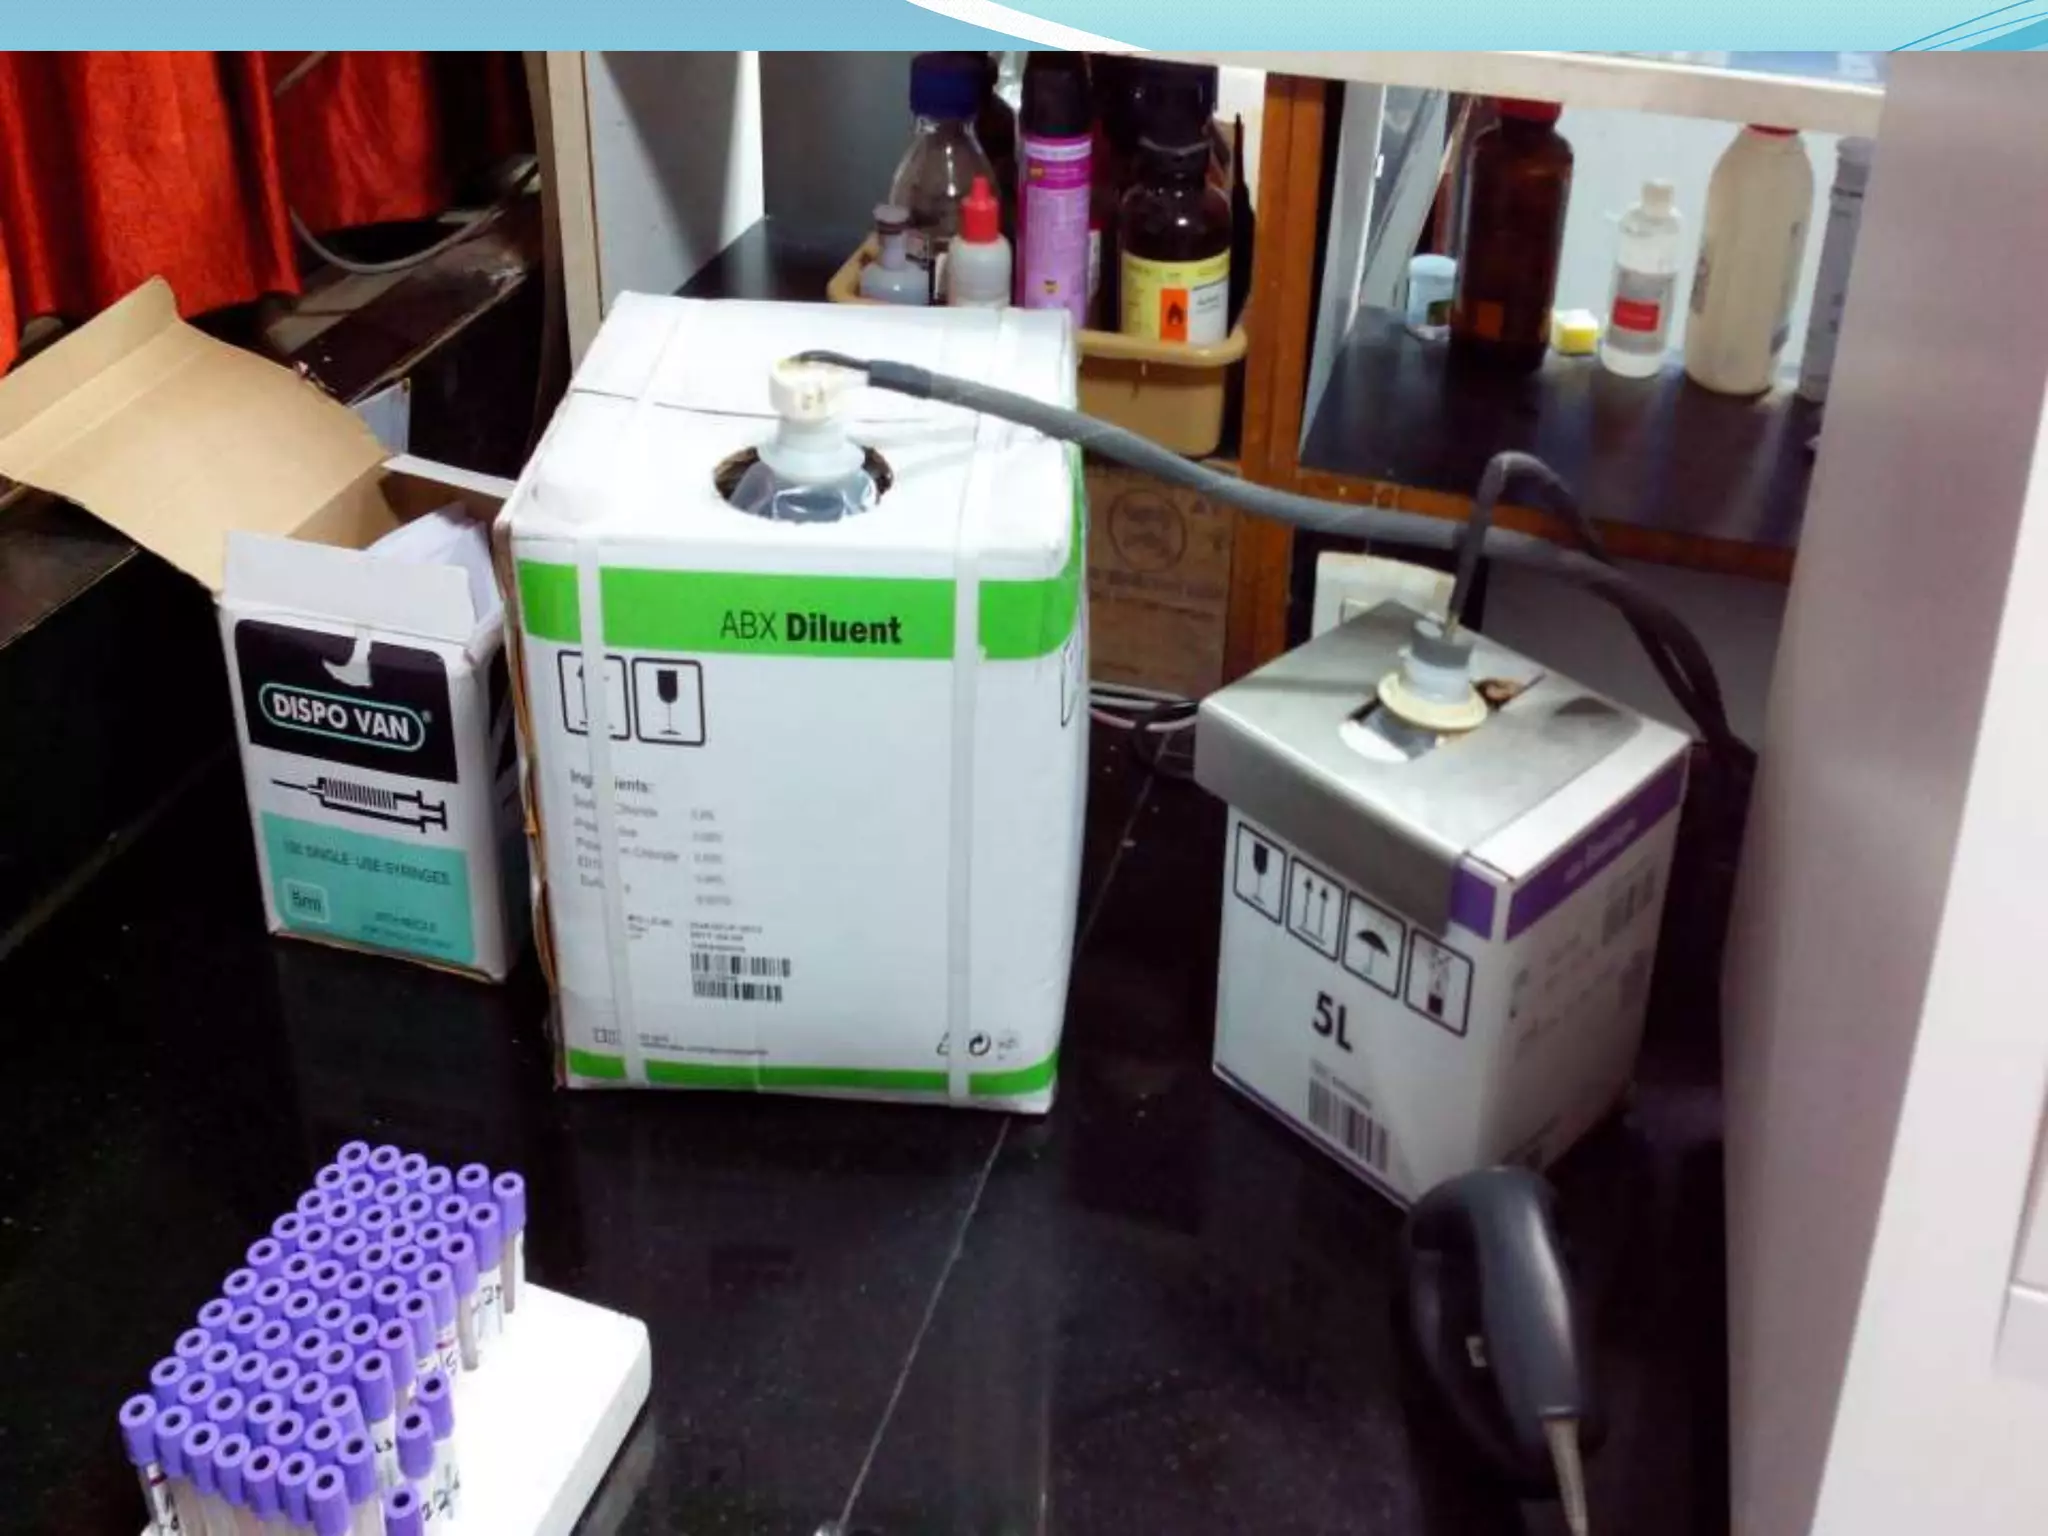
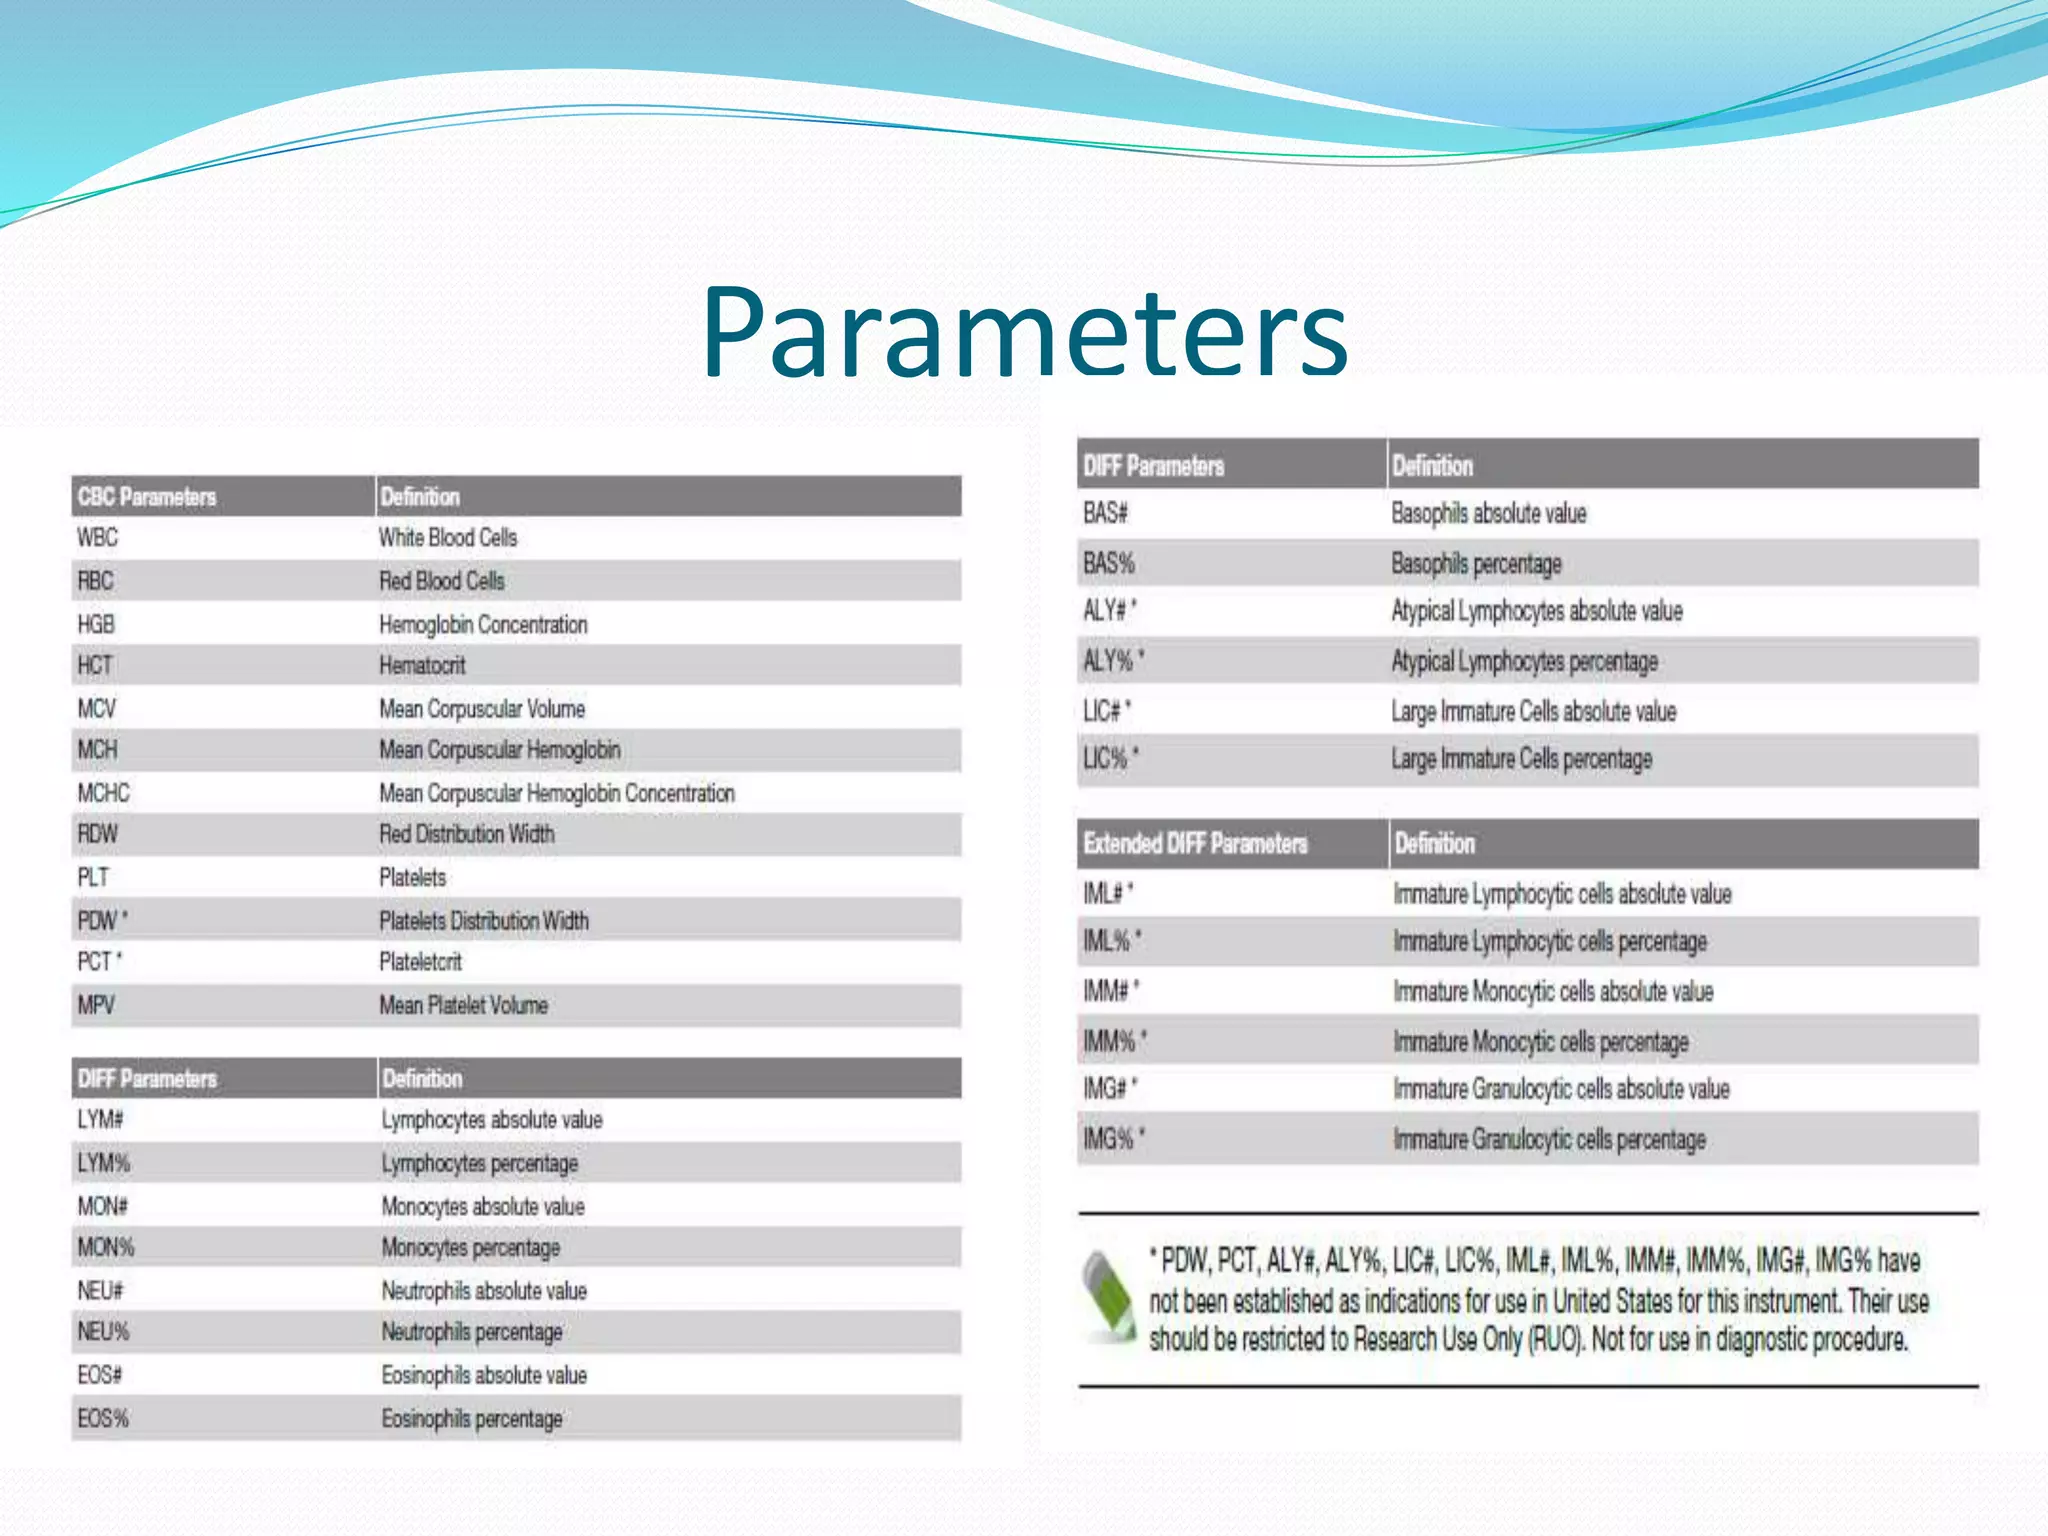


This document discusses automation in hematology. It begins by outlining the necessity for automation in cell counting, diagnosing various blood conditions, and performing multiple tests on a single platform. The document then covers the advantages and disadvantages of automation, including increased speed and accuracy versus high costs. It describes the various principles used in automated hematology analyzers, such as electrical impedance, optical light scattering, and flow cytometry. Finally, it provides details on specific analyzers like the Pentra ES 60 and Pentra DF Nexus.