SlideShare a Scribd company logo
1 of 11
Download to read offline
RASHID KHAN Analytical Chemistry 2 F2017067044
Explain with details, the deference between Atomic
Absorption Spectrometry and Atomic Emission
Spectrometry?
Atomic Absorption Spectrometry
Introduction:
In the past many types of researches have been performed to allow multi-
element determinations using atomic absorption spectrometry. Atomic
absorption spectrometry (AAS) is a technique in which free gaseous atoms absorb
electromagnetic radiation at a specific wavelength to produce a measurable
signal. The absorption signal is proportional to the concentration of those free
absorbing atoms in the optical path. The first spectrometers developed for this
purpose were proposed in the 1970 using flame and furnace atomizers.
History:
In 1665 NEWTON took the first and the most
important step towards the development of spectroscopy.
The beautiful phenomenon of “RAINBOW” was the first
dispersed spectrum. The first atomic absorption
spectrometer was built by CSIRO scientist Alan Walsh in
1954. In 1955 the modern era of atomic absorption
spectroscopy began with the work of Walsh and Alkemade
and Milatz. The time since 1955 can be divided into seven
year periods. The first was an induction period 1955 to1962
when AA received attention from only a very few people.
Principle:
 The technique uses basically the principle that free atoms (gas) generated
in an atomizer can absorb radiation at specific frequency.
RASHID KHAN Analytical Chemistry 2 F2017067044
 Atomic-absorption spectroscopy quantifies the absorption of ground state
atoms in the gaseous state.
 The atoms absorb ultraviolet or visible light and make transitions to higher
electronic energy levels. The analyte concentration is determined from the
amount of absorption.
 Concentration measurements are usually determined from a working curve
after calibrating the instrument with standards of known concentration.
 Atomic absorption is a very common technique for detecting metals and
metalloids in environmental samples.
Schematic diagram of AAS:
Light Source:
The main component of an analytical absorption spectrometer is the light
source, providing monochromatic light for the absorption process. Two types of
light sources are mostly used. Hollow-cathode lamps contain a cathode of the
analyte element and an anode, and are filled with a noble gas.
 Hollow Cathode Lamp is the most common radiation source in AAS.
 It contains a tungsten anode and a hollow cylindrical cathode made of the
element to be determined.
 These are sealed in a glass tube filled with an inert gas like neon or argon.
 Each element has its own unique lamp which must be used for that
analysis.
RASHID KHAN Analytical Chemistry 2 F2017067044
Nebulizer:
The nebulizer sucks up liquid sample at a
controlled rate, create a fine aerosol that mixes with
fuel and oxidant for introduction into the flame. The
nebulizer uses the combustion flames to atomize
and introduce the sample into the light path.
Atomizer:
Sample Atomization. Atomic Absorption
Spectroscopy requires the conversion of the sample
to gaseous atoms, which absorb radiation. The fine
mist is carried to the atomizer, such as a flame, by a
carrier gas. When the mist reaches the flame, the
intense heat breaks up the sample into its individual
atoms.
 Elements to be analyzed needs to be in atomic sate.
 Atomization is separation of particles into individual molecules and
breaking molecules into atoms. This is done by exposing the analyte to high
temperatures in a flame or graphite furnace.
Monochromator:
In effect, a monochromator produces
monochromatic light by removing unwanted
wavelengths from the source light beam. The
function of the monochromator is to isolate a
single atomic resonance line from the spectrum of
lines emitted by the hollow cathode lamp.
 This is a very important part in an AA spectrometer. It is used to separate
out all of the thousands of lines.
RASHID KHAN Analytical Chemistry 2 F2017067044
 A monochromator is used to select the specific wavelength of light which is
absorbed by the sample, and to exclude other wavelengths.
 The selection of the specific light allows the determination of the selected
element in the presence of others.
Detector:
The role of the detector is to convert a light signal
into an electrical signal. The type of detector found
in AAS is the photomultiplier tube. The principle of
operation is the emission of electrons upon
exposure to radiation. The detector contains a
photoemissive cathode and a series of dynodes.
 The light selected by the monochromator is directed onto a detector that is
typically a photomultiplier tube , whose function is to convert the light
signal into an electrical signal proportional to the light intensity.
 The processing of electrical signal is fulfilled by a signal amplifier. The signal
could be displayed for readout, or further fed into a data station for
printout by the requested format.
Calibration Curve:
A calibration curve was used to
determine the unknown concentration of
an element in a solution. The different
types of interference that were
encountered in atomic absorption
spectroscopy. Absorption of source
radiation an element other than the one
of interest may absorb the wavelength
being used.
 A calibration curve is used to determine the unknown concentration of an
element in a solution. The instrument is calibrated using several solutions
RASHID KHAN Analytical Chemistry 2 F2017067044
of known concentrations. The absorbance of each known solution is
measured and then a calibration curve of concentration vs absorbance is
plotted.
 The sample solution is fed into the instrument, and the absorbance of the
element in this solution is measured .The unknown concentration of the
element is then calculated from the calibration curve
Applications:
 Environmental Sciences
 Food technology
 Pharmaceutical
 Petrochemical
 Geochemical/Mining
 Bio mentoring
 Agriculture
 Nanomaterial
 Pathology
Atomic Emission Spectrometry
Introduction:
Atomic emission spectroscopy (AES) is a method of chemical analysis that uses
the intensity of light emitted from a flame, plasma, arc, or spark at a particular
wavelength to determine the quantity of an element in a sample. ... The sample
may be excited by various methods.
Technique is also known as OPTICAL EMISSION SPECTROSCOPY .The study of
radiation emitted by excited atoms and monatomic ions. Relaxation of atoms in
the excited state results in emission of light. Produces line spectra in the UV-VIS
and the vacuum UV regions. Used for qualitative identification of elements
present in the sample. Also for quantitative analysis from ppm levels to percent
RASHID KHAN Analytical Chemistry 2 F2017067044
Multielement technique can be used to determine metals, metalloids, and some
nonmetals simultaneously Emission wavelength and energy are related by
ΔE = hc/λ
Does not require light source excited atoms in the flame emit light that reaches
the detector (luminescence) Techniques Based on Excitation Source Flame
Photometry. Furnace. Inductively Coupled Plasma.
History:
Atomic emission spectroscopy has a long history. Qualitative applications based
on the color of flames were used in the smelting of ores as early as 1550 and were
more fully developed around 1830 with the observation of atomic spectra
generated by flame emission and spark emission.
Principle:
 Principle Atomic emission spectroscopy is also an analytical technique that
is used to measure the concentrations of elements in samples. It uses
quantitative measurement of the emission from excited atoms to
determine analyte concentration.
 The analyte atoms are promoted to a higher energy level by the sufficient
energy that is provided by the high temperature of the atomization sources
. The excited atoms decay back to lower levels by emitting light. Emissions
are passed through monochromators or filters prior to detection by
photomultiplier tubes.
 The instrumentation of atomic emission spectroscopy is the same as that of
atomic absorption, but without the presence of a radiation source . In
atomic Emission the sample is atomized and the analyte atoms are excited
to higher energy levels.
RASHID KHAN Analytical Chemistry 2 F2017067044
Schematic Diagram of an Atomic Emission spectrometer
Sources
Atomic emission requires a means for converting a solid, liquid, or solution
analyte into a free gaseous atom. The same source of thermal energy usually
serves as the excitation source. The most common methods are flames and
plasmas, both of which are useful for liquid or solution samples.
 Flame still used for metal atoms
 Alternating current arc (AC arc)
 Direct current (DC arc)
 Alternating current spark (AC spark)
 Direct current Plasma
 Microwave Induced Plasma
 Inductively Coupled Plasma the most important technique
Flame
Flame Atomic Emission Spectroscopy of
water samples using nitrous
oxide/acetylene flame can be performed
at relatively low cost using a diode array
spectrometer and a high temperature
nitrous oxide acetylene flame, and allows
RASHID KHAN Analytical Chemistry 2 F2017067044
the rapid determination of main group metals in the low ppm range with good
precision
 It is used for those molecules which do not require very high temperatures
for excitation into atoms during quantitative analysis.
 Sample in solution form and sprayed into the flame of a burner.
Three types of high-temperature plasma
 Plasma an electrically conducting gaseous mixture containing significant
concentrations of cations and electrons.
 The inductively coupled plasma
 The direct current plasma
 The microwave induced plasma. The most important of these plasmas is
the inductively coupled plasma.
Sample holder
The function of sample holder is to introduce the sample into the electrical
discharge. Atomic emission spectroscopy is a method of chemical analysis that
uses the intensity of . A sample of a material is brought into the flame as a gas,
sprayed solution, Coning and quartering , Dilution, Dissolution, Filtration ,
Masking, Pulverization, Sample preparation, Separation process ,
Two types
 Solid samples
 Liquid samples
Detectors
 For Quantitative analysis photographic plate is used on which all the
emission lines from the samples are recorded.
 This photograph of the emission spectrum helps in the measurement of
wavelength of radiation lines.
RASHID KHAN Analytical Chemistry 2 F2017067044
 From these lines emitting elements can be identified.
 The instrument with photographic recording is called spectrograph and the
one using photoelectric device as spectrometer
Nebulizer:
The general term nebulizer refers to an apparatus that converts liquids into a fine
mist. Analytical nebulizers are a special category in that their purpose is to deliver
a fine mist to spectrometric instruments for elemental analysis.
 Convert solution to fine spray or aerosol
 Ultrasonic nebulizer
 Uses ultrasound waves to "boil" solution flowing across disc
 Pneumatic nebulizer
 Uses high pressure gas to entrain solution
Monochromator:
The excitation source must desolvate, atomize and excite the analyte atoms. The
flame supplies the sufficient energy to promote the atoms into high energy levels.
As the atoms decay to their ground stage, the emitted radiation passes through
the monochromator that isolates the specific wavelength for desired analysis.
 even with many lines, much spectrum contains no information
 rapidly scanned (slewed) across blank regions (between atomic emission
lines)
 From 165 nm to 800 nm in 20 m sec
 slowly scanned across lines to 0.001 nm increment
 computer control/pre-selected lines to scan
Application:
The principal application of atomic emission spectroscopy is to determine the
proportional quantity of a particular element in a given sample. The various
methods of atomic emission spectroscopy are utilized to examine different
substances such as foods and drinks, motor oil and soil samples.
RASHID KHAN Analytical Chemistry 2 F2017067044
 Qualitative analysis is done using AES in the same manner in which it is
done using FES. The spectrum of the analyte is obtained and compared
with the atomic and ionic spectra of possible elements in the analyte.
Generally an element is considered to be in the analyte if at least three
intense lines can be matched with those from the spectrum of a known
element.
 Quantitative analysis with a plasma can be done using either an atomic or
an ionic line. Ionic lines are chosen for most analyses because they are
usually more intense at the temperatures of plasmas than are the atomic
lines.
 In determining the impurities of Ni, Mn, Cu, Al etc., in iron and steel in
metallurgical processes. The percentage determined is 0.001% in iron to 30
in steel.
 Lubricating oils can be analysed for Ni, Fe, Mn etc.,
 Solid samples and animal tissues have been analysed for several elements
including K, Na, Ca, Zn, Ni, etc.
 To detect 40 elements in plants and soils, thus metal deficiency in plants
and soils can be diagnosed.
RASHID KHAN Analytical Chemistry 2 F2017067044
References:
 Harnly, J. M., et al. "Background-corrected simultaneous multielement
atomic absorption spectrometer." Analytical Chemistry 51.12 (1979): 2007-
2014.
 Sholupov, S., et al. "Zeeman atomic absorption spectrometer RA-915+ for
direct determination of mercury in air and complex matrix samples." Fuel
Processing Technology 85.6-7 (2004): 473-485.
 Chan, Mei-Shu, and Shang-Da Huang. "Direct determination of cadmium
and copper in seawater using a transversely heated graphite furnace
atomic absorption spectrometer with Zeeman-effect background
corrector." Talanta 51.2 (2000): 373-380.
 Chan, Mei-Shu, and Shang-Da Huang. "Direct determination of cadmium
and copper in seawater using a transversely heated graphite furnace
atomic absorption spectrometer with Zeeman-effect background
corrector." Talanta 51.2 (2000): 373-380.
 McQuaker, Neil R., Paul D. Kluckner, and Gok N. Chang. "Calibration of an
inductively coupled plasma-atomic emission spectrometer for the analysis
of environmental materials." Analytical Chemistry 51.7 (1979): 888-895.
 Pilon, Michael J., et al. "Evaluation of a new array detector atomic emission
spectrometer for inductively coupled plasma atomic emission
spectroscopy." Applied spectroscopy 44.10 (1990): 1613-1620.
 Ahmad, Shakeel, Ramesh C. Murthy, and Satya V. Chandra. "Chromium
speciation by column chromatography using a direct current plasma atomic
emission spectrometer." Analyst 115.3 (1990): 287-289.

More Related Content

What's hot

Atomic absorption spectroscopy
Atomic absorption spectroscopy Atomic absorption spectroscopy
Atomic absorption spectroscopy Mayur Bodhankar
 
Atomic Fluorescence Spectroscopy (AFS)
Atomic Fluorescence Spectroscopy (AFS)Atomic Fluorescence Spectroscopy (AFS)
Atomic Fluorescence Spectroscopy (AFS)Sajjad Ullah
 
Detectors used in gas chromatography
Detectors used in gas chromatographyDetectors used in gas chromatography
Detectors used in gas chromatographyVrushali Tambe
 
Neutron activation analysis
Neutron activation analysisNeutron activation analysis
Neutron activation analysismohilamohsin
 
Atomic Spectroscopy: Basic Principles and Instruments
Atomic Spectroscopy: Basic Principles and InstrumentsAtomic Spectroscopy: Basic Principles and Instruments
Atomic Spectroscopy: Basic Principles and InstrumentsVasiliy V. Rosen (Ph.D.)
 
Fluorescence spectroscopy
Fluorescence spectroscopyFluorescence spectroscopy
Fluorescence spectroscopyHalavath Ramesh
 
Molecular luminescence spectrometry
Molecular luminescence spectrometryMolecular luminescence spectrometry
Molecular luminescence spectrometryShaikhSaniya2
 
Atomic absorption spectrophotometry
Atomic absorption spectrophotometryAtomic absorption spectrophotometry
Atomic absorption spectrophotometryBasil "Lexi" Bruno
 
Nmr instrumentation Naveen Balaji
Nmr instrumentation Naveen BalajiNmr instrumentation Naveen Balaji
Nmr instrumentation Naveen BalajiNaveen Balaji
 
INDUCTIVELY COUPLED PLASMA -ATOMIC EMISSION SPECTROSCOPY
INDUCTIVELY COUPLED PLASMA -ATOMIC EMISSION SPECTROSCOPYINDUCTIVELY COUPLED PLASMA -ATOMIC EMISSION SPECTROSCOPY
INDUCTIVELY COUPLED PLASMA -ATOMIC EMISSION SPECTROSCOPYParimi Anuradha
 
Radiochemical methods of analysis
Radiochemical methods of analysisRadiochemical methods of analysis
Radiochemical methods of analysisSajjad Ullah
 
Application of UV-Visible spectroscopy
Application of UV-Visible spectroscopyApplication of UV-Visible spectroscopy
Application of UV-Visible spectroscopyROHIT
 
Auger electron spectroscopy
Auger electron spectroscopyAuger electron spectroscopy
Auger electron spectroscopyGulfam Hussain
 
Applications of Atomic Absorption Spectrometry (AAS)
Applications of Atomic Absorption Spectrometry (AAS)Applications of Atomic Absorption Spectrometry (AAS)
Applications of Atomic Absorption Spectrometry (AAS)Maharishi Dayanand University
 
Atomic Absorption Spectroscopy (AAS)
Atomic Absorption Spectroscopy (AAS)Atomic Absorption Spectroscopy (AAS)
Atomic Absorption Spectroscopy (AAS)Sajjad Ullah
 
Atomic emission spectroscopy
Atomic emission spectroscopyAtomic emission spectroscopy
Atomic emission spectroscopyWasla Anum
 
Flourescence spectroscopy- instrumentation and applications
Flourescence spectroscopy-  instrumentation and applicationsFlourescence spectroscopy-  instrumentation and applications
Flourescence spectroscopy- instrumentation and applicationssinghsnehi01
 

What's hot (20)

Atomic absorption spectroscopy
Atomic absorption spectroscopy Atomic absorption spectroscopy
Atomic absorption spectroscopy
 
Atomic Fluorescence Spectroscopy (AFS)
Atomic Fluorescence Spectroscopy (AFS)Atomic Fluorescence Spectroscopy (AFS)
Atomic Fluorescence Spectroscopy (AFS)
 
Detectors used in gas chromatography
Detectors used in gas chromatographyDetectors used in gas chromatography
Detectors used in gas chromatography
 
Neutron activation analysis
Neutron activation analysisNeutron activation analysis
Neutron activation analysis
 
Atomic Spectroscopy: Basic Principles and Instruments
Atomic Spectroscopy: Basic Principles and InstrumentsAtomic Spectroscopy: Basic Principles and Instruments
Atomic Spectroscopy: Basic Principles and Instruments
 
Fluorescence spectroscopy
Fluorescence spectroscopyFluorescence spectroscopy
Fluorescence spectroscopy
 
Ion chromatography
Ion chromatographyIon chromatography
Ion chromatography
 
Molecular luminescence spectrometry
Molecular luminescence spectrometryMolecular luminescence spectrometry
Molecular luminescence spectrometry
 
Atomic absorption spectrophotometry
Atomic absorption spectrophotometryAtomic absorption spectrophotometry
Atomic absorption spectrophotometry
 
Nmr instrumentation Naveen Balaji
Nmr instrumentation Naveen BalajiNmr instrumentation Naveen Balaji
Nmr instrumentation Naveen Balaji
 
GCMS & LCMS
GCMS & LCMSGCMS & LCMS
GCMS & LCMS
 
mass spectrOSCOPY
 mass spectrOSCOPY mass spectrOSCOPY
mass spectrOSCOPY
 
INDUCTIVELY COUPLED PLASMA -ATOMIC EMISSION SPECTROSCOPY
INDUCTIVELY COUPLED PLASMA -ATOMIC EMISSION SPECTROSCOPYINDUCTIVELY COUPLED PLASMA -ATOMIC EMISSION SPECTROSCOPY
INDUCTIVELY COUPLED PLASMA -ATOMIC EMISSION SPECTROSCOPY
 
Radiochemical methods of analysis
Radiochemical methods of analysisRadiochemical methods of analysis
Radiochemical methods of analysis
 
Application of UV-Visible spectroscopy
Application of UV-Visible spectroscopyApplication of UV-Visible spectroscopy
Application of UV-Visible spectroscopy
 
Auger electron spectroscopy
Auger electron spectroscopyAuger electron spectroscopy
Auger electron spectroscopy
 
Applications of Atomic Absorption Spectrometry (AAS)
Applications of Atomic Absorption Spectrometry (AAS)Applications of Atomic Absorption Spectrometry (AAS)
Applications of Atomic Absorption Spectrometry (AAS)
 
Atomic Absorption Spectroscopy (AAS)
Atomic Absorption Spectroscopy (AAS)Atomic Absorption Spectroscopy (AAS)
Atomic Absorption Spectroscopy (AAS)
 
Atomic emission spectroscopy
Atomic emission spectroscopyAtomic emission spectroscopy
Atomic emission spectroscopy
 
Flourescence spectroscopy- instrumentation and applications
Flourescence spectroscopy-  instrumentation and applicationsFlourescence spectroscopy-  instrumentation and applications
Flourescence spectroscopy- instrumentation and applications
 

Similar to Deference between atomic absorption spectrometry and atomic emission spectrometry

Atomic absorption spectroscopy
Atomic absorption spectroscopyAtomic absorption spectroscopy
Atomic absorption spectroscopySwatiChoudhary51
 
1606732404-atomic-absorption-emission-2.ppt
1606732404-atomic-absorption-emission-2.ppt1606732404-atomic-absorption-emission-2.ppt
1606732404-atomic-absorption-emission-2.pptRanaNoman21
 
Atomic_Absorption_Emission.ppt
Atomic_Absorption_Emission.pptAtomic_Absorption_Emission.ppt
Atomic_Absorption_Emission.pptZORAIZ HAIDER
 
Presentation biological techinque copy
Presentation biological techinque   copyPresentation biological techinque   copy
Presentation biological techinque copyGhulamMujtabaHassan
 
1606732404-atomic-absorption-emission-2.ppt
1606732404-atomic-absorption-emission-2.ppt1606732404-atomic-absorption-emission-2.ppt
1606732404-atomic-absorption-emission-2.pptMuhammadJavedIqbal40
 
Instru booklet (1)
Instru booklet (1)Instru booklet (1)
Instru booklet (1)Zainab&Sons
 
Atomic absorption spectrometer
Atomic absorption spectrometerAtomic absorption spectrometer
Atomic absorption spectrometerAnusha K R
 
Atomic absorption-spectrometry
Atomic absorption-spectrometryAtomic absorption-spectrometry
Atomic absorption-spectrometryMuhammad Amien
 
Atomic absorption-spectrometry
Atomic absorption-spectrometryAtomic absorption-spectrometry
Atomic absorption-spectrometryMUsama10
 
1606732404-atomic-absorption-emission-2.ppt
1606732404-atomic-absorption-emission-2.ppt1606732404-atomic-absorption-emission-2.ppt
1606732404-atomic-absorption-emission-2.pptRezaJoia
 
Week 6-Atomic Absorption Spectroscopy.pptx
Week 6-Atomic Absorption Spectroscopy.pptxWeek 6-Atomic Absorption Spectroscopy.pptx
Week 6-Atomic Absorption Spectroscopy.pptxAnimikh Ray
 
Atomic absorption & flame emissionn.pptx
Atomic absorption & flame emissionn.pptxAtomic absorption & flame emissionn.pptx
Atomic absorption & flame emissionn.pptxDr. Vijaya Barge
 
Atomic absorption spectroscopy
Atomic absorption spectroscopyAtomic absorption spectroscopy
Atomic absorption spectroscopySangam Kanthale
 

Similar to Deference between atomic absorption spectrometry and atomic emission spectrometry (20)

Atomic Absorption Spectrophotometry - AAS
Atomic Absorption Spectrophotometry - AASAtomic Absorption Spectrophotometry - AAS
Atomic Absorption Spectrophotometry - AAS
 
Atomic absorption spectroscopy
Atomic absorption spectroscopyAtomic absorption spectroscopy
Atomic absorption spectroscopy
 
Atomic absorption spectroscopy
Atomic absorption spectroscopyAtomic absorption spectroscopy
Atomic absorption spectroscopy
 
1606732404-atomic-absorption-emission-2.ppt
1606732404-atomic-absorption-emission-2.ppt1606732404-atomic-absorption-emission-2.ppt
1606732404-atomic-absorption-emission-2.ppt
 
Atomic_Absorption_Emission.ppt
Atomic_Absorption_Emission.pptAtomic_Absorption_Emission.ppt
Atomic_Absorption_Emission.ppt
 
Presentation biological techinque copy
Presentation biological techinque   copyPresentation biological techinque   copy
Presentation biological techinque copy
 
1606732404-atomic-absorption-emission-2.ppt
1606732404-atomic-absorption-emission-2.ppt1606732404-atomic-absorption-emission-2.ppt
1606732404-atomic-absorption-emission-2.ppt
 
Mridu- AAS.pptx
Mridu- AAS.pptxMridu- AAS.pptx
Mridu- AAS.pptx
 
Atomic absorption spectroscopy
Atomic absorption spectroscopyAtomic absorption spectroscopy
Atomic absorption spectroscopy
 
Instru booklet (1)
Instru booklet (1)Instru booklet (1)
Instru booklet (1)
 
Atomic absorption spectrometer
Atomic absorption spectrometerAtomic absorption spectrometer
Atomic absorption spectrometer
 
Atomic absorption-spectrometry
Atomic absorption-spectrometryAtomic absorption-spectrometry
Atomic absorption-spectrometry
 
Atomic absorption-spectrometry
Atomic absorption-spectrometryAtomic absorption-spectrometry
Atomic absorption-spectrometry
 
1606732404-atomic-absorption-emission-2.ppt
1606732404-atomic-absorption-emission-2.ppt1606732404-atomic-absorption-emission-2.ppt
1606732404-atomic-absorption-emission-2.ppt
 
AAS.pptx
AAS.pptxAAS.pptx
AAS.pptx
 
Week 6-Atomic Absorption Spectroscopy.pptx
Week 6-Atomic Absorption Spectroscopy.pptxWeek 6-Atomic Absorption Spectroscopy.pptx
Week 6-Atomic Absorption Spectroscopy.pptx
 
Atomic Absorption Spectroscopy (AAS)
Atomic Absorption Spectroscopy (AAS)Atomic Absorption Spectroscopy (AAS)
Atomic Absorption Spectroscopy (AAS)
 
Atomic absorption & flame emissionn.pptx
Atomic absorption & flame emissionn.pptxAtomic absorption & flame emissionn.pptx
Atomic absorption & flame emissionn.pptx
 
Instru booklet
Instru bookletInstru booklet
Instru booklet
 
Atomic absorption spectroscopy
Atomic absorption spectroscopyAtomic absorption spectroscopy
Atomic absorption spectroscopy
 

Recently uploaded

Cultivation of KODO MILLET . made by Ghanshyam pptx
Cultivation of KODO MILLET . made by Ghanshyam pptxCultivation of KODO MILLET . made by Ghanshyam pptx
Cultivation of KODO MILLET . made by Ghanshyam pptxpradhanghanshyam7136
 
Luciferase in rDNA technology (biotechnology).pptx
Luciferase in rDNA technology (biotechnology).pptxLuciferase in rDNA technology (biotechnology).pptx
Luciferase in rDNA technology (biotechnology).pptxAleenaTreesaSaji
 
Is RISC-V ready for HPC workload? Maybe?
Is RISC-V ready for HPC workload? Maybe?Is RISC-V ready for HPC workload? Maybe?
Is RISC-V ready for HPC workload? Maybe?Patrick Diehl
 
Isotopic evidence of long-lived volcanism on Io
Isotopic evidence of long-lived volcanism on IoIsotopic evidence of long-lived volcanism on Io
Isotopic evidence of long-lived volcanism on IoSérgio Sacani
 
Call Girls in Munirka Delhi 💯Call Us 🔝9953322196🔝 💯Escort.
Call Girls in Munirka Delhi 💯Call Us 🔝9953322196🔝 💯Escort.Call Girls in Munirka Delhi 💯Call Us 🔝9953322196🔝 💯Escort.
Call Girls in Munirka Delhi 💯Call Us 🔝9953322196🔝 💯Escort.aasikanpl
 
Call Us ≽ 9953322196 ≼ Call Girls In Mukherjee Nagar(Delhi) |
Call Us ≽ 9953322196 ≼ Call Girls In Mukherjee Nagar(Delhi) |Call Us ≽ 9953322196 ≼ Call Girls In Mukherjee Nagar(Delhi) |
Call Us ≽ 9953322196 ≼ Call Girls In Mukherjee Nagar(Delhi) |aasikanpl
 
Boyles law module in the grade 10 science
Boyles law module in the grade 10 scienceBoyles law module in the grade 10 science
Boyles law module in the grade 10 sciencefloriejanemacaya1
 
Traditional Agroforestry System in India- Shifting Cultivation, Taungya, Home...
Traditional Agroforestry System in India- Shifting Cultivation, Taungya, Home...Traditional Agroforestry System in India- Shifting Cultivation, Taungya, Home...
Traditional Agroforestry System in India- Shifting Cultivation, Taungya, Home...jana861314
 
G9 Science Q4- Week 1-2 Projectile Motion.ppt
G9 Science Q4- Week 1-2 Projectile Motion.pptG9 Science Q4- Week 1-2 Projectile Motion.ppt
G9 Science Q4- Week 1-2 Projectile Motion.pptMAESTRELLAMesa2
 
VIRUSES structure and classification ppt by Dr.Prince C P
VIRUSES structure and classification ppt by Dr.Prince C PVIRUSES structure and classification ppt by Dr.Prince C P
VIRUSES structure and classification ppt by Dr.Prince C PPRINCE C P
 
Call Girls in Mayapuri Delhi 💯Call Us 🔝9953322196🔝 💯Escort.
Call Girls in Mayapuri Delhi 💯Call Us 🔝9953322196🔝 💯Escort.Call Girls in Mayapuri Delhi 💯Call Us 🔝9953322196🔝 💯Escort.
Call Girls in Mayapuri Delhi 💯Call Us 🔝9953322196🔝 💯Escort.aasikanpl
 
NAVSEA PEO USC - Unmanned & Small Combatants 26Oct23.pdf
NAVSEA PEO USC - Unmanned & Small Combatants 26Oct23.pdfNAVSEA PEO USC - Unmanned & Small Combatants 26Oct23.pdf
NAVSEA PEO USC - Unmanned & Small Combatants 26Oct23.pdfWadeK3
 
Hubble Asteroid Hunter III. Physical properties of newly found asteroids
Hubble Asteroid Hunter III. Physical properties of newly found asteroidsHubble Asteroid Hunter III. Physical properties of newly found asteroids
Hubble Asteroid Hunter III. Physical properties of newly found asteroidsSérgio Sacani
 
Artificial Intelligence In Microbiology by Dr. Prince C P
Artificial Intelligence In Microbiology by Dr. Prince C PArtificial Intelligence In Microbiology by Dr. Prince C P
Artificial Intelligence In Microbiology by Dr. Prince C PPRINCE C P
 
Analytical Profile of Coleus Forskohlii | Forskolin .pdf
Analytical Profile of Coleus Forskohlii | Forskolin .pdfAnalytical Profile of Coleus Forskohlii | Forskolin .pdf
Analytical Profile of Coleus Forskohlii | Forskolin .pdfSwapnil Therkar
 
Animal Communication- Auditory and Visual.pptx
Animal Communication- Auditory and Visual.pptxAnimal Communication- Auditory and Visual.pptx
Animal Communication- Auditory and Visual.pptxUmerFayaz5
 
Orientation, design and principles of polyhouse
Orientation, design and principles of polyhouseOrientation, design and principles of polyhouse
Orientation, design and principles of polyhousejana861314
 
Physiochemical properties of nanomaterials and its nanotoxicity.pptx
Physiochemical properties of nanomaterials and its nanotoxicity.pptxPhysiochemical properties of nanomaterials and its nanotoxicity.pptx
Physiochemical properties of nanomaterials and its nanotoxicity.pptxAArockiyaNisha
 

Recently uploaded (20)

Cultivation of KODO MILLET . made by Ghanshyam pptx
Cultivation of KODO MILLET . made by Ghanshyam pptxCultivation of KODO MILLET . made by Ghanshyam pptx
Cultivation of KODO MILLET . made by Ghanshyam pptx
 
Luciferase in rDNA technology (biotechnology).pptx
Luciferase in rDNA technology (biotechnology).pptxLuciferase in rDNA technology (biotechnology).pptx
Luciferase in rDNA technology (biotechnology).pptx
 
Is RISC-V ready for HPC workload? Maybe?
Is RISC-V ready for HPC workload? Maybe?Is RISC-V ready for HPC workload? Maybe?
Is RISC-V ready for HPC workload? Maybe?
 
Isotopic evidence of long-lived volcanism on Io
Isotopic evidence of long-lived volcanism on IoIsotopic evidence of long-lived volcanism on Io
Isotopic evidence of long-lived volcanism on Io
 
9953056974 Young Call Girls In Mahavir enclave Indian Quality Escort service
9953056974 Young Call Girls In Mahavir enclave Indian Quality Escort service9953056974 Young Call Girls In Mahavir enclave Indian Quality Escort service
9953056974 Young Call Girls In Mahavir enclave Indian Quality Escort service
 
Call Girls in Munirka Delhi 💯Call Us 🔝9953322196🔝 💯Escort.
Call Girls in Munirka Delhi 💯Call Us 🔝9953322196🔝 💯Escort.Call Girls in Munirka Delhi 💯Call Us 🔝9953322196🔝 💯Escort.
Call Girls in Munirka Delhi 💯Call Us 🔝9953322196🔝 💯Escort.
 
Call Us ≽ 9953322196 ≼ Call Girls In Mukherjee Nagar(Delhi) |
Call Us ≽ 9953322196 ≼ Call Girls In Mukherjee Nagar(Delhi) |Call Us ≽ 9953322196 ≼ Call Girls In Mukherjee Nagar(Delhi) |
Call Us ≽ 9953322196 ≼ Call Girls In Mukherjee Nagar(Delhi) |
 
Boyles law module in the grade 10 science
Boyles law module in the grade 10 scienceBoyles law module in the grade 10 science
Boyles law module in the grade 10 science
 
Traditional Agroforestry System in India- Shifting Cultivation, Taungya, Home...
Traditional Agroforestry System in India- Shifting Cultivation, Taungya, Home...Traditional Agroforestry System in India- Shifting Cultivation, Taungya, Home...
Traditional Agroforestry System in India- Shifting Cultivation, Taungya, Home...
 
The Philosophy of Science
The Philosophy of ScienceThe Philosophy of Science
The Philosophy of Science
 
G9 Science Q4- Week 1-2 Projectile Motion.ppt
G9 Science Q4- Week 1-2 Projectile Motion.pptG9 Science Q4- Week 1-2 Projectile Motion.ppt
G9 Science Q4- Week 1-2 Projectile Motion.ppt
 
VIRUSES structure and classification ppt by Dr.Prince C P
VIRUSES structure and classification ppt by Dr.Prince C PVIRUSES structure and classification ppt by Dr.Prince C P
VIRUSES structure and classification ppt by Dr.Prince C P
 
Call Girls in Mayapuri Delhi 💯Call Us 🔝9953322196🔝 💯Escort.
Call Girls in Mayapuri Delhi 💯Call Us 🔝9953322196🔝 💯Escort.Call Girls in Mayapuri Delhi 💯Call Us 🔝9953322196🔝 💯Escort.
Call Girls in Mayapuri Delhi 💯Call Us 🔝9953322196🔝 💯Escort.
 
NAVSEA PEO USC - Unmanned & Small Combatants 26Oct23.pdf
NAVSEA PEO USC - Unmanned & Small Combatants 26Oct23.pdfNAVSEA PEO USC - Unmanned & Small Combatants 26Oct23.pdf
NAVSEA PEO USC - Unmanned & Small Combatants 26Oct23.pdf
 
Hubble Asteroid Hunter III. Physical properties of newly found asteroids
Hubble Asteroid Hunter III. Physical properties of newly found asteroidsHubble Asteroid Hunter III. Physical properties of newly found asteroids
Hubble Asteroid Hunter III. Physical properties of newly found asteroids
 
Artificial Intelligence In Microbiology by Dr. Prince C P
Artificial Intelligence In Microbiology by Dr. Prince C PArtificial Intelligence In Microbiology by Dr. Prince C P
Artificial Intelligence In Microbiology by Dr. Prince C P
 
Analytical Profile of Coleus Forskohlii | Forskolin .pdf
Analytical Profile of Coleus Forskohlii | Forskolin .pdfAnalytical Profile of Coleus Forskohlii | Forskolin .pdf
Analytical Profile of Coleus Forskohlii | Forskolin .pdf
 
Animal Communication- Auditory and Visual.pptx
Animal Communication- Auditory and Visual.pptxAnimal Communication- Auditory and Visual.pptx
Animal Communication- Auditory and Visual.pptx
 
Orientation, design and principles of polyhouse
Orientation, design and principles of polyhouseOrientation, design and principles of polyhouse
Orientation, design and principles of polyhouse
 
Physiochemical properties of nanomaterials and its nanotoxicity.pptx
Physiochemical properties of nanomaterials and its nanotoxicity.pptxPhysiochemical properties of nanomaterials and its nanotoxicity.pptx
Physiochemical properties of nanomaterials and its nanotoxicity.pptx
 

Deference between atomic absorption spectrometry and atomic emission spectrometry

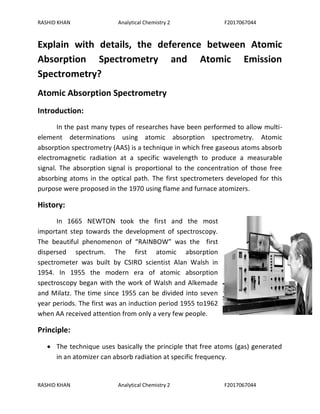
  • 1. RASHID KHAN Analytical Chemistry 2 F2017067044 RASHID KHAN Analytical Chemistry 2 F2017067044 Explain with details, the deference between Atomic Absorption Spectrometry and Atomic Emission Spectrometry? Atomic Absorption Spectrometry Introduction: In the past many types of researches have been performed to allow multi- element determinations using atomic absorption spectrometry. Atomic absorption spectrometry (AAS) is a technique in which free gaseous atoms absorb electromagnetic radiation at a specific wavelength to produce a measurable signal. The absorption signal is proportional to the concentration of those free absorbing atoms in the optical path. The first spectrometers developed for this purpose were proposed in the 1970 using flame and furnace atomizers. History: In 1665 NEWTON took the first and the most important step towards the development of spectroscopy. The beautiful phenomenon of “RAINBOW” was the first dispersed spectrum. The first atomic absorption spectrometer was built by CSIRO scientist Alan Walsh in 1954. In 1955 the modern era of atomic absorption spectroscopy began with the work of Walsh and Alkemade and Milatz. The time since 1955 can be divided into seven year periods. The first was an induction period 1955 to1962 when AA received attention from only a very few people. Principle:  The technique uses basically the principle that free atoms (gas) generated in an atomizer can absorb radiation at specific frequency.
  • 2. RASHID KHAN Analytical Chemistry 2 F2017067044 RASHID KHAN Analytical Chemistry 2 F2017067044  Atomic-absorption spectroscopy quantifies the absorption of ground state atoms in the gaseous state.  The atoms absorb ultraviolet or visible light and make transitions to higher electronic energy levels. The analyte concentration is determined from the amount of absorption.  Concentration measurements are usually determined from a working curve after calibrating the instrument with standards of known concentration.  Atomic absorption is a very common technique for detecting metals and metalloids in environmental samples. Schematic diagram of AAS: Light Source: The main component of an analytical absorption spectrometer is the light source, providing monochromatic light for the absorption process. Two types of light sources are mostly used. Hollow-cathode lamps contain a cathode of the analyte element and an anode, and are filled with a noble gas.  Hollow Cathode Lamp is the most common radiation source in AAS.  It contains a tungsten anode and a hollow cylindrical cathode made of the element to be determined.  These are sealed in a glass tube filled with an inert gas like neon or argon.  Each element has its own unique lamp which must be used for that analysis.
  • 3. RASHID KHAN Analytical Chemistry 2 F2017067044 RASHID KHAN Analytical Chemistry 2 F2017067044 Nebulizer: The nebulizer sucks up liquid sample at a controlled rate, create a fine aerosol that mixes with fuel and oxidant for introduction into the flame. The nebulizer uses the combustion flames to atomize and introduce the sample into the light path. Atomizer: Sample Atomization. Atomic Absorption Spectroscopy requires the conversion of the sample to gaseous atoms, which absorb radiation. The fine mist is carried to the atomizer, such as a flame, by a carrier gas. When the mist reaches the flame, the intense heat breaks up the sample into its individual atoms.  Elements to be analyzed needs to be in atomic sate.  Atomization is separation of particles into individual molecules and breaking molecules into atoms. This is done by exposing the analyte to high temperatures in a flame or graphite furnace. Monochromator: In effect, a monochromator produces monochromatic light by removing unwanted wavelengths from the source light beam. The function of the monochromator is to isolate a single atomic resonance line from the spectrum of lines emitted by the hollow cathode lamp.  This is a very important part in an AA spectrometer. It is used to separate out all of the thousands of lines.
  • 4. RASHID KHAN Analytical Chemistry 2 F2017067044 RASHID KHAN Analytical Chemistry 2 F2017067044  A monochromator is used to select the specific wavelength of light which is absorbed by the sample, and to exclude other wavelengths.  The selection of the specific light allows the determination of the selected element in the presence of others. Detector: The role of the detector is to convert a light signal into an electrical signal. The type of detector found in AAS is the photomultiplier tube. The principle of operation is the emission of electrons upon exposure to radiation. The detector contains a photoemissive cathode and a series of dynodes.  The light selected by the monochromator is directed onto a detector that is typically a photomultiplier tube , whose function is to convert the light signal into an electrical signal proportional to the light intensity.  The processing of electrical signal is fulfilled by a signal amplifier. The signal could be displayed for readout, or further fed into a data station for printout by the requested format. Calibration Curve: A calibration curve was used to determine the unknown concentration of an element in a solution. The different types of interference that were encountered in atomic absorption spectroscopy. Absorption of source radiation an element other than the one of interest may absorb the wavelength being used.  A calibration curve is used to determine the unknown concentration of an element in a solution. The instrument is calibrated using several solutions
  • 5. RASHID KHAN Analytical Chemistry 2 F2017067044 RASHID KHAN Analytical Chemistry 2 F2017067044 of known concentrations. The absorbance of each known solution is measured and then a calibration curve of concentration vs absorbance is plotted.  The sample solution is fed into the instrument, and the absorbance of the element in this solution is measured .The unknown concentration of the element is then calculated from the calibration curve Applications:  Environmental Sciences  Food technology  Pharmaceutical  Petrochemical  Geochemical/Mining  Bio mentoring  Agriculture  Nanomaterial  Pathology Atomic Emission Spectrometry Introduction: Atomic emission spectroscopy (AES) is a method of chemical analysis that uses the intensity of light emitted from a flame, plasma, arc, or spark at a particular wavelength to determine the quantity of an element in a sample. ... The sample may be excited by various methods. Technique is also known as OPTICAL EMISSION SPECTROSCOPY .The study of radiation emitted by excited atoms and monatomic ions. Relaxation of atoms in the excited state results in emission of light. Produces line spectra in the UV-VIS and the vacuum UV regions. Used for qualitative identification of elements present in the sample. Also for quantitative analysis from ppm levels to percent
  • 6. RASHID KHAN Analytical Chemistry 2 F2017067044 RASHID KHAN Analytical Chemistry 2 F2017067044 Multielement technique can be used to determine metals, metalloids, and some nonmetals simultaneously Emission wavelength and energy are related by ΔE = hc/λ Does not require light source excited atoms in the flame emit light that reaches the detector (luminescence) Techniques Based on Excitation Source Flame Photometry. Furnace. Inductively Coupled Plasma. History: Atomic emission spectroscopy has a long history. Qualitative applications based on the color of flames were used in the smelting of ores as early as 1550 and were more fully developed around 1830 with the observation of atomic spectra generated by flame emission and spark emission. Principle:  Principle Atomic emission spectroscopy is also an analytical technique that is used to measure the concentrations of elements in samples. It uses quantitative measurement of the emission from excited atoms to determine analyte concentration.  The analyte atoms are promoted to a higher energy level by the sufficient energy that is provided by the high temperature of the atomization sources . The excited atoms decay back to lower levels by emitting light. Emissions are passed through monochromators or filters prior to detection by photomultiplier tubes.  The instrumentation of atomic emission spectroscopy is the same as that of atomic absorption, but without the presence of a radiation source . In atomic Emission the sample is atomized and the analyte atoms are excited to higher energy levels.
  • 7. RASHID KHAN Analytical Chemistry 2 F2017067044 RASHID KHAN Analytical Chemistry 2 F2017067044 Schematic Diagram of an Atomic Emission spectrometer Sources Atomic emission requires a means for converting a solid, liquid, or solution analyte into a free gaseous atom. The same source of thermal energy usually serves as the excitation source. The most common methods are flames and plasmas, both of which are useful for liquid or solution samples.  Flame still used for metal atoms  Alternating current arc (AC arc)  Direct current (DC arc)  Alternating current spark (AC spark)  Direct current Plasma  Microwave Induced Plasma  Inductively Coupled Plasma the most important technique Flame Flame Atomic Emission Spectroscopy of water samples using nitrous oxide/acetylene flame can be performed at relatively low cost using a diode array spectrometer and a high temperature nitrous oxide acetylene flame, and allows
  • 8. RASHID KHAN Analytical Chemistry 2 F2017067044 RASHID KHAN Analytical Chemistry 2 F2017067044 the rapid determination of main group metals in the low ppm range with good precision  It is used for those molecules which do not require very high temperatures for excitation into atoms during quantitative analysis.  Sample in solution form and sprayed into the flame of a burner. Three types of high-temperature plasma  Plasma an electrically conducting gaseous mixture containing significant concentrations of cations and electrons.  The inductively coupled plasma  The direct current plasma  The microwave induced plasma. The most important of these plasmas is the inductively coupled plasma. Sample holder The function of sample holder is to introduce the sample into the electrical discharge. Atomic emission spectroscopy is a method of chemical analysis that uses the intensity of . A sample of a material is brought into the flame as a gas, sprayed solution, Coning and quartering , Dilution, Dissolution, Filtration , Masking, Pulverization, Sample preparation, Separation process , Two types  Solid samples  Liquid samples Detectors  For Quantitative analysis photographic plate is used on which all the emission lines from the samples are recorded.  This photograph of the emission spectrum helps in the measurement of wavelength of radiation lines.
  • 9. RASHID KHAN Analytical Chemistry 2 F2017067044 RASHID KHAN Analytical Chemistry 2 F2017067044  From these lines emitting elements can be identified.  The instrument with photographic recording is called spectrograph and the one using photoelectric device as spectrometer Nebulizer: The general term nebulizer refers to an apparatus that converts liquids into a fine mist. Analytical nebulizers are a special category in that their purpose is to deliver a fine mist to spectrometric instruments for elemental analysis.  Convert solution to fine spray or aerosol  Ultrasonic nebulizer  Uses ultrasound waves to "boil" solution flowing across disc  Pneumatic nebulizer  Uses high pressure gas to entrain solution Monochromator: The excitation source must desolvate, atomize and excite the analyte atoms. The flame supplies the sufficient energy to promote the atoms into high energy levels. As the atoms decay to their ground stage, the emitted radiation passes through the monochromator that isolates the specific wavelength for desired analysis.  even with many lines, much spectrum contains no information  rapidly scanned (slewed) across blank regions (between atomic emission lines)  From 165 nm to 800 nm in 20 m sec  slowly scanned across lines to 0.001 nm increment  computer control/pre-selected lines to scan Application: The principal application of atomic emission spectroscopy is to determine the proportional quantity of a particular element in a given sample. The various methods of atomic emission spectroscopy are utilized to examine different substances such as foods and drinks, motor oil and soil samples.
  • 10. RASHID KHAN Analytical Chemistry 2 F2017067044 RASHID KHAN Analytical Chemistry 2 F2017067044  Qualitative analysis is done using AES in the same manner in which it is done using FES. The spectrum of the analyte is obtained and compared with the atomic and ionic spectra of possible elements in the analyte. Generally an element is considered to be in the analyte if at least three intense lines can be matched with those from the spectrum of a known element.  Quantitative analysis with a plasma can be done using either an atomic or an ionic line. Ionic lines are chosen for most analyses because they are usually more intense at the temperatures of plasmas than are the atomic lines.  In determining the impurities of Ni, Mn, Cu, Al etc., in iron and steel in metallurgical processes. The percentage determined is 0.001% in iron to 30 in steel.  Lubricating oils can be analysed for Ni, Fe, Mn etc.,  Solid samples and animal tissues have been analysed for several elements including K, Na, Ca, Zn, Ni, etc.  To detect 40 elements in plants and soils, thus metal deficiency in plants and soils can be diagnosed.
  • 11. RASHID KHAN Analytical Chemistry 2 F2017067044 RASHID KHAN Analytical Chemistry 2 F2017067044 References:  Harnly, J. M., et al. "Background-corrected simultaneous multielement atomic absorption spectrometer." Analytical Chemistry 51.12 (1979): 2007- 2014.  Sholupov, S., et al. "Zeeman atomic absorption spectrometer RA-915+ for direct determination of mercury in air and complex matrix samples." Fuel Processing Technology 85.6-7 (2004): 473-485.  Chan, Mei-Shu, and Shang-Da Huang. "Direct determination of cadmium and copper in seawater using a transversely heated graphite furnace atomic absorption spectrometer with Zeeman-effect background corrector." Talanta 51.2 (2000): 373-380.  Chan, Mei-Shu, and Shang-Da Huang. "Direct determination of cadmium and copper in seawater using a transversely heated graphite furnace atomic absorption spectrometer with Zeeman-effect background corrector." Talanta 51.2 (2000): 373-380.  McQuaker, Neil R., Paul D. Kluckner, and Gok N. Chang. "Calibration of an inductively coupled plasma-atomic emission spectrometer for the analysis of environmental materials." Analytical Chemistry 51.7 (1979): 888-895.  Pilon, Michael J., et al. "Evaluation of a new array detector atomic emission spectrometer for inductively coupled plasma atomic emission spectroscopy." Applied spectroscopy 44.10 (1990): 1613-1620.  Ahmad, Shakeel, Ramesh C. Murthy, and Satya V. Chandra. "Chromium speciation by column chromatography using a direct current plasma atomic emission spectrometer." Analyst 115.3 (1990): 287-289.