2. Flame Atomic Emission Spectroscopy
Flame atomic emission spectroscopy, also called flame photometry
Based on measurement of emission spectrum produced when a solution containing metals or
nonmetals such as halides, sulfur, or phosphorus is introduced into a flame.
In early experiments, the detector used was the analyst’s eye.
Elements that emitted visible light could be identified qualitatively
These “flame tests” were used to confirm the presence of certain elements in sample,
particularly alkali &alkaline-earth metals.
A list of visible colors emitted by elements in a flame is given in Table 7.1.
Spectrometer & photon detector such as a photomultiplier tube (PMT) or charge-coupled
device (CCD) permits more accurate identification of elements present.
3. Continue…………
In addition, use of a photon detector permits quantitative analysis of sample.
The wavelength of radiation indicates what element is present, & radiation intensity indicates
how much of element is present.
Flame AES is particularly useful for determination of elements in first two groups of periodic
table, including sodium, potassium, lithium, calcium, magnesium, strontium, & barium.
Determination of these elements is often called for in medicine, agriculture, & animal science.
4.
5.
6.
7. Instrumentation for Flame OES
Flame OES can be performed using most modern atomic absorption spectrometers.
No external lamp is needed as flame serves as both atomization source & excitation source.
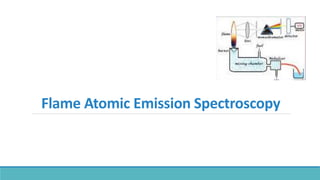
A schematic diagram of a flame emission spectrometer based on single beam atomic
absorption spectrometer is shown in Figure 7.2.
For measurement of alkali metals in clinical samples such as serum or urine, only a low-
resolution filter photometer is needed because of simplicity of spectra.
Both instruments require a burner assembly, a flame, a wavelength selection device, & a
detector.
8. Burner Assembly
Central component of a flame emission spectrometer is burner assembly which has a device to
nebulize sample & then introduce sample aerosol into flame.
In the flame, free atoms are formed & then excited, which causes them to emit radiant energy.
It is essential that emission intensity be steady over reasonable periods of time (1–2 min).
Lundegardh (Air-Acetylene) or premix (efficiency of 20,000 to 70,000 Btu/hr and produces a
short flame) burner is most commonly used and is depicted in Figure 6.8a.
In premix burner, sample, in solution form, is first aspirated into a nebulizer where it forms an
aerosol or spray.
An impact bead or flow spoiler is used to break droplets from nebulizer into even smaller
droplets.
9. Larger droplets coalesce on the sides of the spray chamber and drain away.
Smaller droplets and vapor are swept into the base of the flame in the form of a cloud.
An important feature of this burner is that only a small portion (about 5%) of aspirated sample
reaches flame.
The droplets that reach the flame are, however, very small & easily decomposed.
High atomization efficiency leads to increased emission intensity & increased analytical
sensitivity compared with other burner designs.
The process that occurs in burner assembly & flame is outlined in Table 7.2.
Common nebulizers used in FOES are pneumatic nebulizer & cross-flow nebulizer
Continue…………
10.
11. Wavelength Selection Devices
Two wavelength selectors are used in flame OES, monochromators & filters.
Monochromators: have slits & dispersion elements.
The common dispersion element in modern flame atomic absorption & emission
spectrometers is a diffraction grating.
Filters: Alkali metals in a low-temperature flame emit only a few lines & therefore have a
simple emission spectrum.
In this case, wider wavelength ranges may be allowed to fall on detector without causing
errors, so an optical filter may replace more expensive diffraction grating.
Filters are built with materials that are transparent over a narrow spectral range.
Transparent spectral range is designed to be one in which emission from a given element
occurs.
12. When a filter is placed between the flame & detector, radiation of desired wavelength from the
sample is allowed to reach the detector & measured.
Other radiation is absorbed by filter & is not measured.
Therefore, separate filter is required for each element to be measured.
Instruments that use filters as wavelength selectors are convenient for simple repetitive
analysis but limited with regard to number of elements for which they can be used.
Most flame photometers are single channel instruments.
Multichannel instruments have been designed where emission from flame falls on two or more
filters.
Each filter transmits radiation for which it has been designed, and transmitted radiation falls on
a PMT behind the filter.
Continue…………
13. Intensity of radiation is measured for calibration standards, blanks, and samples.
A calibration curve of concentration versus emission intensity is made for standards & the
concentration of sample is determined by comparison to calibration curve.
This multichannel approach permits use of an internal standard (IS) to improve precision.
Filter photometers designed for hospital or veterinary laboratories often have autosamplers &
autodilutors attached, permitting the unattended analysis of many samples per hour.
Continue…………
14. Detectors
The detectors in common use for these systems are the PMT or solid-state detectors such as
CCDs and charge injection devices (CIDs).
15. Flame Excitation Source
Flame is result of the exothermic chemical reaction between two gases, one of which serves as
fuel & other as the oxidant.
Common oxidants for modern AAS/OES systems are air & nitrous oxide.
Only fuel used in modern AAS/OES systems is acetylene, although commercial filter
photometer systems can use propane, natural gas, or butane as fuel.
When a liquid sample is introduced into a flame, a complex process to produce excited-state
atoms occurs.
Spectral emission lines are generated by excited atoms formed during the process of
combustion in a flame.
Emission lines are characterized by wavelength & intensity.
16. The wavelengths emitted depend on atoms present.
Each element has a different set of quantized energy levels (such as those shown schematically
in Figure 7.1) & will emit different, characteristic wavelengths of light.
The intensity of emission depends on several factors including
concentrations of elements in sample
rate at which excited atoms are formed in flame
the rate at which sample is introduced into the flame
the composition of the flame
the temperature of the flame.
Continue…………
17. The intensity–concentration relationship is the basis for quantitative analysis by flame OES.
Flame temperature is probably the most important single variable in flame photometry.
In general, increase in flame temperature causes an increase in emission intensity.
This does not happen with elements that ionize easily, such as sodium, potassium, & lithium.
If these elements are heated at too high, they become ionized.
If the atoms ionize, the valence electrons are lost & therefore cannot return to ground state &
emit atomic radiation in process.
Results in loss of atomic emission intensity.
These elements must be determined in low-temperature flames to minimize ionization.
Continue…………
18. Ratio of number of atoms in an upper excited state to number of atoms in a lower energy state
can be calculated from Maxwell–Boltzmann equation;
𝑁1
𝑁𝑂
=
𝑔1
𝑔𝑜
𝑒−∆𝐸/𝑘𝑇Eq.7.1
Where; N1 is the number of atoms in the upper state
N0 is the number of atoms in the lower state
g1 &g0 are the number of states having equal energy at each level 0, 1, etc.
ΔE is the energy difference between the upper and lower states (J)
k is the Boltzmann constant = 1.381 × 10⁻²³ J/K,
T is the absolute temperature (K)
Continue…………
19. The Boltzmann distribution assumes the system is in thermal equilibrium.
The emission intensity is related to the number of atoms in the higher excited state, N1
By this equation, we can calculate ratio of number of excited-state atoms at two different
temperatures.
For potassium atoms, major atomic emission line occurs at 766.5 nm.
The energy of this transition in joules is ∆E = hc/λ
∆E = (6.626 ∗ 10−34Js) (2.998 ∗ 108m/s)/(766.5 nm)(1 ∗ 109m/nm)
∆E = 2.59 ∗ 10−19J
Continue…………
20. The temperature in a typical air–acetylene flame is about 2200°C or 2473 K.
The ratio of excited state potassium atoms at 2498 versus 2473 K is calculated by dividing the
Boltzmann equation at 2498 K by that at 2473 K.
N0 and the degeneracy terms cancel and we are left with
𝑁2498
𝑁2473
= exp[−2.59 ∗ 10−19
(J)/1.38*10−23
(J/K)(2498K)]/exp[-−2.59 ∗ 10−19
(J)/1.38*10−23
(J/K)(2473K)]
𝑁2498
𝑁2473
= 1.08
This tells us that a 25 K increase in flame temperature results in an 8% increase in the excited-
state population of potassium atoms that give rise to this emission line.
The intensity of emission line is directly proportional to the excited-state population, even for
systems not in thermal equilibrium.
Continue…………
21. Relationship between emission intensity, S, & excited-state population can be expressed as
S = kN (7.2)
Where; S is the intensity, k is a proportionality constant & N is the excited-state atom population
S is related directly to the number of atoms in excited state.
As absolute temperature increases, number of atoms in excited state increases.
AES is very sensitive to changes in temperature.
Temperature in atomizer must be carefully controlled for quantitative measurement of
emission intensity.
Table 7.3 lists representative maximum temperatures for some common flames.
Continue…………
22.
23. As energy required to cause excitation increases, it is more difficult to excite atoms, & the
number of atoms in excited state decreases.
As a consequence of relationship ΔE = hν = hc/λ, a decrease in wavelength of emission line
indicates that more energy is required to excite the atom.
The process becomes difficult, fewer atoms are excited, & intensity of radiation decreases.
Consequently, elements with emission lines in short-wavelength part of spectrum give weak
emission signals in low-temperature flames.
For these elements, high-temperature nitrous oxide–acetylene flame is favored, or the high-
energy electrical or plasma excitation sources should be used.
Continue…………
24. Another factor that influences emission intensity is the ratio of fuel to oxidant in flame.
Highest flame temperature is obtained when a stoichiometric mixture of the two is used.
In a stoichiometric flame, number of moles of fuel & oxidant present react completely.
Any excess of oxidant or fuel results in decrease in temperature of flame.
However, some atoms are unstable in certain kinds of flames.
Al atoms oxidize very quickly in a stoichiometric flame or a flame with an excess of oxidant.
Al2O3 emits molecular radiation not at same wavelength as line emission associated with Al.
This results in a direct loss of atomic emission intensity.
To prevent formation of Al2O3, flame is usually run in a “reducing state,” with an excess of fuel.
Continue…………
25. The excess fuel “mops up” free oxidant & minimizes oxidation of Al in flame.
Some elements emit more strongly in oxidizing flames.
Moreover, excess O2 decompose other materials present in sample & reduces molecular
background.
Manufacturers of flame emission instruments provide a list of recommended flame
compositions for elements measured by OES.
Table 7.A.1 in Appendix 7.A provides flame OES detection limits (DLs) for many elements and
identifies the flame used.
Continue…………
26. Interferences
Radiation intensity measured may not represent the concentration of analyte in sample
accurately because of the presence of interferences.
Interferences fall into two categories: spectral & nonspectral.
Three principal sources of interference are encountered in flame OES.
27. Chemical Interference
If analyte is present in sample with anions combines strongly, it will not decompose to free
atoms.
If anions present in solution combine only weakly with analyte, decomposition & formation of
free atoms will be easier. This effect is called chemical interference.
Chemical interference is a nonspectral interference.
It can be reduced or eliminated in a number of ways.
Analyte ion may be extracted away from sample matrix by using a chelating agent or the
interfering anion may be removed by ion exchange.
Standards can be made from same salt present in sample.
A releasing agent may be added to sample solution.
28. Excitation & Ionization Interferences
Excitation & ionization interferences are nonspectral interferences.
When sample is aspirated into a flame, elements in sample may form neutral atoms, excited
atoms, & ions.
These species exist in a state of dynamic equilibrium that gives rise to a steady emission signal.
If samples contain different amounts of elements, the position of equilibrium may be shifted.
This may affect the intensity of atomic emission.
This is excitation interference & is generally restricted to the alkali metals.
Can be overcome by matrix matching the samples & standards, where sample composition is
known.
In M.M is not practical, the methods of standard additions (MSA) can be used.
29. A related problem is ionization interference.
If analyte atoms are ionized in the flame, they cannot emit atomic emission wavelengths, & a
reduction in atomic emission intensity will occur.
It can be prevented by the phenomena of ionization suppressant.
Use of ionization suppressants is recommended for best sensitivity & accuracy when
determining these elements.
Continue…………
30. Spectral Interferences
There are two types of spectral interferences in flame OES
background radiation
overlapping line emission from different elements.
An example of background emission from an air–acetylene flame is illustrated in Figure 7.3.
In order to accurately determine intensity emitted by atom of interest, the intensity due to
background emission must be measured & subtracted from the total intensity.
A blank solution is aspirated & intensity at the analyte wavelength is measured.
This intensity is due to the background emission, since no analyte is present.
Then the sample & standard solutions are aspirated & their intensity measured.
31.
32. Sample or standard intensity is due to sum of background emission plus analyte emission.
Subtraction of blank intensity from sample or standard intensity results in intensity due to
analyte.
Second method for measuring background intensity is to measure background intensity of
actual sample at a wavelength very close to analyte emission line.
This intensity is then subtracted from intensity of sample measured at analyte emission
wavelength.
This approach can be less accurate than first method if the background spectrum is not “flat” in
region of interest.
Continue…………
33. Other type of spectral interference is emission by another element of same wavelength as
analyte .
Analyst may choose another analyte wavelength, extract the interfering element, or apply a
correction factor if concentration of interfering element is known.
By “same wavelength” mean that instrument cannot resolve the interfering line from analyte
line, even if actual wavelengths are slightly different.
Spectral bandpass is such that both wavelengths pass through the exit slit of system to
detector.
For this reason, high-resolution spectrometers are needed for nonflame OES.
Continue…………
34. Analytical Applications of Flame OES
Qualitative Analysis: atomic emission spectroscopy is an excellent qualitative method for
determining multiple elements in samples.
Presence of elements in a sample is determined qualitatively by observing emission at
wavelength characteristic of element.
Flame OES is a fast, simple method for qualitative identification of the group 1 and 2 elements
Can be used for any element that emits radiation in a flame provided care is taken to
discriminate emission lines from any spectral interference.
35. Quantitative Analysis
Flame OES can be used to determine the concentrations of elements in samples.
The sample usually must be in solution form.
Generally, one element is determined at a time if using an AAS system in emission mode.
Multichannel instruments are available for the simultaneous determination of two or more
elements.