Art and Science
of TaperingWill Kirousis BS, CSCS, CISSN | Tri-Hard
Performance
Time
Optimal Performance
Overload
Training
Normal
Training
Taper Period
Performance
Time
The Training Process:
Overload + Recovery =
Improved Performance
Fitness
Tri-Hard athlete & Pro MTB racer Gered
Dunne on his way to winning the “Race to
the Top of VT”!
Performanceata%of
NormalTrainingLoad
Months
Time
95
96
97
98
99
100
101
102
103
104
105
Normal Training
Overload
Training
Taper
Training
2-4 weeks 1-4 Weeks
The what and why of tapering?
Minimize negative influences and maximize positive influences
Peak Performance
Fatigue
Variable Change Performance
Outcome
Capillary Density Stable Total performance
increases by .5-6%
after a well executed
taper!
Olympic Distance
Triathlon Example:
Swim pace could
drop from 1:30 to
1:24/100 in
Bike power could
increase from 280W
to 297W
Run pace could
decrease from
7:30/mi to 7:03/mi
VO2max Increase
Economy Increase
Oxidative Enzymes Increase
Mitochondria Density Increase
Glycogen Increase
Tissue oxygen extraction Increase
Lactate at submax workloads Decrease
Lactate at max Increase
Myofibrillar ATPase Increase
Muscular force/power/shortening
velocity
Increase
Endocrine Increase
Immune System Increase
HR : RPE Improves
Physiological Changes in Response to Tapering
Tri-Hard athlete Nadine Mueller after winning
the 24 hours of Adrenaline MTB Race!
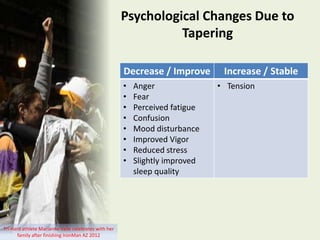
Psychological Changes Due to
Tapering
Decrease / Improve Increase / Stable
• Anger
• Fear
• Perceived fatigue
• Confusion
• Mood disturbance
• Improved Vigor
• Reduced stress
• Slightly improved
sleep quality
• Tension
Tri-Hard athlete Marianne Valle celebrates with her
family after finishing IronMan AZ 2012
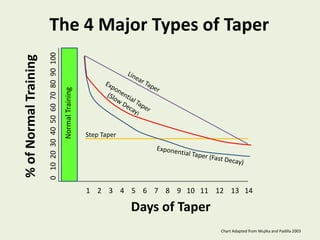
%ofNormalTraining
0102030405060708090100
NormalTraining
Step Taper
1 2 3 4 5 6 7 8 9 10 11 12 13 14
Days of Taper
Chart Adapted from Mujika and Padilla 2003
The 4 Major Types of Taper
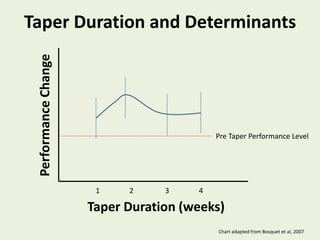
Taper Duration and Determinants
PerformanceChange
1 2 3 4
Taper Duration (weeks)
Pre Taper Performance Level
Chart adapted from Bosquet et al, 2007
Manipulating Training
Variables During the Taper
Frequency Volume Intensity
Close to stable (up
to 1 day less / sport
/ week
Newer/less skilled
athletes can
perform well with
as much as a 30-
50% reduction
Skilled athletes
perform worse with
more than a 20%
reduction in
frequency
40-60% reduction
in volume
Less reduction in
volume has very
little validity to
assist performance
Up to 75% may
benefit
performance
Maintain 25-50 of
the amount of high
intensity training
being performed:
Intervals @ Race
intensity and up to
or beyond
“threshold”
pending sport
Tri-Hard athlete Mark Alderman racing the
Xterra World Championships in 2014!
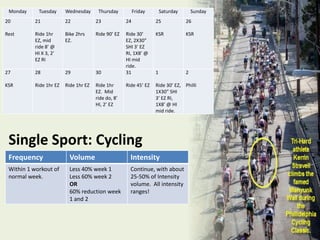
Monday Tuesday Wednesday Thursday Friday Saturday Sunday
20
Rest
21
Ride 1hr
EZ, mid
ride 8’ @
HI X 3, 2’
EZ RI
22
Bike 2hrs
EZ.
23
Ride 90’ EZ
24
Ride 30’
EZ, 2X30”
SHI 3’ EZ
RI, 1X8’ @
HI mid
ride.
25
KSR
26
KSR
27
KSR
28
Ride 1hr EZ
29
Ride 1hr EZ
30
Ride 1hr
EZ. Mid
ride do, 8’
HI, 2’ EZ
31
Ride 45’ EZ
1
Ride 30’ EZ,
1X30” SHI
3’ EZ RI,
1X8’ @ HI
mid ride.
2
Philli
Single Sport: Cycling
Frequency Volume Intensity
Within 1 workout of
normal week.
Less 40% week 1
Less 60% week 2
OR
60% reduction week
1 and 2
Continue, with about
25-50% of Intensity
volume. All intensity
ranges!
Monday Tuesday Wednesday Thursday Friday Saturday Sunday
15
Bike 2hrs @
MI
16
Run 7 miles
@ MI
17
Swim 60’ @
MI. Mid swim
do 1X8’ @ HI
18
Bike 1hr @ EZ
Mid ride do
2X5’ @ HI, 2’
EZ RI
Run 30’ @ MI,
mid run do
1X6’ @ HI
19
Swim 2.4K
20
Bike 1.5hours
@ MI
Run 4 miles
@ MI
21
Rest
22
Swim
continuously
for 30’. Start
MI, but do
the final 8’ @
HI effort.
23
Bike 45’ @ MI
Run 30’ @ MI,
mid run, do
2X3’ @ HI, 2’
EZ RI
24
Swim 20’
continuously
at an MI
intensity
25
Bike 45’ @
MI, mid ride,
do 2X3’ @ HI,
2’ EZ RI
Run 20’ @ MI
26
Rest
27
Bike 30’ @ MI
Optional:
Swim 10’ @
race venue @
MI.
28
Enjoy IM LP
Focus on YOU
Focus on you
NOW
Focus on you
now
PERSISTING
Focus on you
now DOING
WELL
Multi-Sport: Triathlon
Frequency Volume Intensity
Within 1 workout of
normal week.
Less 40% week 1
Less 60% week 2
Continue, with about
25-50% of Intensity
volume. Estimated
race intensity, up to
“threshold”.
Tri-Hard athlete Karen Zunti finishing
IM Canada strongly!
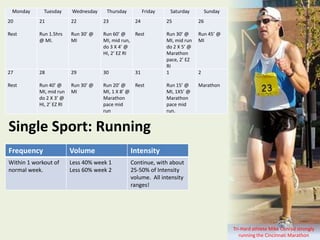
Monday Tuesday Wednesday Thursday Friday Saturday Sunday
20
Rest
21
Run 1.5hrs
@ MI.
22
Run 30’ @
MI
23
Run 60’ @
MI, mid run,
do 3 X 4’ @
HI, 2’ EZ RI
24
Rest
25
Run 30’ @
MI, mid run
do 2 X 5’ @
Marathon
pace, 2’ EZ
RI
26
Run 45’ @
MI
27
Rest
28
Run 40’ @
MI, mid run
do 2 X 3’ @
HI, 2’ EZ RI
29
Run 30’ @
MI
30
Run 20’ @
MI, 1 X 8’ @
Marathon
pace mid
run
31
Rest
1
Run 15’ @
MI, 1X5’ @
Marathon
pace mid
run.
2
Marathon
Single Sport: Running
Frequency Volume Intensity
Within 1 workout of
normal week.
Less 40% week 1
Less 60% week 2
Continue, with about
25-50% of Intensity
volume. All intensity
ranges!
Tri-Hard athlete Mike Conrad strongly
running the Cincinnati Marathon
Will Kirousis
will@tri-hard.com
978.466.5151
@willkirousis
Tri-Hard athlete Greg Watson is all
smiles on his way to 3rd place
international competitor at the
Annapurna 100K Trail Race in Nepal!