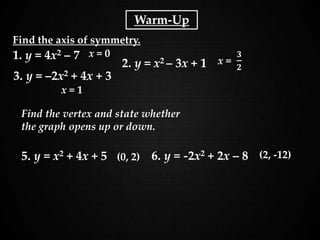
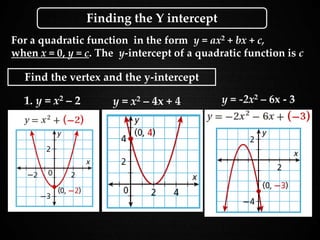
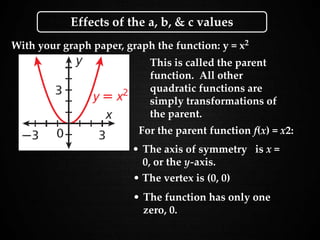
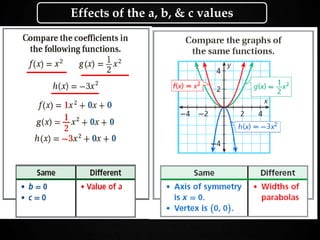
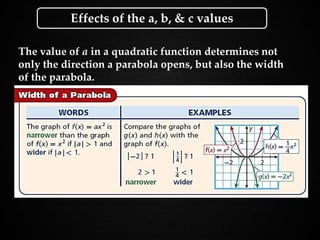
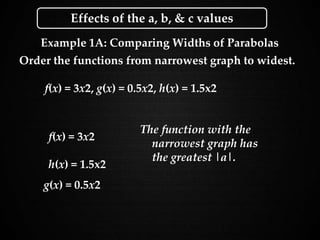
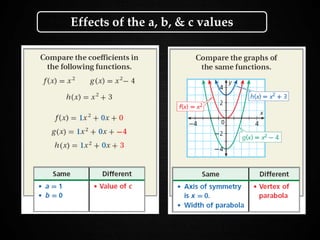
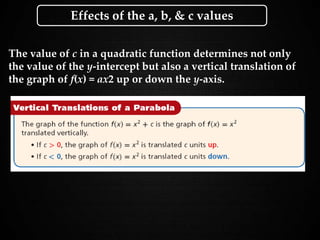
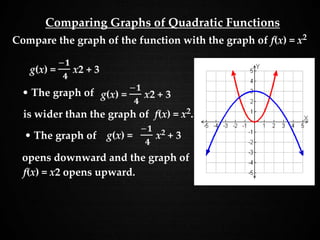
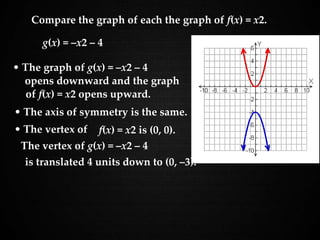
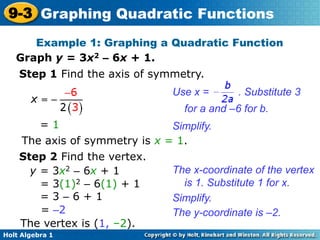
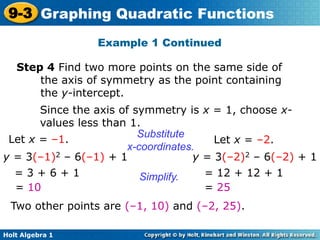
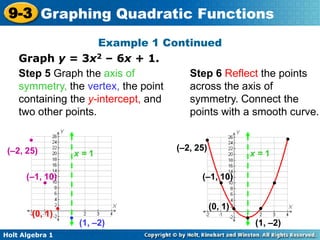
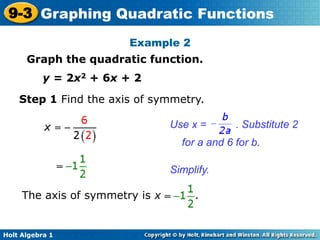
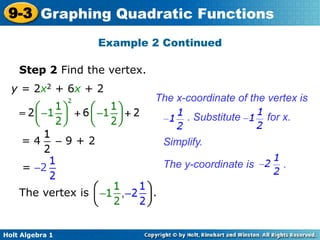
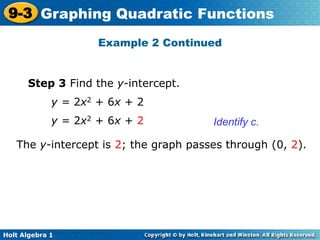
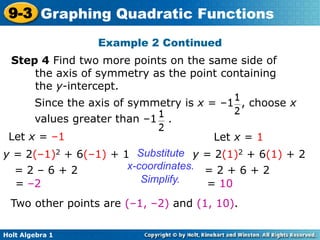
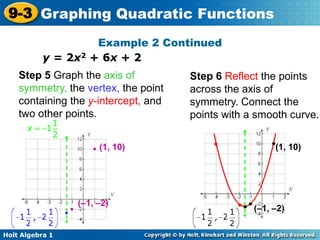
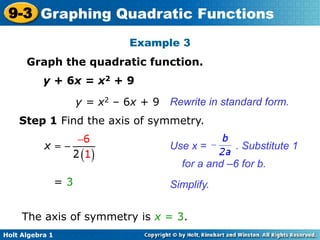
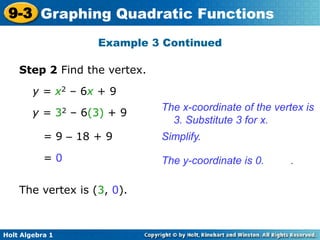
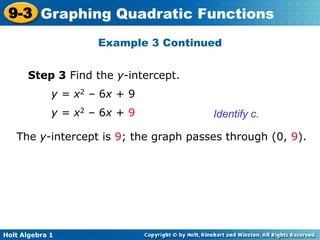
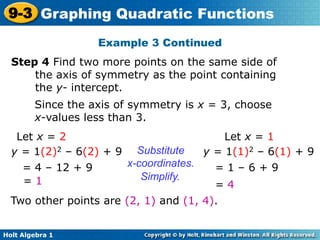
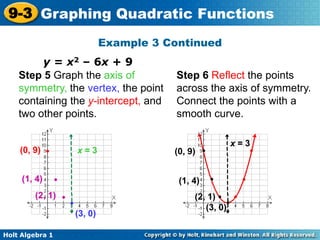
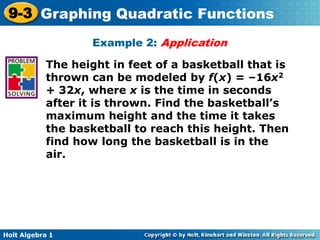
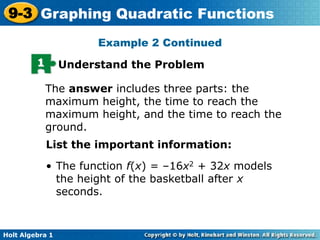
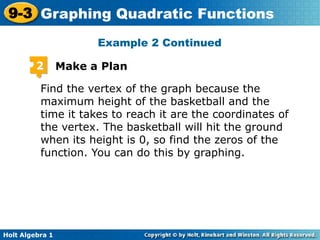
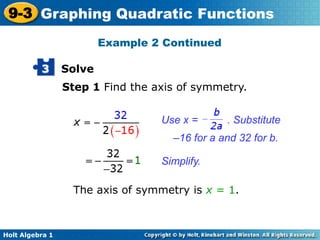
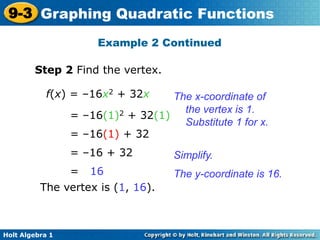
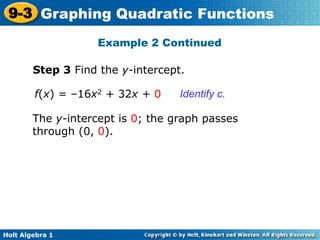
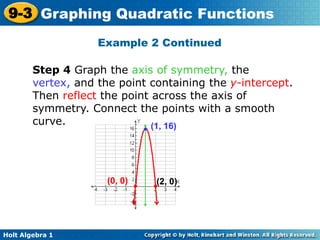
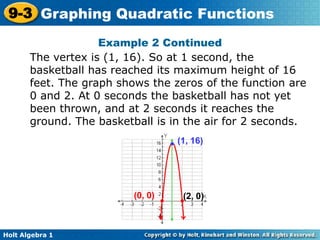
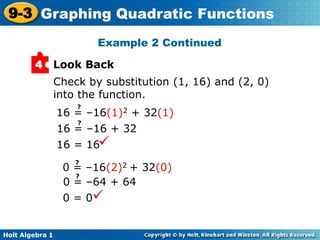
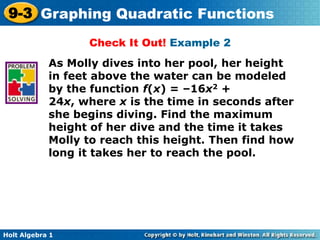
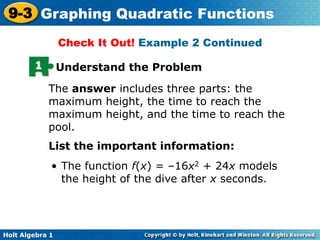
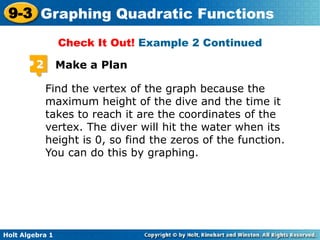
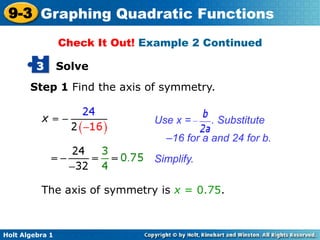
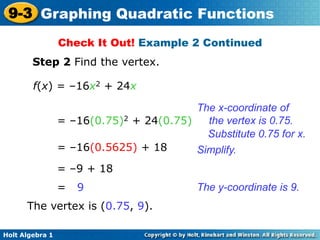
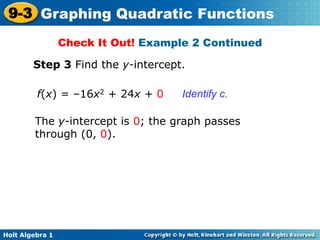
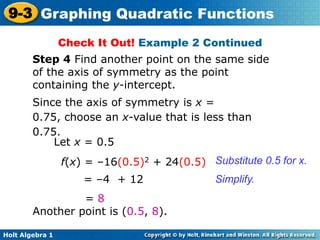
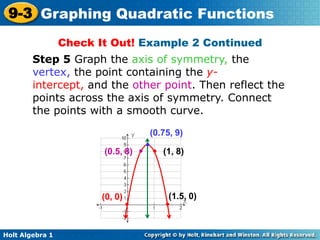
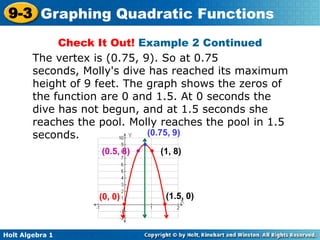
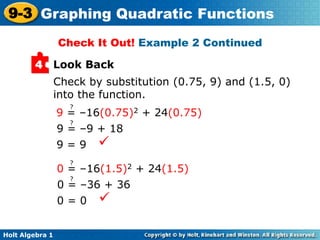
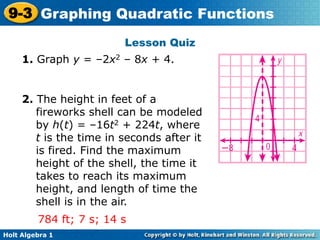
The document provides examples and explanations for graphing quadratic functions. It begins with an overview of how the a, b, and c values in the quadratic function y=ax2 + bx + c impact the graph. Examples are then worked through step-by-step to show how to find the axis of symmetry, vertex, y-intercept, and additional points to graph the function. An application example models the height of a basketball shot as a quadratic function to find the maximum height and time to reach it. The document concludes with a check your understanding example modeling the height of a dive.


![Getting Started with Apache Spark: Big Data Made Simple [Free Meetup]](https://cdn.slidesharecdn.com/ss_thumbnails/apachesparkgettingstarted-260203175547-8361bcc3-thumbnail.jpg?width=640&height=640&fit=bounds)


