
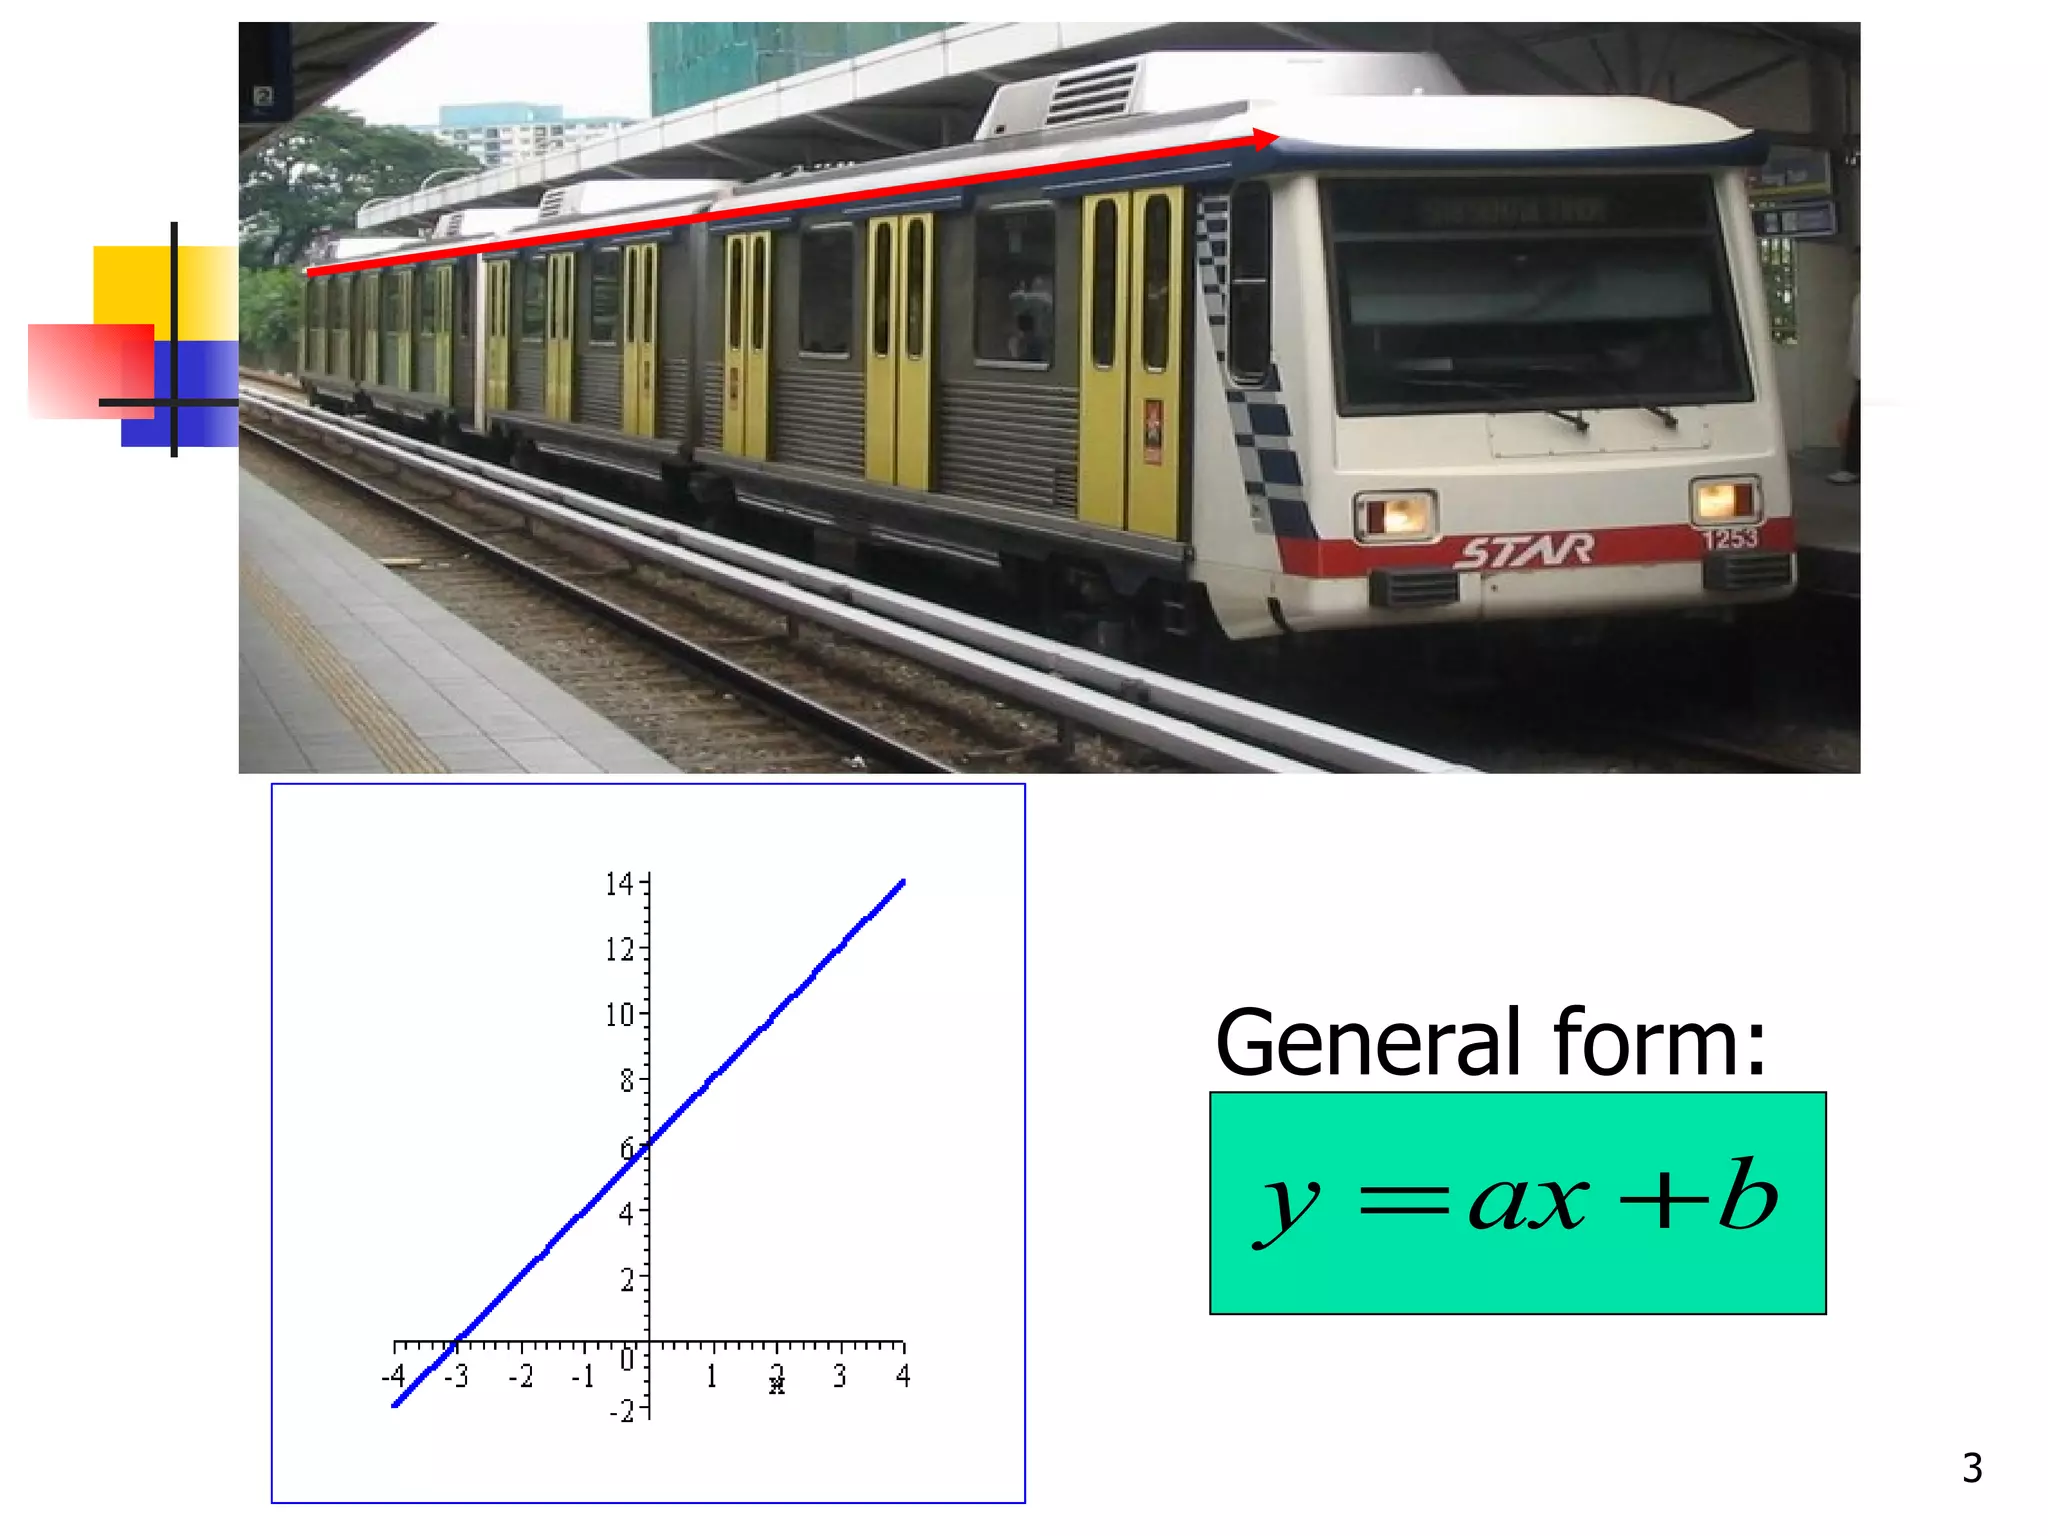
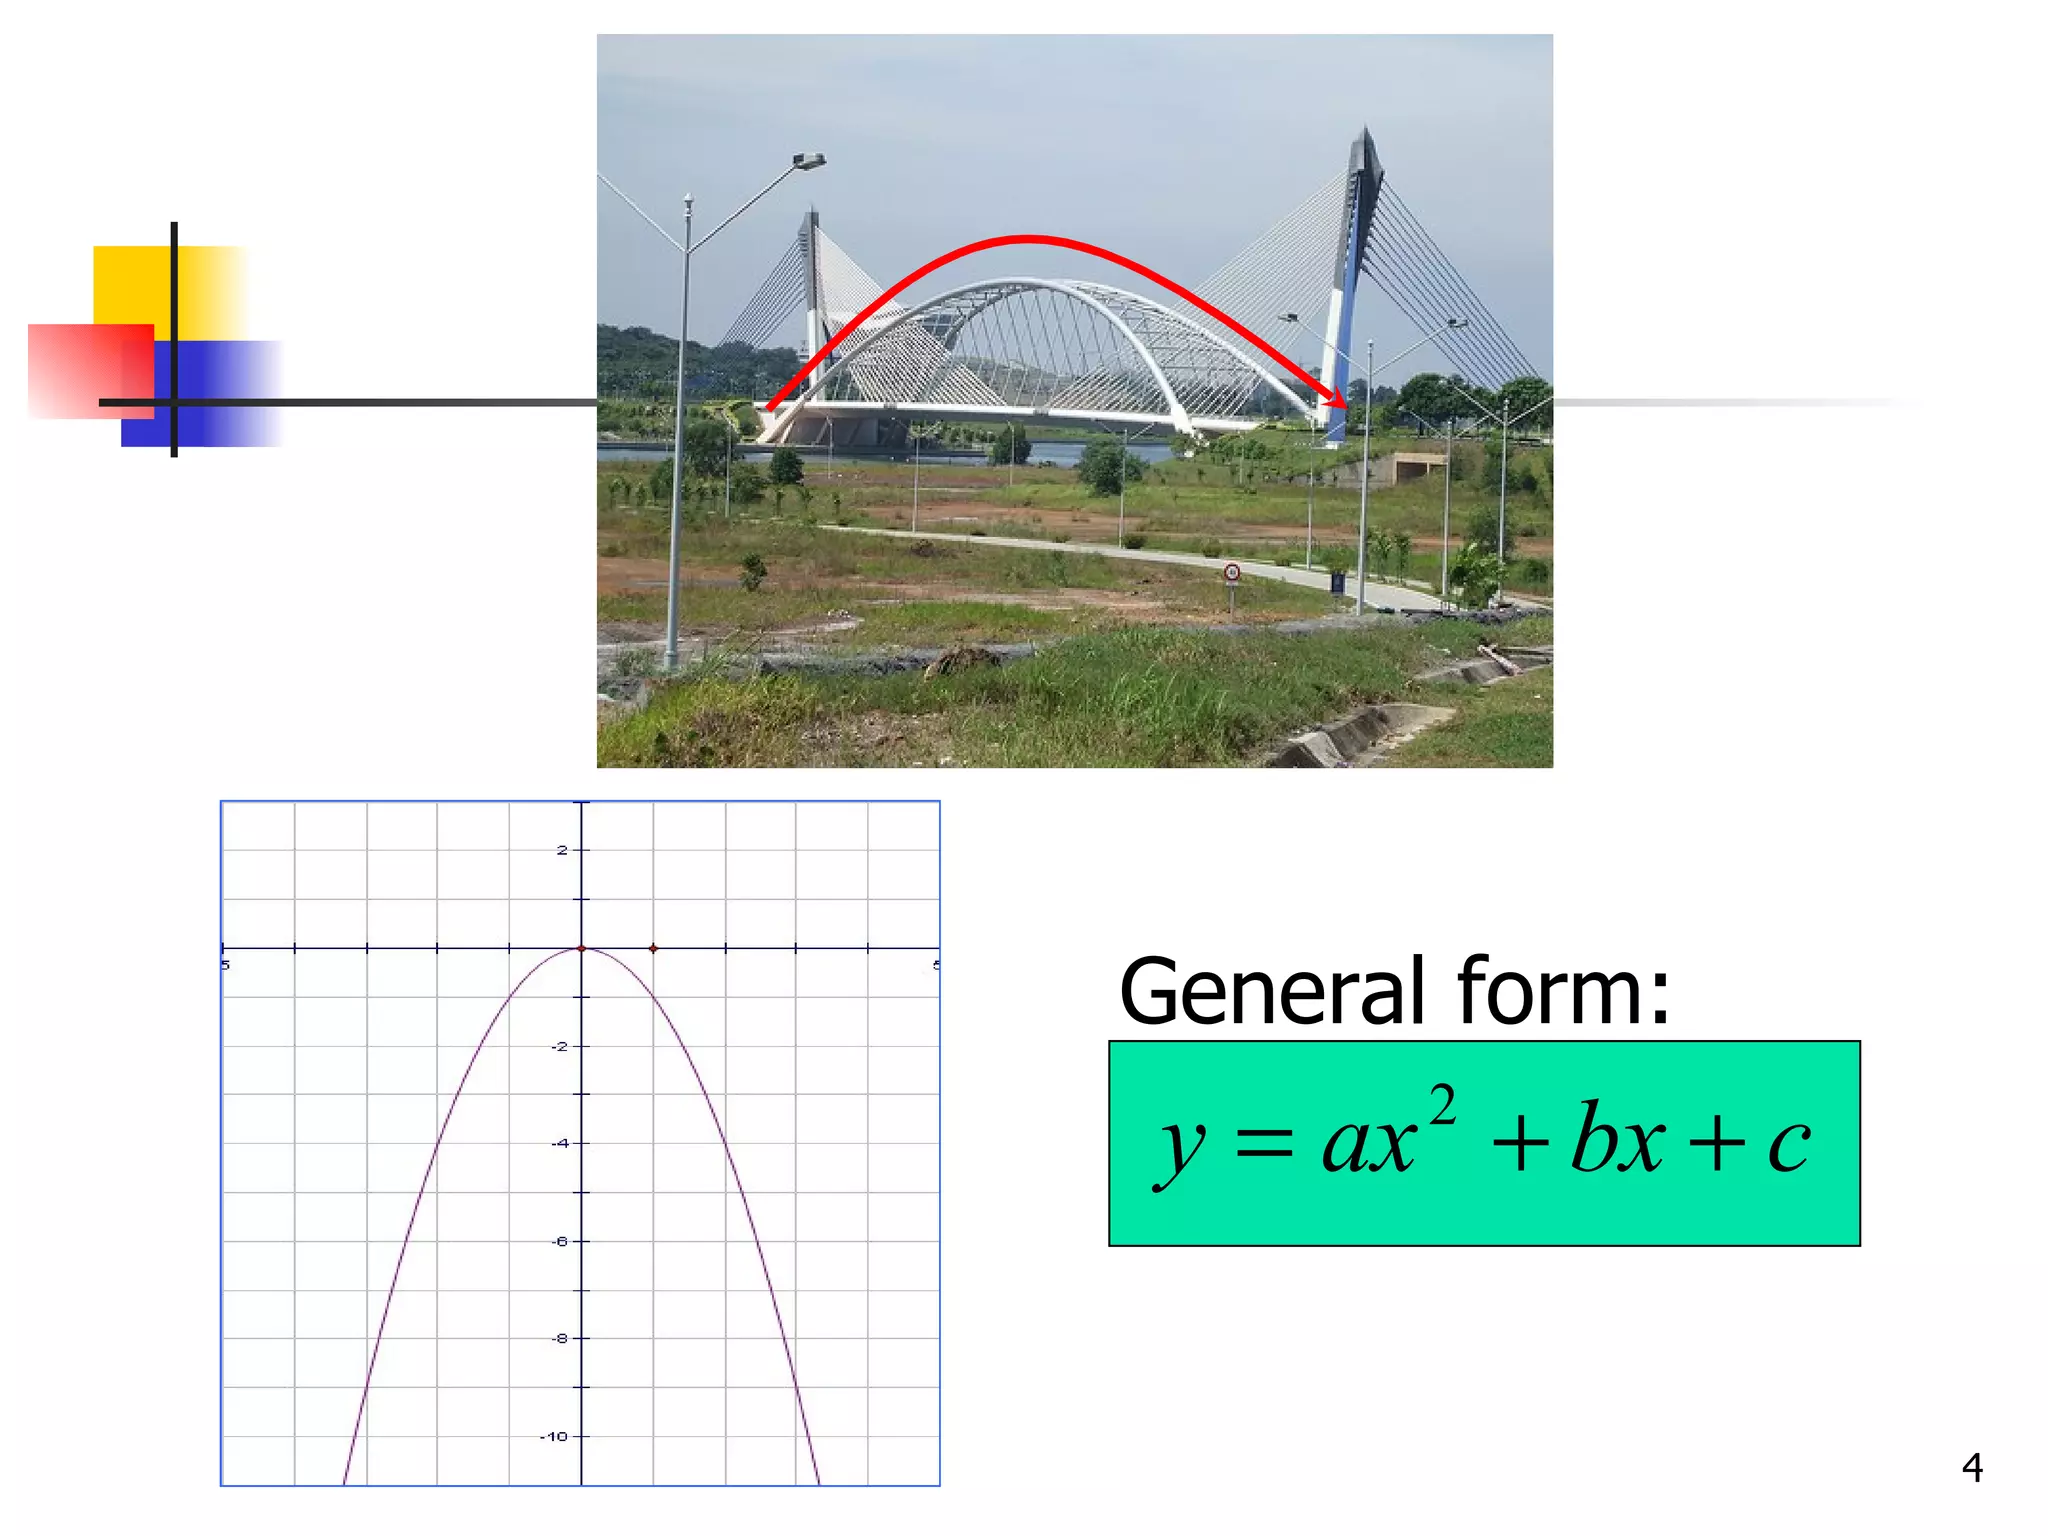
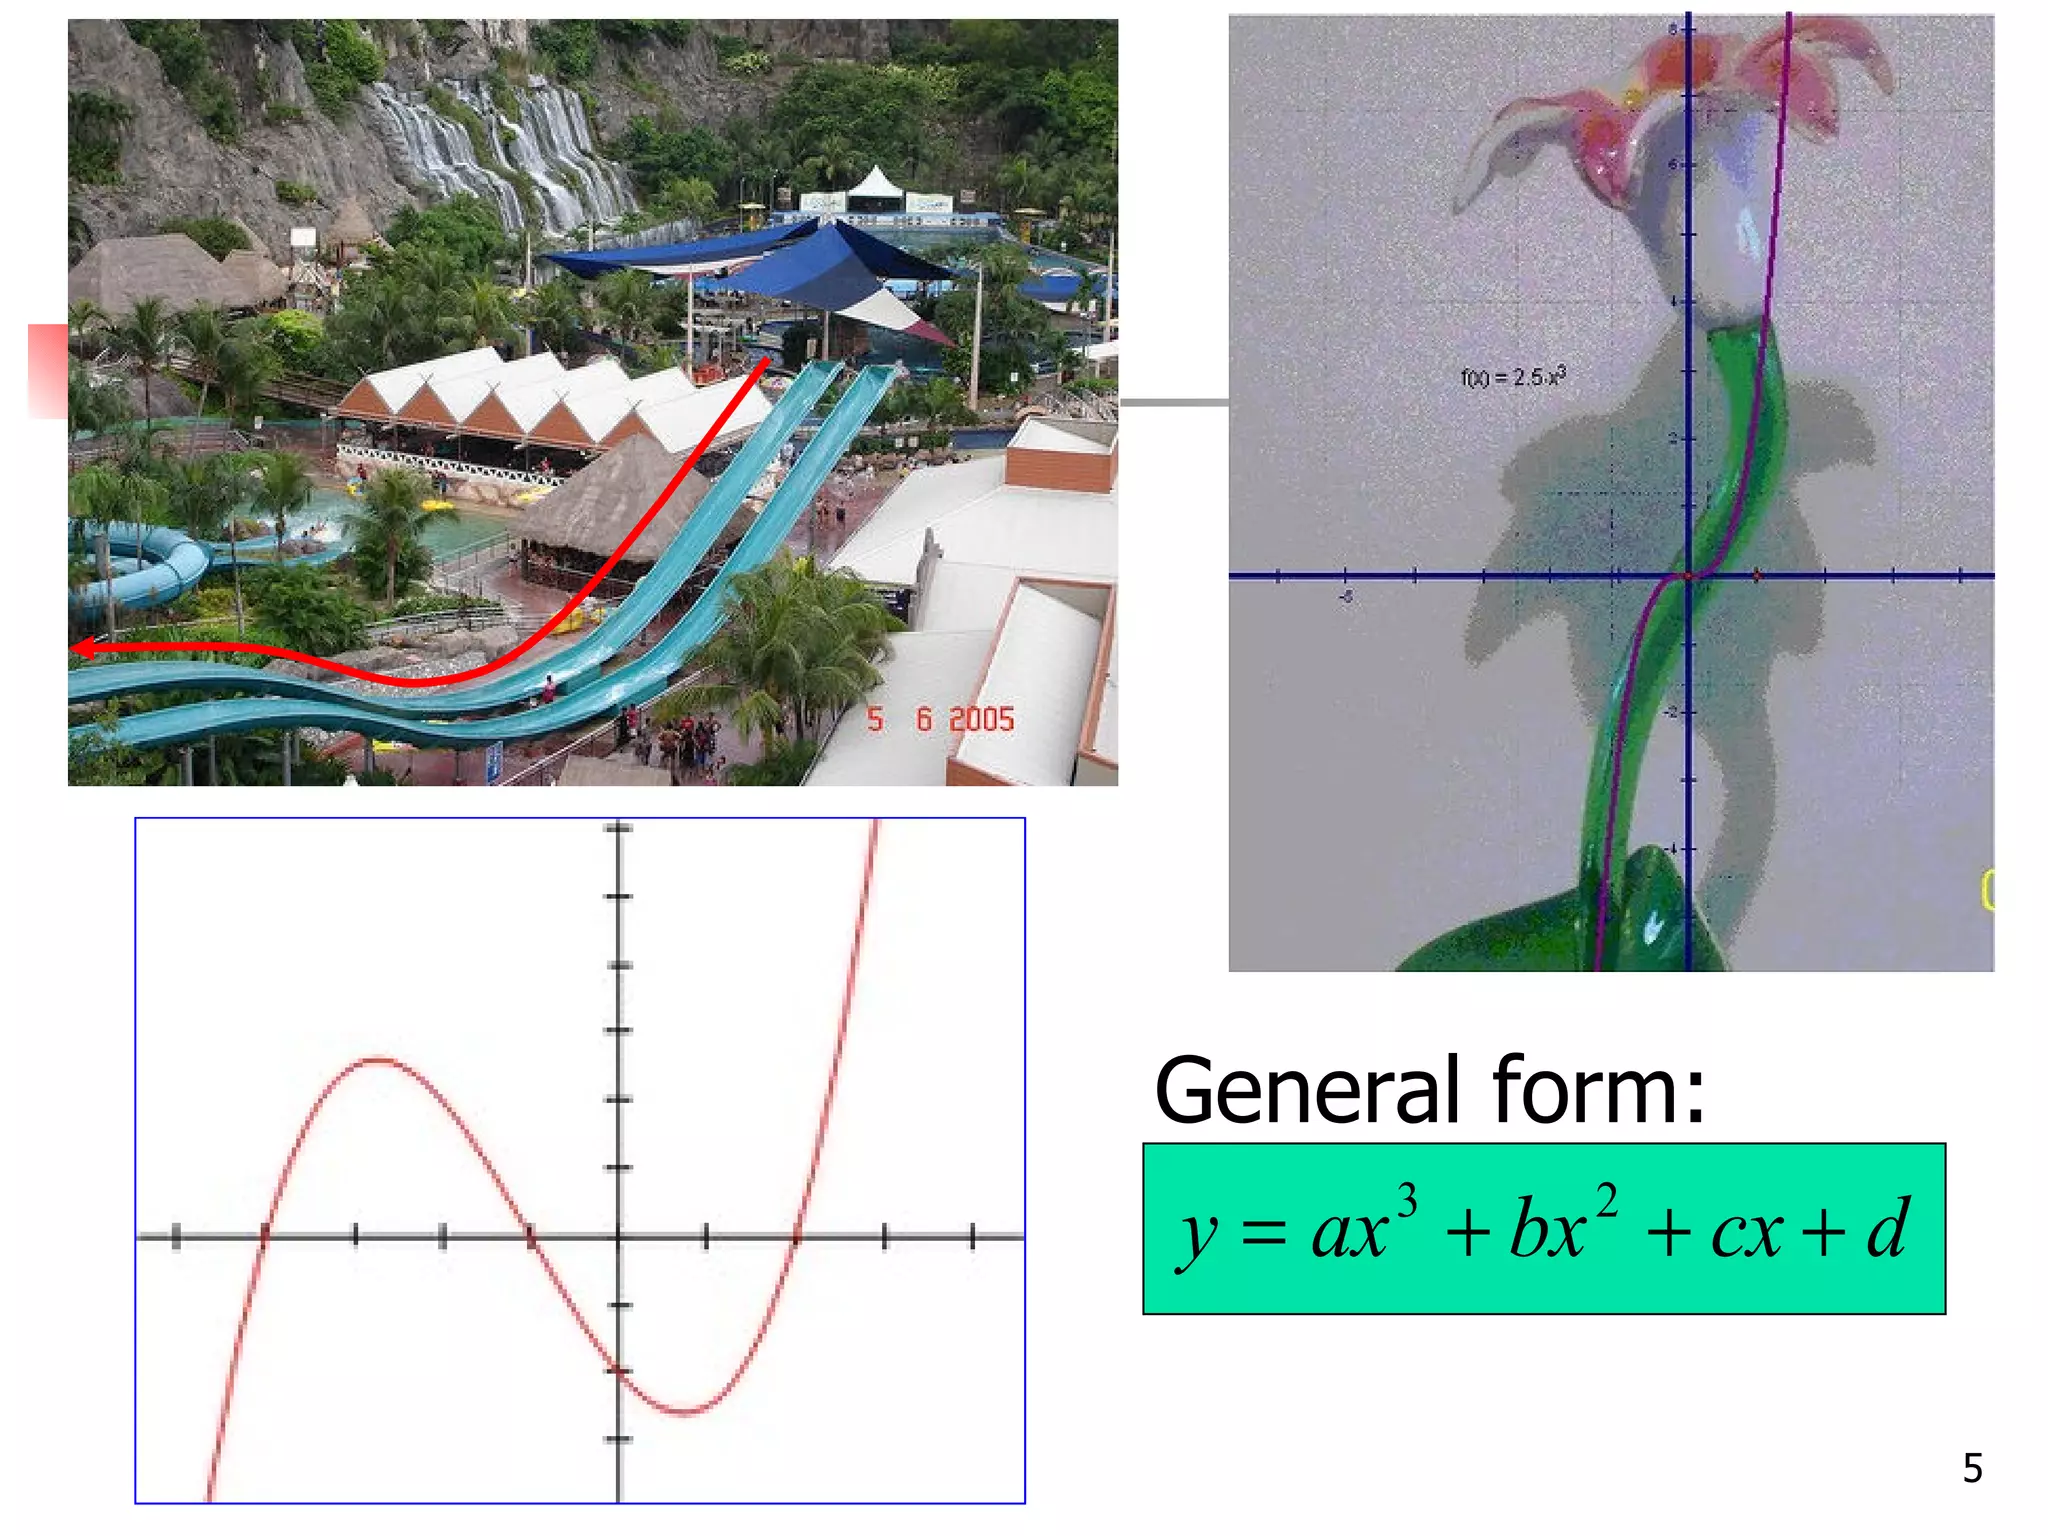
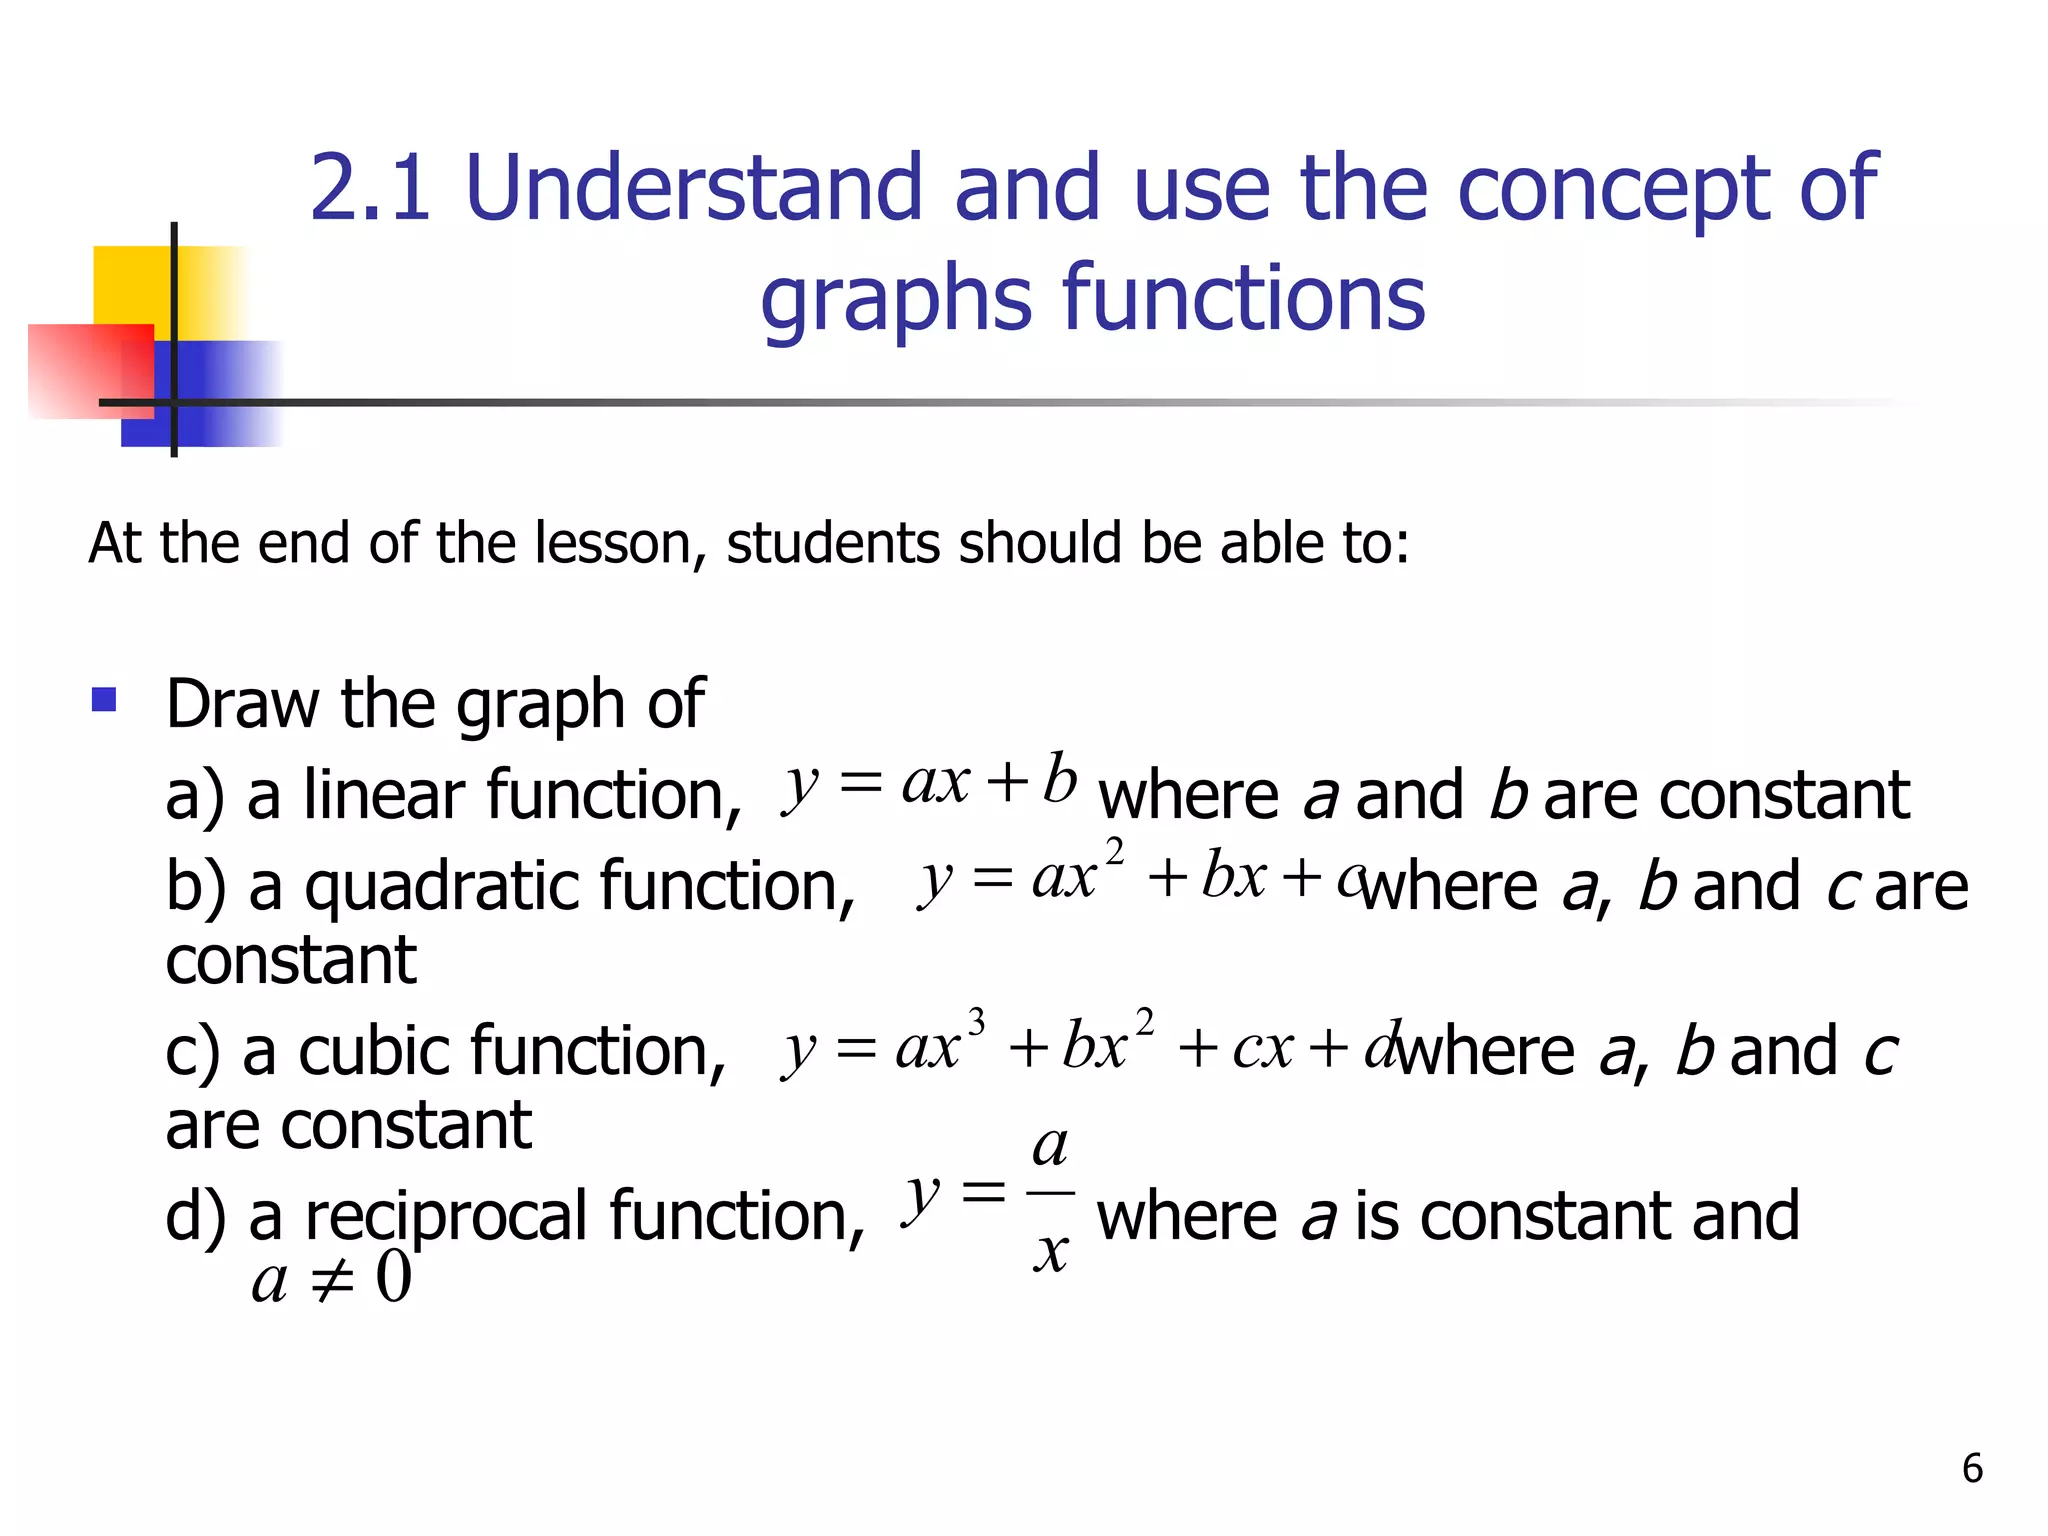
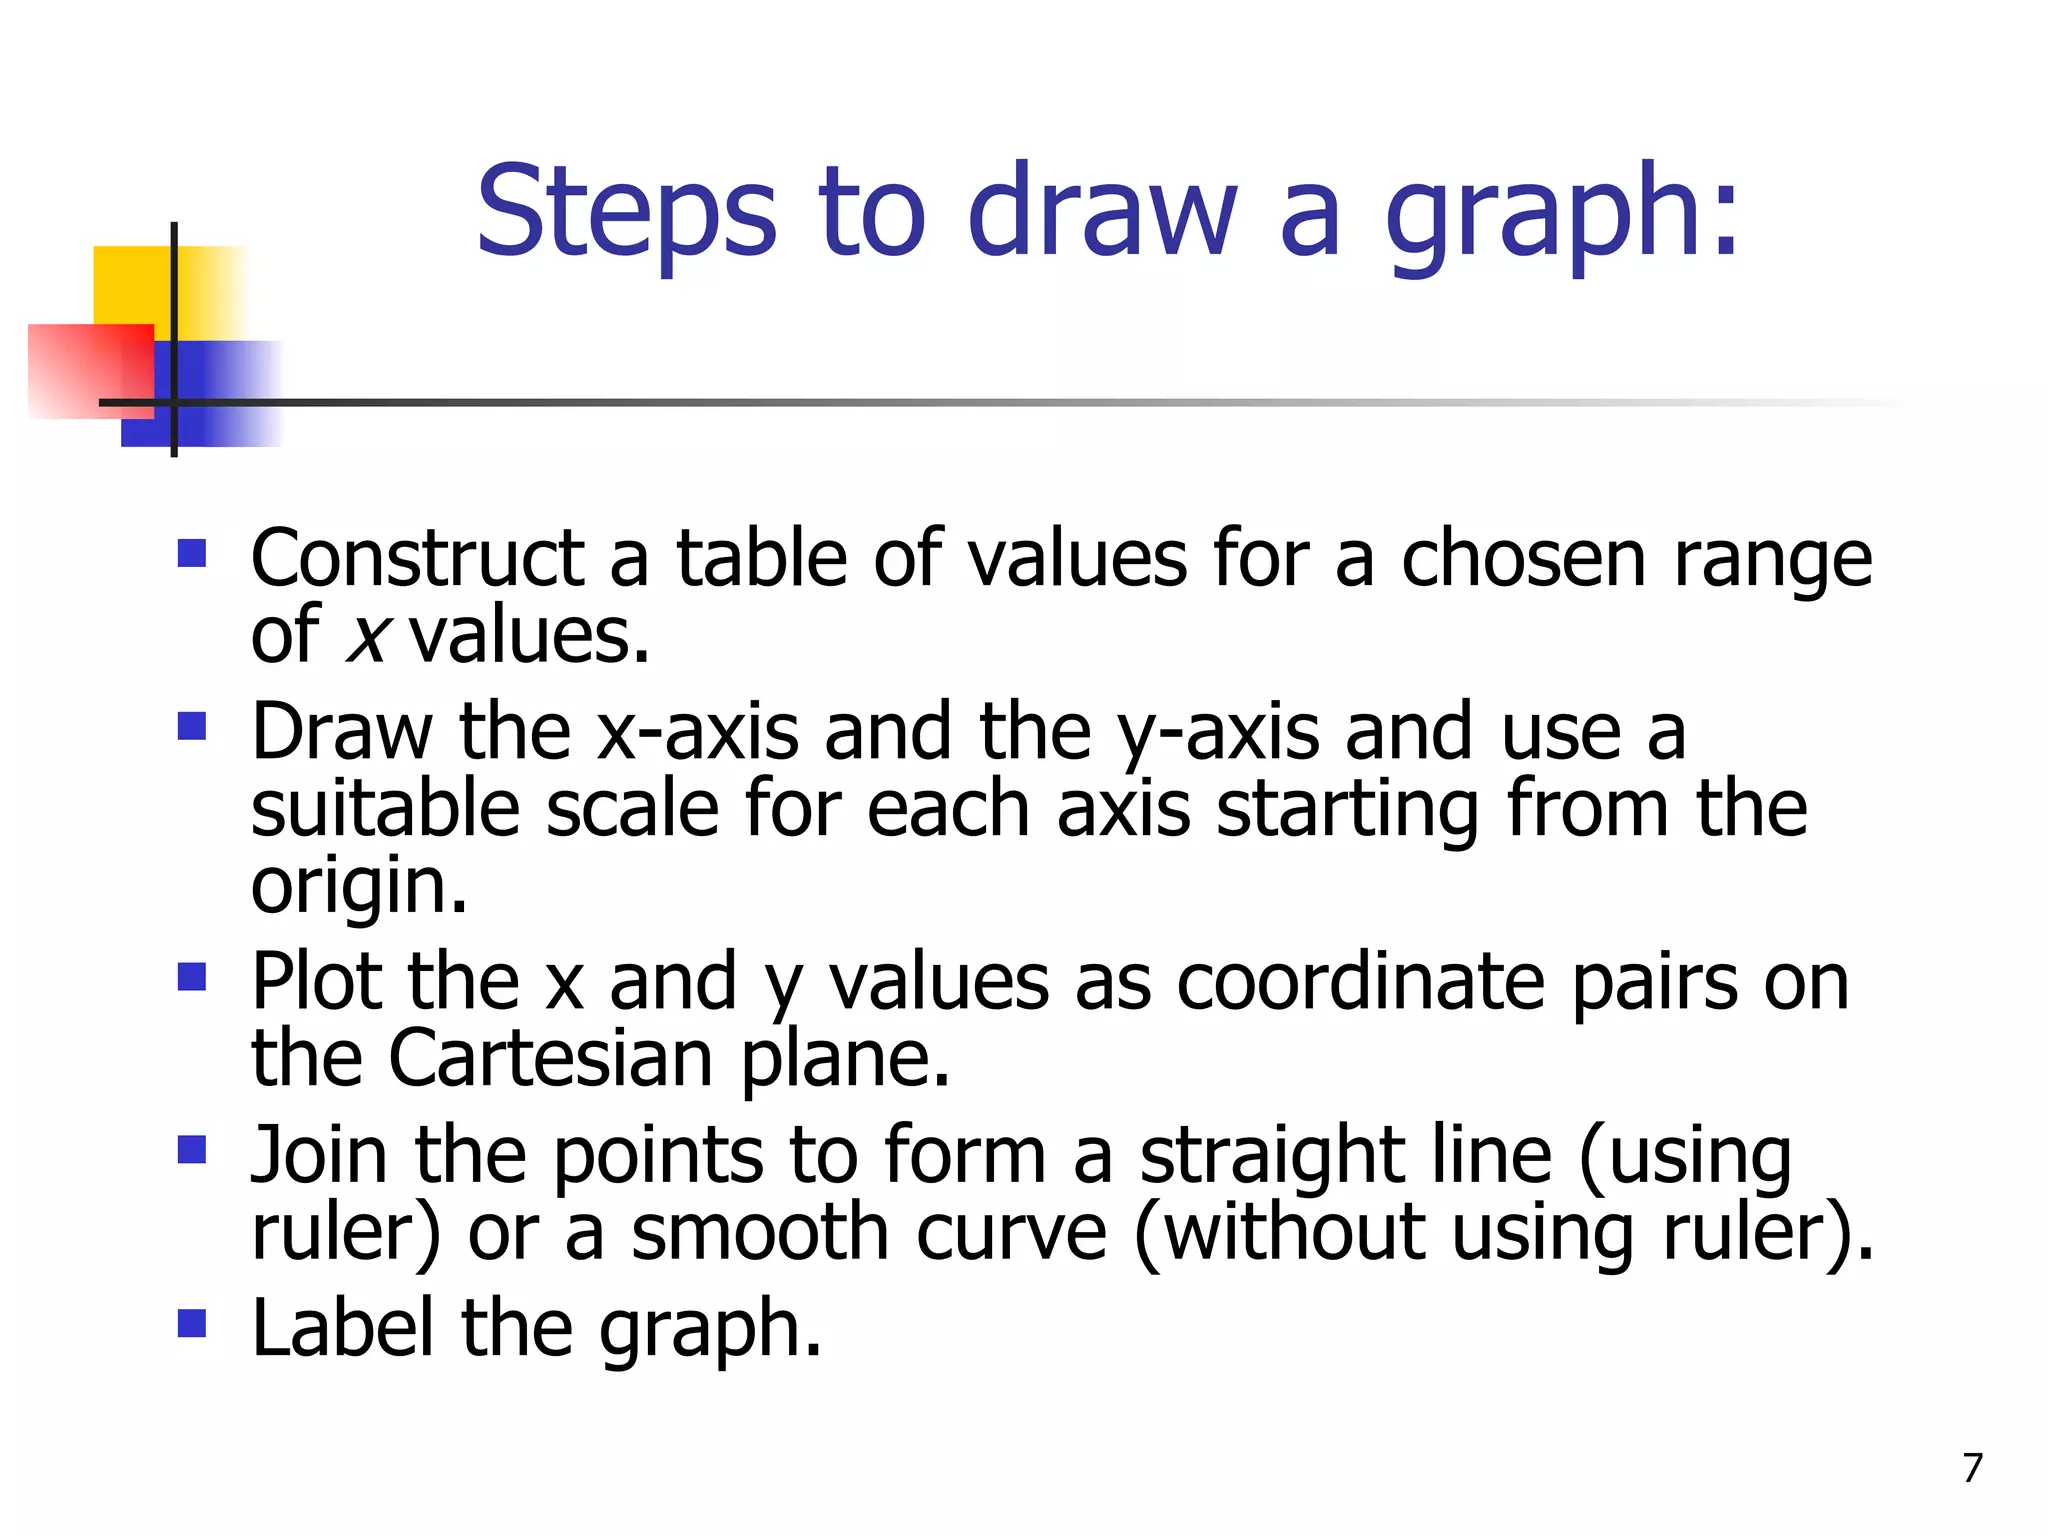
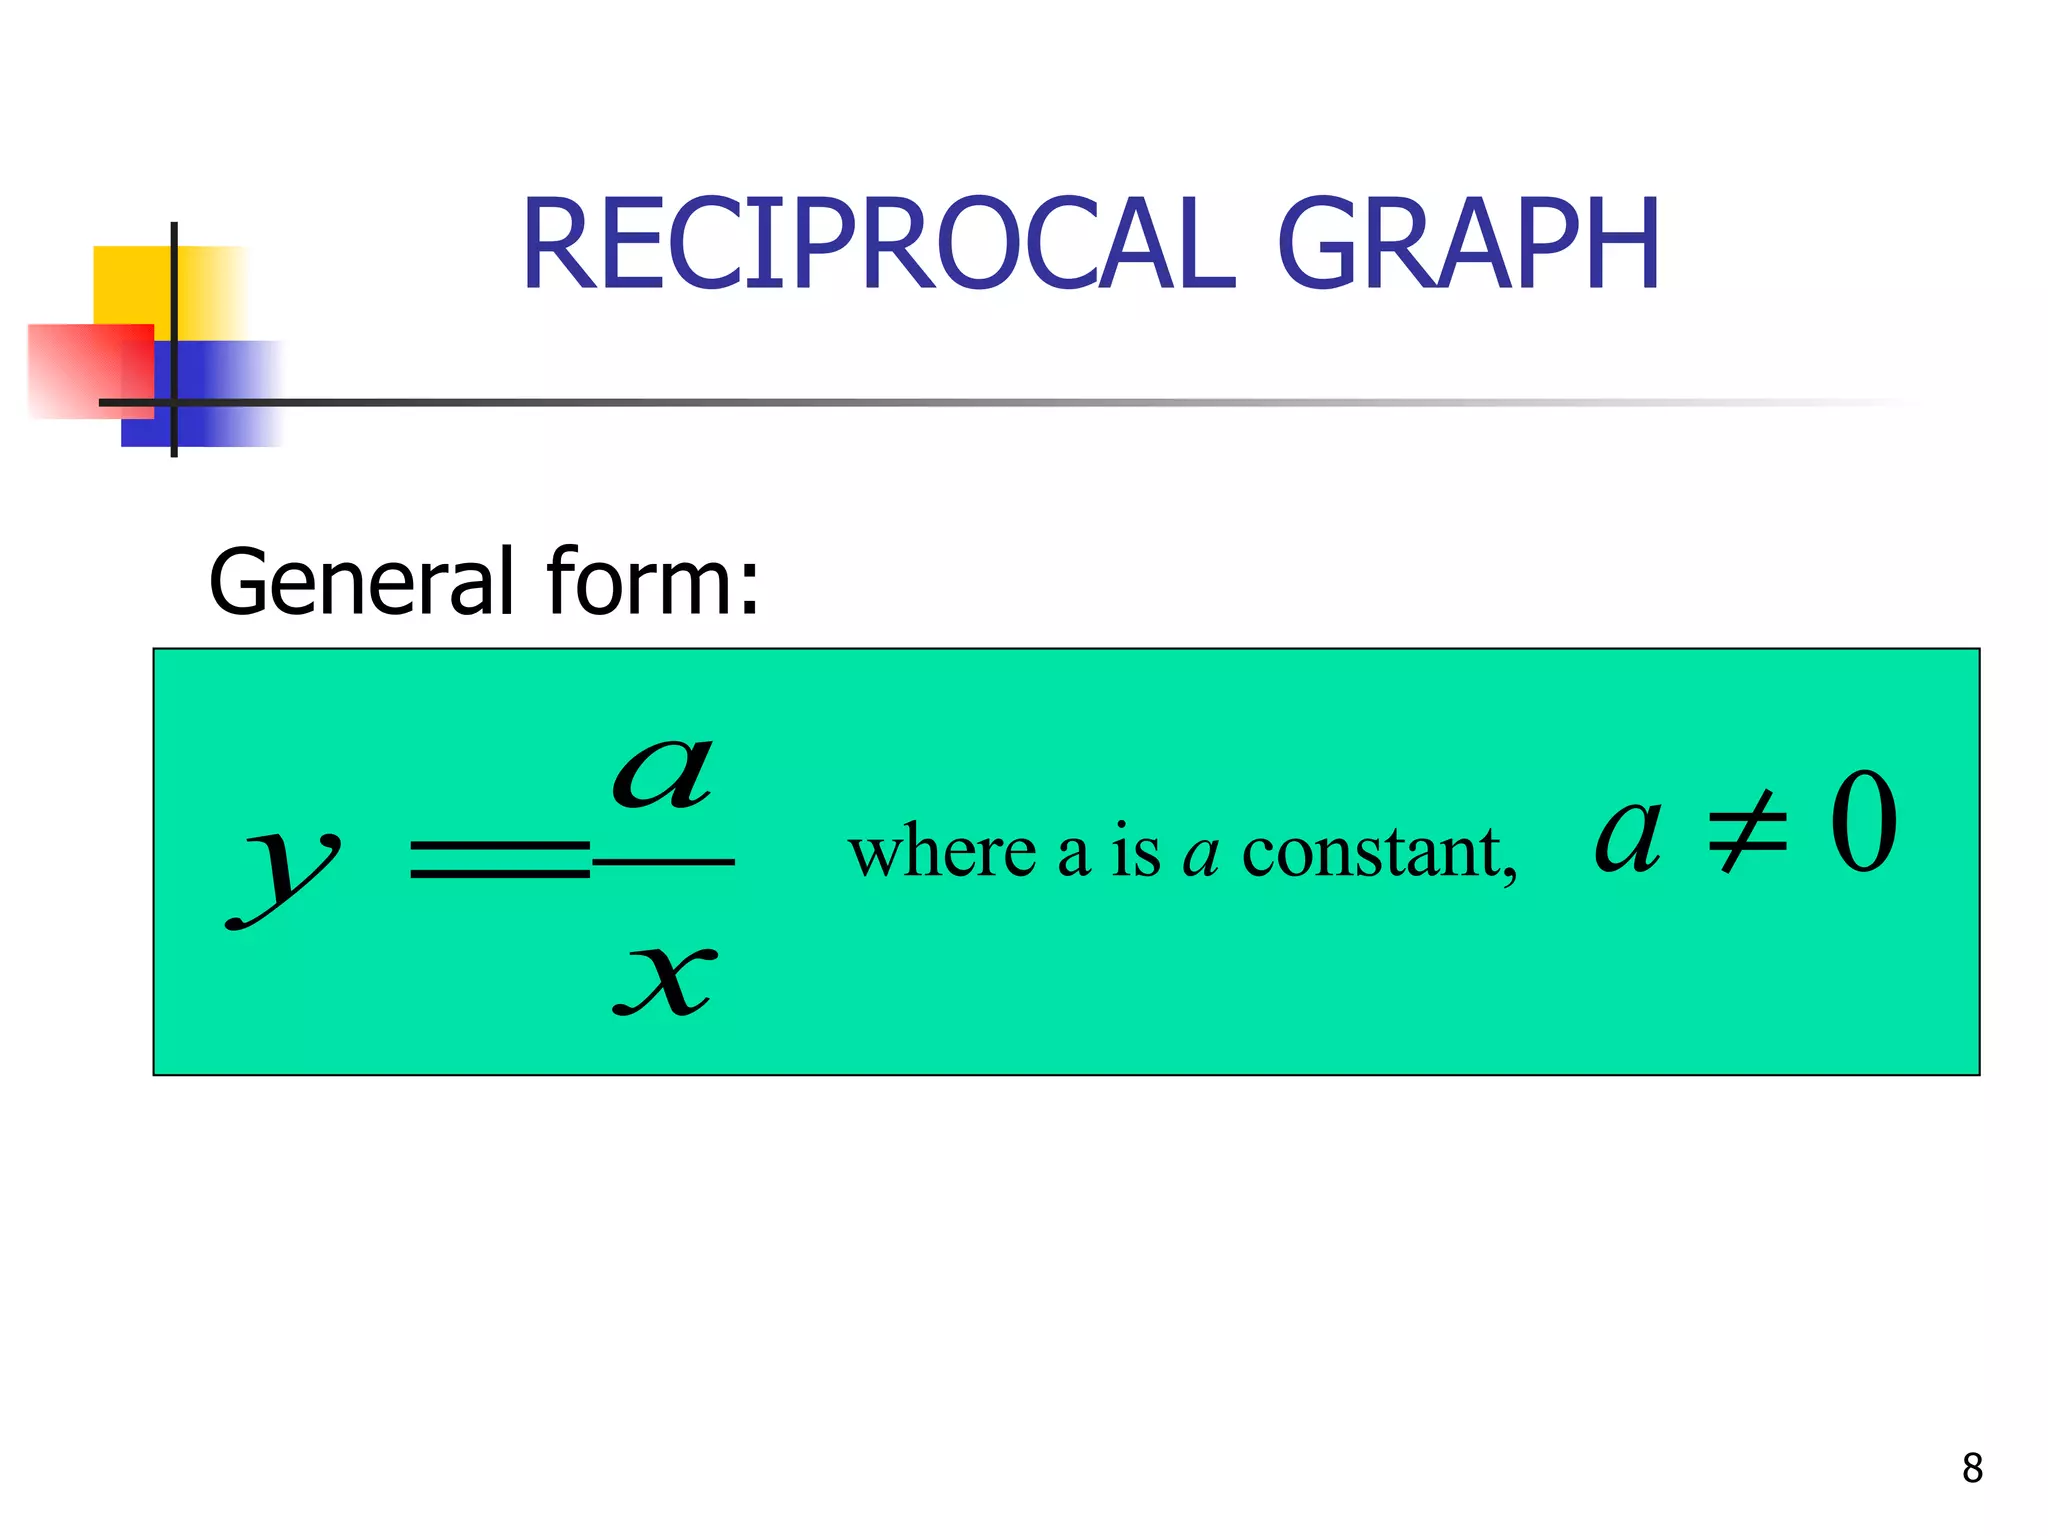
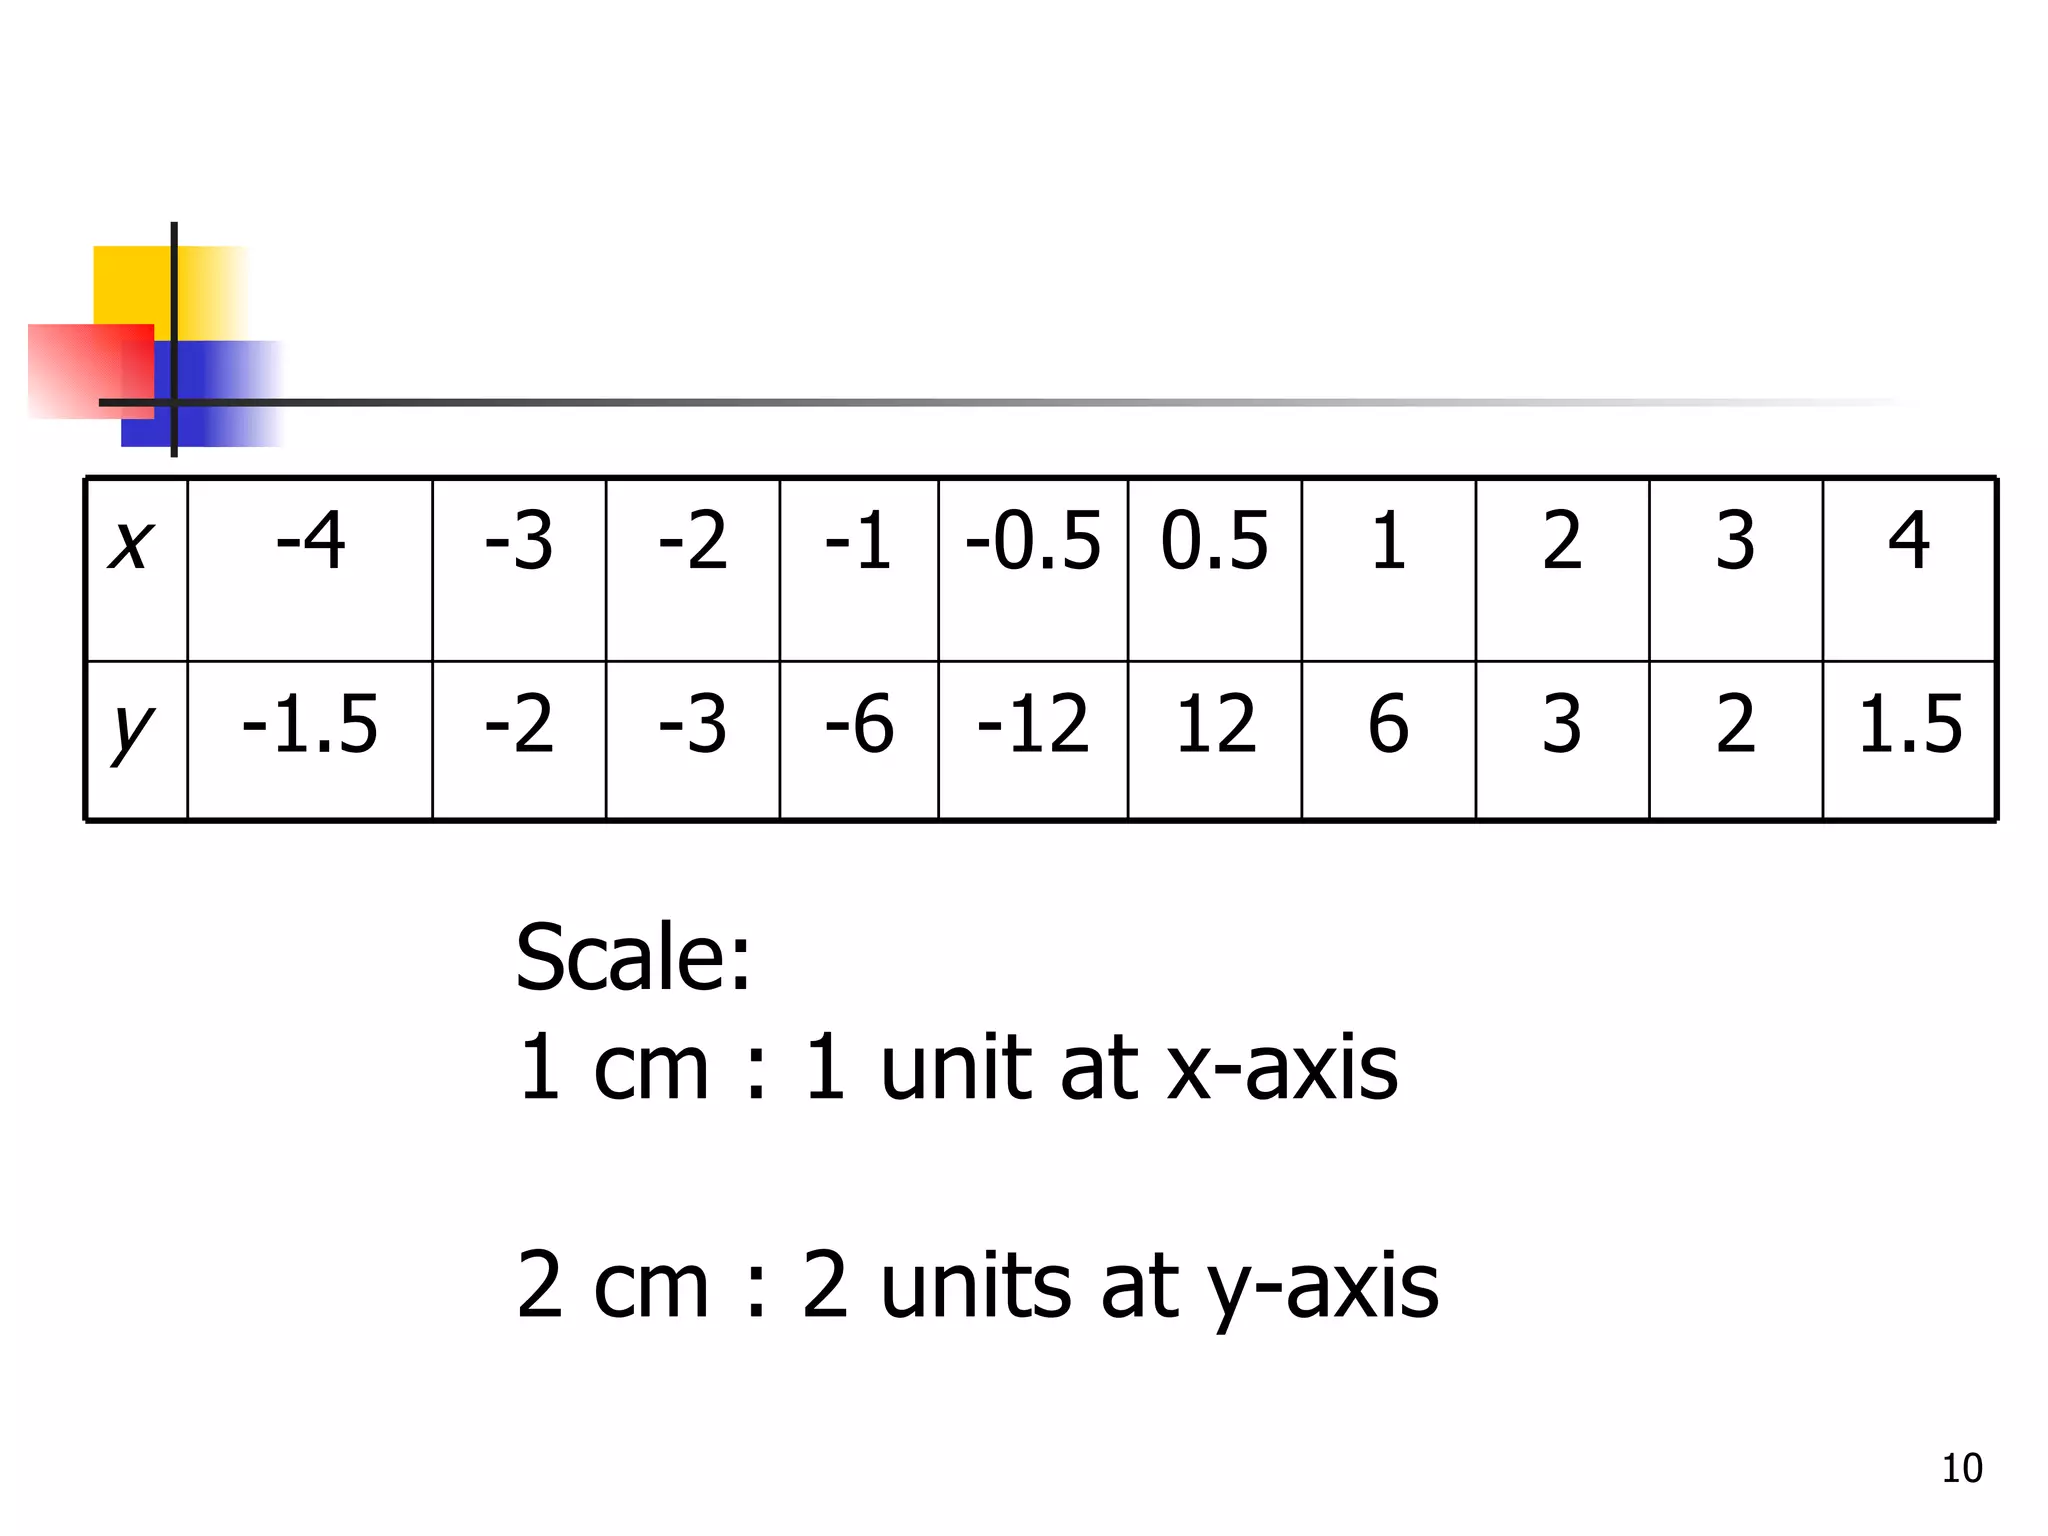
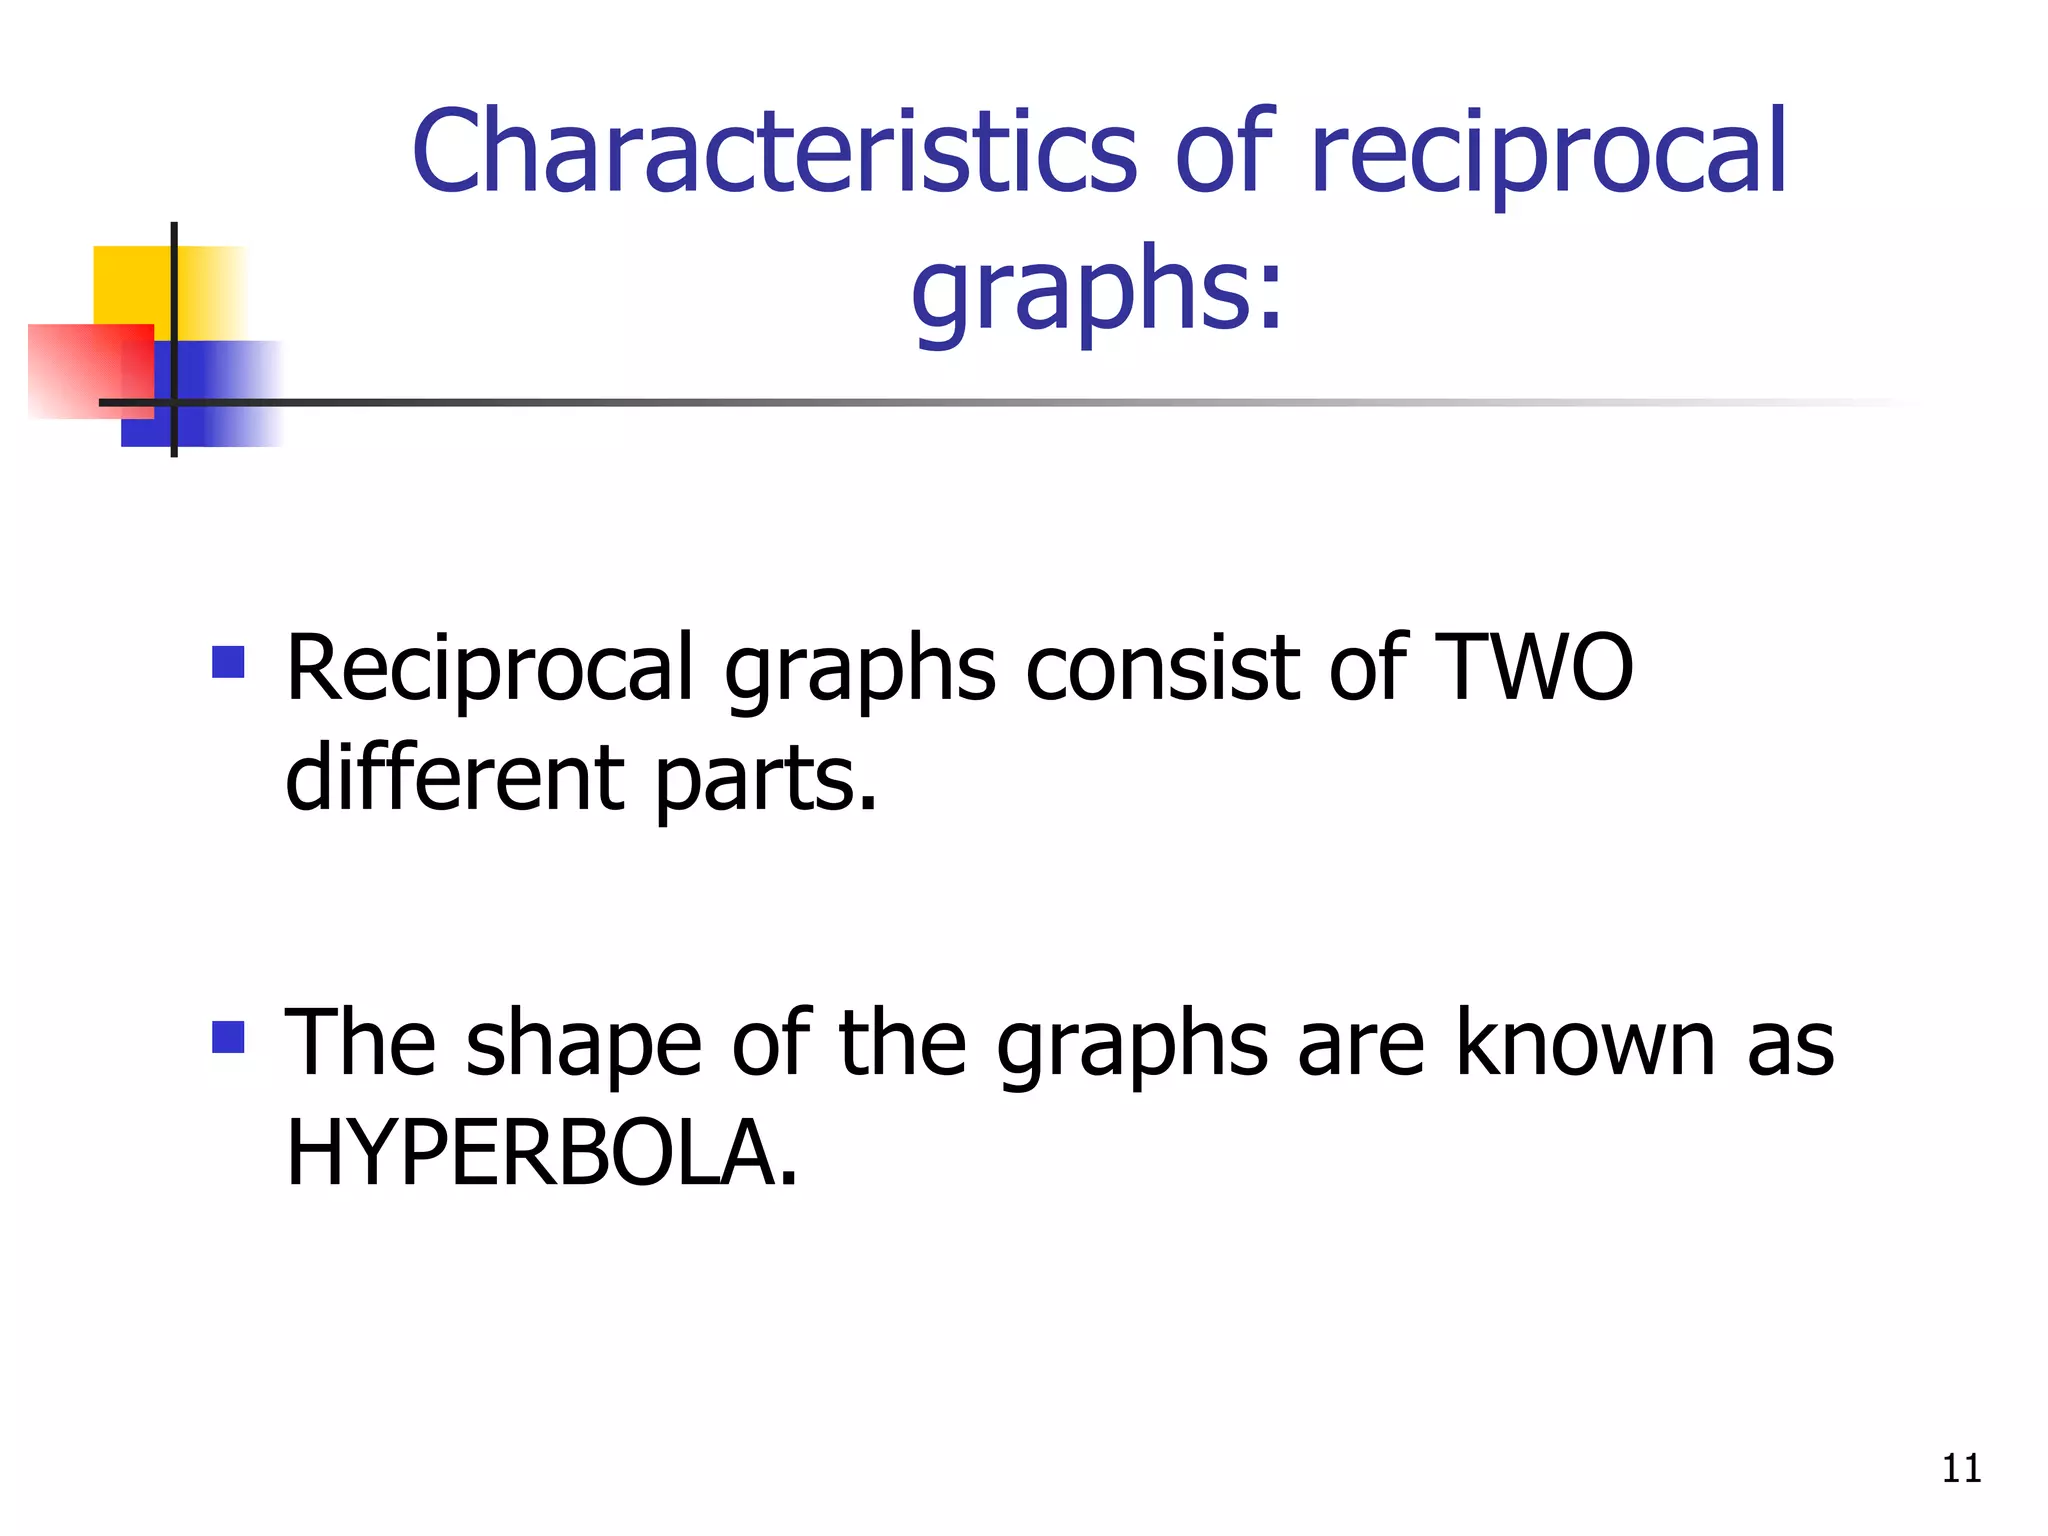
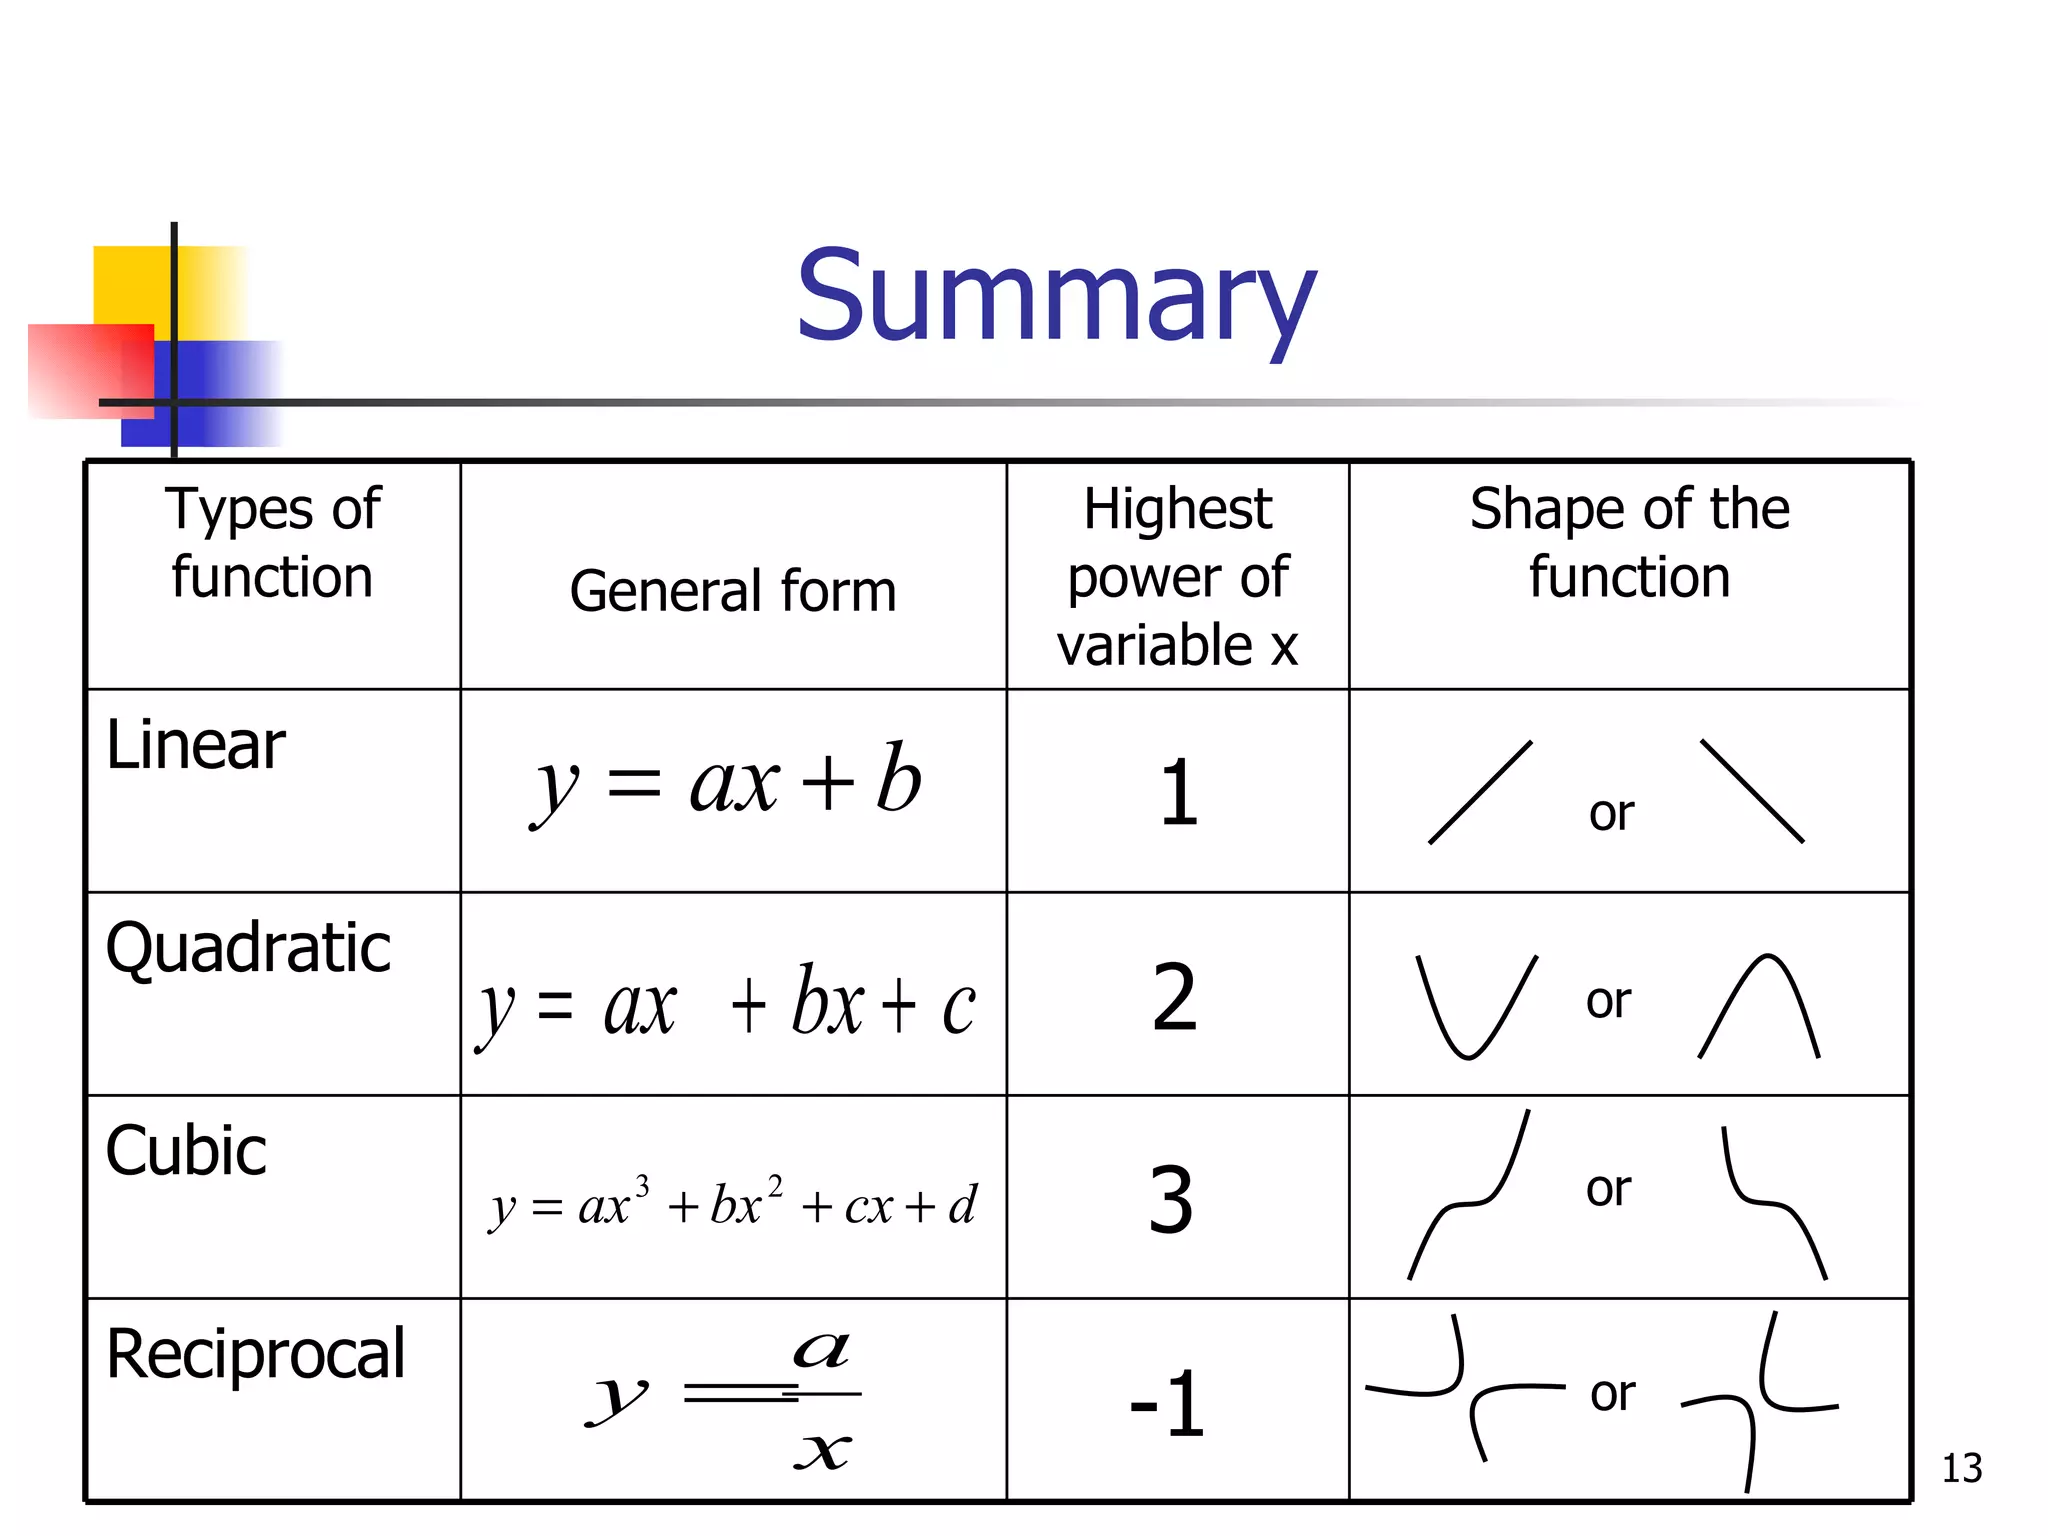

The document discusses drawing graphs of different types of functions, including linear, quadratic, cubic, and reciprocal functions. It provides the general forms of each type of function, describes the steps to draw their graphs which include constructing a table of values, plotting points, and joining the points. As an example, it shows the graph of a reciprocal function f(x) = 1/x for -1 ≤ x ≤ 1.5, which forms a hyperbola shape.