Download to read offline


![By-KSHITIJ RB SINGH
It is the study of the interaction between matter and electromagnetic radiation. Historically,
spectroscopy originated through the study of visible light dispersed according to its wavelength, by a
prism. Later the concept was expanded greatly to include any interaction with radiative energy as a
function of its wavelength or frequency. Spectroscopic data is often represented by a spectrum, a
plot of the response of interest as a function of wavelength or frequency.
COLORIMETRY:
It is Measure of amount of light absorbed by the color developed in a sample. It is related to:
(1) The Chemistry involved.
(2) The Length of light traveled [Lamberts Law].
(3) The Amount (concentration) of absorbing material [Beer’s Law].
The Combined Lamberts Law and Beer’s Law is
T=10-abc
Where, a=constant for particular solution, b=Length of absorbing layer, c=Concentration of absorbing
Substance. And (-) sign indicates an Inversion relation.
UV-VISIBLE:
Ultraviolet–visible spectroscopy or ultraviolet-visible spectrophotometry (UV-Vis or UV/Vis) refers to
absorption spectroscopy or reflectance spectroscopy in the ultraviolet-visible spectral region. This
means it uses light in the visible and adjacent (near-UV and near-infrared [NIR]) ranges. The
absorption or reflectance in the visible range directly affects the perceived color of the chemicals
involved. In this region of the electromagnetic spectrum, molecules undergo electronic transitions.
This technique is complementary to fluorescence spectroscopy, in that fluorescence deals with
transitions from the excited state to the ground state, while absorption measures transitions from](https://image.slidesharecdn.com/applicationofbiochemicaltoolsandtechniques-230806185201-5ed22f09/85/Application-Of-Biochemical-Tools-And-Techniques-7-320.jpg)

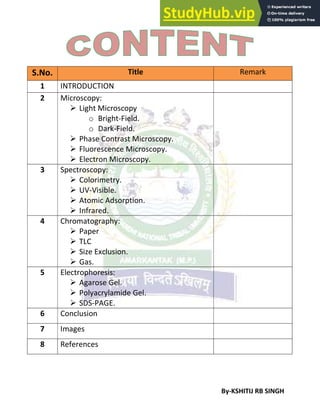
This document discusses various biochemical tools and techniques used in analysis. It describes several types of microscopy like light microscopy, fluorescence microscopy and electron microscopy. It also explains various spectroscopy techniques such as colorimetry, UV-visible spectroscopy and infrared spectroscopy. Additionally, it covers different types of chromatography and electrophoresis techniques used in biochemistry like paper chromatography, gel electrophoresis and SDS-PAGE.