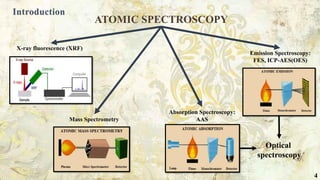
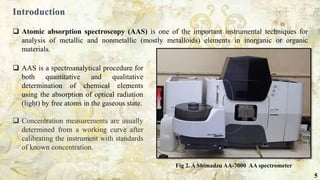
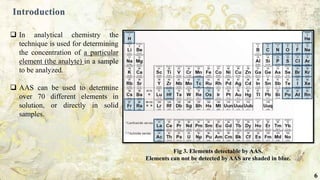
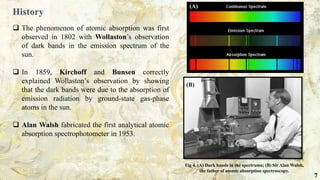
2
 Spectroscopy is the study of interactions
between matter and different forms of
electromagnetic radiation; when practiced to
quantitative analysis, the term spectrometry is
used.
 Atomic spectroscopy includes a number of
analytical techniques used to determine the
elemental composition of a sample (it can be
gas, liquid, or solid) by observing its
electromagnetic spectrum or its mass
spectrum.
 Element concentrations of a millionth (ppm)
or one billionth part (ppb) of the sample can
be detected.
Introduction
Fig 1. How does a spectrometer work?
3
ATOMIC SPECTROSCOPY
Mass Spectrometry
Absorption Spectroscopy:
AAS
Emission Spectroscopy:
FES, ICP-AES(OES)
X-ray fluorescence (XRF)
Introduction
Optical
spectroscopy
4
 Atomic absorption spectroscopy (AAS) is one of the important instrumental techniques for
analysis of metallic and nonmetallic (mostly metalloids) elements in inorganic or organic
materials.
Introduction
Fig 2. A Shimadzu AA-7000 AA spectrometer
 AAS is a spectroanalytical procedure for
both quantitative and qualitative
determination of chemical elements
using the absorption of optical radiation
(light) by free atoms in the gaseous state.
 Concentration measurements are usually
determined from a working curve after
calibrating the instrument with standards
of known concentration.
5
 In analytical chemistry the
technique is used for determining
the concentration of a particular
element (the analyte) in a sample
to be analyzed.
 AAS can be used to determine
over 70 different elements in
solution, or directly in solid
samples.
Introduction
Fig 3. Elements detectable by AAS.
Elements can not be detected by AAS are shaded in blue.
6
 The phenomenon of atomic absorption was first
observed in 1802 with Wollaston’s observation
of dark bands in the emission spectrum of the
sun.
 In 1859, Kirchoff and Bunsen correctly
explained Wollaston’s observation by showing
that the dark bands were due to the absorption of
emission radiation by ground-state gas-phase
atoms in the sun.
 Alan Walsh fabricated the first analytical atomic
absorption spectrophotometer in 1953.
History
Fig 4. (A) Dark bands in the spectrums; (B) Sir Alan Walsh,
the father of atomic absorption spectroscopy.
(B)
(A)
7
 AAS utilises the principle that elements in the gas phase absorb light at very specific
wavelengths which gives the technique excellent specificity and detection limits.
 The sample may be an aqueous or organic solution, indeed it may even be solid provided
it can be dissolved successfully.
 The liquid is drawn in to a flame where it is ionised in the gas phase.
 Light of a specific wavelength appropriate to the element being analysed is shone
through the flame, the absorption is proportional to the concentration of the element.
 Quantification is achieved by preparing standards of the element.
Principle
8
Principle
 The technique makes use of the atomic absorption spectrum of a sample in order to
assess the concentration of specific analytes within it.
 It requires standards with known analyte content to establish the relation between the
measured absorbance and the analyte concentration and relies therefore on the
Beer-Lambert law.
 The Beer-Lambert law is the linear relationship between absorbance and concentration of
an absorbing species.
9
Principle
Beer–Lambert Law
A is the measure of Absorbance
I is the intensity of light coming out of the flow cell
I0 is the intensity of light going into the flow cell
α is the specific absorption of the material (in L mol−1 cm−1)
c is the concentration of material (in mol L−1)
l is the length of the flow cell (in cm)
Fig 5. Beer–Lambert Law
Fig 6. Graphical representation of the
concentration versus absorption, showing The
linear relationship of the Beer–Lambert law
Absorbance
Concentration
10
Principle
The selection of a preparation method is dependent upon:
 the analyte(s)
 the analyte concentration level(s)
 the sample matrix
 the instrumental measurement technique
 the required sample size
 instrument operation conditions
 cost
 Environmental considerations
11
Principle
Sample Preparation
 Dilution – sample is diluted in distilled water, acids or organic solvent.
 Decomposition – isolation of required element from the sample by heating:
 Wet/acid decomposition (300C).
 Dry ashing (400-500C).
 Microwave decomposition (100-200C).
 Reading the absorption of standard solutions.
 A series of standard solutions should be prepared.
 Calibration curve must be prepared for the Blank(s) and standard solution(s) must be
prepared using different concentrations of the sample.
 Measuring the absorbance of the unknown sample.
12
Principle
Working
Fig 7. Operation principle of AAS
13
Instrumentation
Source of light
Nebulizer
Atomizer
Monochromator
Detectors
Readout Devices
14
Instrumentation
Source of light
Hollow Cathode Lamp (HCL)
Electrodeless Discharge Lamps
15
Instrumentation
Source of light
Hollow Cathode Lamp (HCL)
 HCL is the most common radiation source in AAS.
 It contains a tungsten anode and a hollow cylindrical cathode made of the element to be
determined.
 These are sealed in a glass tube filled with an inert gas (neon, argon).
 Each element has its own unique lamp which must be used for that analysis.
16
Instrumentation
Source of light
 Hollow Cathode Lamp (HCL)
Fig 8. Hollow Cathode Lamp (HCL) and its construction
17
Instrumentation
Source of light
 Electrodeless Discharge Lamps
 A small amount of the metal or salt of the element for which the source is to be used is sealed inside a
quartz bulb.
 This bulb is placed inside a small, self-contained RF generator or “driver”. When power is applied to the
driver, an RF field is created.
 The coupled energy will vaporize and excite the atom inside the bulb causing them to emit their
characteristic spectrum.
 They are typically much more intense and, in some cases, more sensitive than comparable HCL. Hence
better precision and lower detection limits where an analysis is intensity limited.
 EDLs are available for a wide variety of elements.
18
Instrumentation
Source of light
 Electrodeless Discharge Lamps
Fig 9. Electrodeless Discharge Lamps and its construction
19
Instrumentation
Nebuliser
 The nebuliser forms a mist or aerosol of the sample.
 This is done by forcing the sample at high velocities through a narrow tube.
 The sample is mixed with a fuel and oxidant.
 Commonly used fuel-oxidant mixtures are acetylene-air and acetylene-nitrous oxide.
20
Instrumentation
Nebuliser
Table 1. Fuel and oxidant used for flame combustion.
21
Instrumentation
Nebuliser
Fig 10. Construction of Nebuliser
22
Instrumentation
Atomiser
 Flame atomizers Atomic Absorption Spectroscopy (FAAS)
 Electro-thermal atomizers (or graphite furnace) Atomic Absorption Spectroscopy (ET-AAS)
 Zeeman Graphite Furnace Atomic Absorption Spectroscopy (ZGF-AAS)
 Hydride Generation Atomic Absorption Spectroscopy (HG-AAS)
 Cold Vapor Atomic Absorption Spectroscopy (CV-AAS)
 Atomization is separation of particles into individual molecules and breaking molecules
into atoms. This is done by exposing the analyte to high temperatures in a flame or
graphite furnace. In the atomiser the sample solutions is vaporised and the molecules are
atomized.
Atomiser can be of two types:
23
Instrumentation
Atomiser
 Flame atomizers
 Flame is used to atomize the sample.
 Sample when heated is broken into its atoms.
 High temperature of flame causes excitation.
 Electrons of the atomized sample are promoted to higher orbitals, by absorbing certain
amount of energy.
24
Instrumentation
Atomiser
 Flame atomizers
Sample Nebulizer assembly
Conversion into fine
mist or small droplets of
solution
Aspirated into spray
chamber (mixing
chamber)
Aerosol mixes with
combustion gases
Flame Atomization
occurs
Fig 11. Flame atomization cycle
25
Instrumentation
Atomiser
 Flame atomizers
Disadvantages of Flame Atomization
 Only 5-15% of the nebulized sample reaches the flame.
 A minimum sample volume of 0.5-1.0 ml is needed to give a reliable reading.
 Samples which are viscous require dilution with a solvent.
26
Instrumentation
Atomiser
 Electro-thermal atomizers or graphite furnace
 Graphite furnace atomic absorption spectrometry (GFAAS) (also known as Electro
thermal Atomic Absorption spectrometry (ETAAS)) is a type of spectrometry that uses a
graphite-coated furnace to vaporize the sample.
 Instead of employing the high temperature of a flame, to bring about the production of
atoms from the sample and it is non-flame methods involving electrically heated graphite
tubes or rods.
27
Instrumentation
Atomiser
 Electro-thermal atomizers or graphite furnace
Fig 12. A graphite furnace electrothermal atomizer 28
Instrumentation
Atomiser
 Graphite furnace
Disadvantages of
Graphite Furnace
Advantages of
Graphite Furnace
Small sample size
Very little or no sample
preparation is needed
Sensitivity is enhanced
Direct analysis of solid
samples
Analyte may be lost at
the ashing stage
The sample may not be
completely atomized
The precision is poor
than flame method
Analytical range is
relatively low
29
Instrumentation
Monochromator
 This is a very important part in an AA
spectrometer. It is used to separate out all of
the thousands of lines.
 A monochromator is used to select the specific
wavelength of light which is absorbed by the
sample, and to exclude other wavelengths.
 The selection of the specific light allows the
determination of the selected element in the
presence of others.
Fig 13. Monochromator internal construction
30
Instrumentation
Detector
 The light selected by the monochromator is directed onto a detector that is typically a
photomultiplier tube, whose function is to convert the light signal into an electrical signal
proportional to the light intensity.
 The processing of electrical signal is fulfilled by a signal amplifier. The signal could be
displayed for readout, or further fed into a data station for printout by the requested
format.
31
Instrumentation
Detector
Fig 14. Photomultiplier tube and its construction
32
Instrumentation
Readout Devices
Fig 15. Readout devices
33
Interferences
Fig 16. Interferences and control measures
34
Applications
Environmental science
Food technology
Pharmaceuticals
Petrochemicals
Geochemical/Mining
Bio-monitoring
Agriculture
Nanomaterials
Pathology
35
Advantage and Disadvantages
Advantages Disadvantages
36
References
A. Walsh (1955), The application of atomic absorption spectra to chemical analysis, Spectrochim. Acta 7: 108–117.
Analytical Methods for Atomic Absorption Spectroscopy – Perkin-Elmer
Atomic absorption spectrometry – Royal Society of Chemistry
B. Welz, H. Becker-Ross, S. Florek, U. Heitmann (2005), High-resolution Continuum Source AAS, Wiley-VCH, Weinheim, Germany, ISBN 3-527-30736-2.
B. Welz, M. Sperling (1999), Atomic Absorption Spectrometry, Wiley-VCH, Weinheim, Germany, ISBN 3-527-28571-7.
B.V. L’vov (1984), Twenty-five years of furnace atomic absorption spectroscopy, Spectrochim. Acta Part B, 39: 149–157.
B.V. L’vov (2005), Fifty years of atomic absorption spectrometry; J. Anal. Chem., 60: 382–392.
H. Becker-Ross, S. Florek, U. Heitmann, R. Weisse (1996), Influence of the spectral bandwidth of the spectromeer on the sensitivity using continuum source AAS, Fresenius J. Anal.
Chem. 355: 300–303.
H. Massmann (1968), Vergleich von Atomabsorption und Atomfluoreszenz in der Graphitküvette, Spectrochim. Acta Part B, 23: 215–226.
http://www.cee.vt.edu
J.A.C. Broekaert (1998), Analytical Atomic Spectrometry with Flames and Plasmas, 3rd
Edition, Wiley-VCH, Weinheim, Germany.
J.M. Harnly (1986), Multi element atomic absorption with a continuum source, Anal. Chem. 58: 933A-943A.
Ma, G. and Gonzales, G.B. Flame Atomic Absorption Spectrometry.
Manning T.J. and Grow W.P. Inductively Coupled Plasma Atomic Emission Spectrometry. The Chemical Educator, v.1. N 2. 1997.
NMSU web note
Sample Preparation For Flame Atomic Absorption
Skoog, D. Fundamentals of Analytical Chemistry, 2004.
Skoog, Douglas (2007). Principles of Instrumental Analysis (6th ed.). Canada: Thomson Brooks/Cole. ISBN 0-495-01201-7.
Spectroscopy: An Overview - Nabil Ramadan Bader
W. Slavin, D.C. Manning, G.R. Carnrick (1981), The stabilized temperature platform furnace, At. Spectrosc. 2: 137–145.
37
Bahrami presentation- AAS

Bahrami presentation- AAS

  • 2.
  • 3.
     Spectroscopy isthe study of interactions between matter and different forms of electromagnetic radiation; when practiced to quantitative analysis, the term spectrometry is used.  Atomic spectroscopy includes a number of analytical techniques used to determine the elemental composition of a sample (it can be gas, liquid, or solid) by observing its electromagnetic spectrum or its mass spectrum.  Element concentrations of a millionth (ppm) or one billionth part (ppb) of the sample can be detected. Introduction Fig 1. How does a spectrometer work? 3
  • 4.
    ATOMIC SPECTROSCOPY Mass Spectrometry AbsorptionSpectroscopy: AAS Emission Spectroscopy: FES, ICP-AES(OES) X-ray fluorescence (XRF) Introduction Optical spectroscopy 4
  • 5.
     Atomic absorptionspectroscopy (AAS) is one of the important instrumental techniques for analysis of metallic and nonmetallic (mostly metalloids) elements in inorganic or organic materials. Introduction Fig 2. A Shimadzu AA-7000 AA spectrometer  AAS is a spectroanalytical procedure for both quantitative and qualitative determination of chemical elements using the absorption of optical radiation (light) by free atoms in the gaseous state.  Concentration measurements are usually determined from a working curve after calibrating the instrument with standards of known concentration. 5
  • 6.
     In analyticalchemistry the technique is used for determining the concentration of a particular element (the analyte) in a sample to be analyzed.  AAS can be used to determine over 70 different elements in solution, or directly in solid samples. Introduction Fig 3. Elements detectable by AAS. Elements can not be detected by AAS are shaded in blue. 6
  • 7.
     The phenomenonof atomic absorption was first observed in 1802 with Wollaston’s observation of dark bands in the emission spectrum of the sun.  In 1859, Kirchoff and Bunsen correctly explained Wollaston’s observation by showing that the dark bands were due to the absorption of emission radiation by ground-state gas-phase atoms in the sun.  Alan Walsh fabricated the first analytical atomic absorption spectrophotometer in 1953. History Fig 4. (A) Dark bands in the spectrums; (B) Sir Alan Walsh, the father of atomic absorption spectroscopy. (B) (A) 7
  • 8.
     AAS utilisesthe principle that elements in the gas phase absorb light at very specific wavelengths which gives the technique excellent specificity and detection limits.  The sample may be an aqueous or organic solution, indeed it may even be solid provided it can be dissolved successfully.  The liquid is drawn in to a flame where it is ionised in the gas phase.  Light of a specific wavelength appropriate to the element being analysed is shone through the flame, the absorption is proportional to the concentration of the element.  Quantification is achieved by preparing standards of the element. Principle 8
  • 9.
    Principle  The techniquemakes use of the atomic absorption spectrum of a sample in order to assess the concentration of specific analytes within it.  It requires standards with known analyte content to establish the relation between the measured absorbance and the analyte concentration and relies therefore on the Beer-Lambert law.  The Beer-Lambert law is the linear relationship between absorbance and concentration of an absorbing species. 9
  • 10.
    Principle Beer–Lambert Law A isthe measure of Absorbance I is the intensity of light coming out of the flow cell I0 is the intensity of light going into the flow cell α is the specific absorption of the material (in L mol−1 cm−1) c is the concentration of material (in mol L−1) l is the length of the flow cell (in cm) Fig 5. Beer–Lambert Law Fig 6. Graphical representation of the concentration versus absorption, showing The linear relationship of the Beer–Lambert law Absorbance Concentration 10
  • 11.
    Principle The selection ofa preparation method is dependent upon:  the analyte(s)  the analyte concentration level(s)  the sample matrix  the instrumental measurement technique  the required sample size  instrument operation conditions  cost  Environmental considerations 11
  • 12.
    Principle Sample Preparation  Dilution– sample is diluted in distilled water, acids or organic solvent.  Decomposition – isolation of required element from the sample by heating:  Wet/acid decomposition (300C).  Dry ashing (400-500C).  Microwave decomposition (100-200C).  Reading the absorption of standard solutions.  A series of standard solutions should be prepared.  Calibration curve must be prepared for the Blank(s) and standard solution(s) must be prepared using different concentrations of the sample.  Measuring the absorbance of the unknown sample. 12
  • 13.
  • 14.
  • 15.
    Instrumentation Source of light HollowCathode Lamp (HCL) Electrodeless Discharge Lamps 15
  • 16.
    Instrumentation Source of light HollowCathode Lamp (HCL)  HCL is the most common radiation source in AAS.  It contains a tungsten anode and a hollow cylindrical cathode made of the element to be determined.  These are sealed in a glass tube filled with an inert gas (neon, argon).  Each element has its own unique lamp which must be used for that analysis. 16
  • 17.
    Instrumentation Source of light Hollow Cathode Lamp (HCL) Fig 8. Hollow Cathode Lamp (HCL) and its construction 17
  • 18.
    Instrumentation Source of light Electrodeless Discharge Lamps  A small amount of the metal or salt of the element for which the source is to be used is sealed inside a quartz bulb.  This bulb is placed inside a small, self-contained RF generator or “driver”. When power is applied to the driver, an RF field is created.  The coupled energy will vaporize and excite the atom inside the bulb causing them to emit their characteristic spectrum.  They are typically much more intense and, in some cases, more sensitive than comparable HCL. Hence better precision and lower detection limits where an analysis is intensity limited.  EDLs are available for a wide variety of elements. 18
  • 19.
    Instrumentation Source of light Electrodeless Discharge Lamps Fig 9. Electrodeless Discharge Lamps and its construction 19
  • 20.
    Instrumentation Nebuliser  The nebuliserforms a mist or aerosol of the sample.  This is done by forcing the sample at high velocities through a narrow tube.  The sample is mixed with a fuel and oxidant.  Commonly used fuel-oxidant mixtures are acetylene-air and acetylene-nitrous oxide. 20
  • 21.
    Instrumentation Nebuliser Table 1. Fueland oxidant used for flame combustion. 21
  • 22.
  • 23.
    Instrumentation Atomiser  Flame atomizersAtomic Absorption Spectroscopy (FAAS)  Electro-thermal atomizers (or graphite furnace) Atomic Absorption Spectroscopy (ET-AAS)  Zeeman Graphite Furnace Atomic Absorption Spectroscopy (ZGF-AAS)  Hydride Generation Atomic Absorption Spectroscopy (HG-AAS)  Cold Vapor Atomic Absorption Spectroscopy (CV-AAS)  Atomization is separation of particles into individual molecules and breaking molecules into atoms. This is done by exposing the analyte to high temperatures in a flame or graphite furnace. In the atomiser the sample solutions is vaporised and the molecules are atomized. Atomiser can be of two types: 23
  • 24.
    Instrumentation Atomiser  Flame atomizers Flame is used to atomize the sample.  Sample when heated is broken into its atoms.  High temperature of flame causes excitation.  Electrons of the atomized sample are promoted to higher orbitals, by absorbing certain amount of energy. 24
  • 25.
    Instrumentation Atomiser  Flame atomizers SampleNebulizer assembly Conversion into fine mist or small droplets of solution Aspirated into spray chamber (mixing chamber) Aerosol mixes with combustion gases Flame Atomization occurs Fig 11. Flame atomization cycle 25
  • 26.
    Instrumentation Atomiser  Flame atomizers Disadvantagesof Flame Atomization  Only 5-15% of the nebulized sample reaches the flame.  A minimum sample volume of 0.5-1.0 ml is needed to give a reliable reading.  Samples which are viscous require dilution with a solvent. 26
  • 27.
    Instrumentation Atomiser  Electro-thermal atomizersor graphite furnace  Graphite furnace atomic absorption spectrometry (GFAAS) (also known as Electro thermal Atomic Absorption spectrometry (ETAAS)) is a type of spectrometry that uses a graphite-coated furnace to vaporize the sample.  Instead of employing the high temperature of a flame, to bring about the production of atoms from the sample and it is non-flame methods involving electrically heated graphite tubes or rods. 27
  • 28.
    Instrumentation Atomiser  Electro-thermal atomizersor graphite furnace Fig 12. A graphite furnace electrothermal atomizer 28
  • 29.
    Instrumentation Atomiser  Graphite furnace Disadvantagesof Graphite Furnace Advantages of Graphite Furnace Small sample size Very little or no sample preparation is needed Sensitivity is enhanced Direct analysis of solid samples Analyte may be lost at the ashing stage The sample may not be completely atomized The precision is poor than flame method Analytical range is relatively low 29
  • 30.
    Instrumentation Monochromator  This isa very important part in an AA spectrometer. It is used to separate out all of the thousands of lines.  A monochromator is used to select the specific wavelength of light which is absorbed by the sample, and to exclude other wavelengths.  The selection of the specific light allows the determination of the selected element in the presence of others. Fig 13. Monochromator internal construction 30
  • 31.
    Instrumentation Detector  The lightselected by the monochromator is directed onto a detector that is typically a photomultiplier tube, whose function is to convert the light signal into an electrical signal proportional to the light intensity.  The processing of electrical signal is fulfilled by a signal amplifier. The signal could be displayed for readout, or further fed into a data station for printout by the requested format. 31
  • 32.
  • 33.
  • 34.
    Interferences Fig 16. Interferencesand control measures 34
  • 35.
  • 36.
  • 37.
    References A. Walsh (1955),The application of atomic absorption spectra to chemical analysis, Spectrochim. Acta 7: 108–117. Analytical Methods for Atomic Absorption Spectroscopy – Perkin-Elmer Atomic absorption spectrometry – Royal Society of Chemistry B. Welz, H. Becker-Ross, S. Florek, U. Heitmann (2005), High-resolution Continuum Source AAS, Wiley-VCH, Weinheim, Germany, ISBN 3-527-30736-2. B. Welz, M. Sperling (1999), Atomic Absorption Spectrometry, Wiley-VCH, Weinheim, Germany, ISBN 3-527-28571-7. B.V. L’vov (1984), Twenty-five years of furnace atomic absorption spectroscopy, Spectrochim. Acta Part B, 39: 149–157. B.V. L’vov (2005), Fifty years of atomic absorption spectrometry; J. Anal. Chem., 60: 382–392. H. Becker-Ross, S. Florek, U. Heitmann, R. Weisse (1996), Influence of the spectral bandwidth of the spectromeer on the sensitivity using continuum source AAS, Fresenius J. Anal. Chem. 355: 300–303. H. Massmann (1968), Vergleich von Atomabsorption und Atomfluoreszenz in der Graphitküvette, Spectrochim. Acta Part B, 23: 215–226. http://www.cee.vt.edu J.A.C. Broekaert (1998), Analytical Atomic Spectrometry with Flames and Plasmas, 3rd Edition, Wiley-VCH, Weinheim, Germany. J.M. Harnly (1986), Multi element atomic absorption with a continuum source, Anal. Chem. 58: 933A-943A. Ma, G. and Gonzales, G.B. Flame Atomic Absorption Spectrometry. Manning T.J. and Grow W.P. Inductively Coupled Plasma Atomic Emission Spectrometry. The Chemical Educator, v.1. N 2. 1997. NMSU web note Sample Preparation For Flame Atomic Absorption Skoog, D. Fundamentals of Analytical Chemistry, 2004. Skoog, Douglas (2007). Principles of Instrumental Analysis (6th ed.). Canada: Thomson Brooks/Cole. ISBN 0-495-01201-7. Spectroscopy: An Overview - Nabil Ramadan Bader W. Slavin, D.C. Manning, G.R. Carnrick (1981), The stabilized temperature platform furnace, At. Spectrosc. 2: 137–145. 37