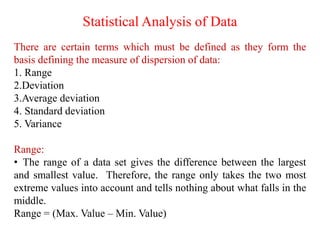
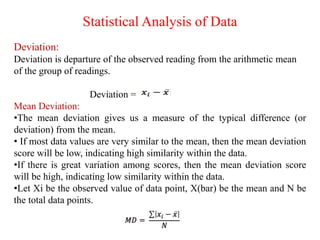
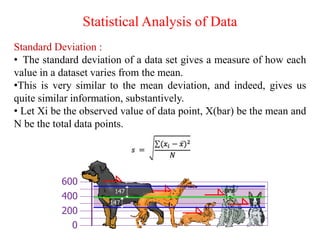
This document discusses errors in measurement and different types of errors. It explains that there are five main elements that can cause errors: standards, work pieces, instruments, persons, and environment. There are three types of errors: systematic errors, which occur due to imperfections and are of fixed magnitude; random errors, which occur irregularly; and statistical analysis can be used to analyze random errors through calculations of mean, range, deviation, and standard deviation. Systematic errors include instrumental errors from faulty instruments, environmental errors from external conditions, and observational errors from human factors like parallax.
Sachpazis:Terzaghi Bearing Capacity Estimation in simple terms with Calculati...
Errors in measurement
1. Errors in Measurement
(Sub: Measurement and Metrology)
Code: BMEC0003
Instructor
Mr. Gaurav Bharadwaj
Assistant Prof.
Department of ME
GLA University
2. Cause of Errors
As I discussed in previous lecture, main elements of Metrology are:
1. Standard
2. Work piece
3. Instruments
4. Persons
5. Environment
• These five elements are also causes of errors in measurement
because accuracy in measurement depends upon these elements.
3. Types of Errors
There are three types of errors:
1. Systematic errors
2. Random errors
4. Systematic errors
• These types of errors occur due to any imperfection in the
measuring instrument or use of measuring instrument in a wrong
manner.
• These are of fixed magnitude.
• Nature of error is also fixed i.e. either positive or negative.
Systematic Errors classified into three categories :-
1. Instrumental Errors
2. Environmental Errors
3. Observational Errors
5. Systematic errors
Instrumental Errors:
• These errors arise due to faulty construction and calibration of the measuring
instruments.
• Such errors arise due to friction in instruments.
• Lots of the time, the equipment being used is faulty due to misuse which changes
the reading of the equipment.
•The zero error is a very common type of error.
• This error is common in devices like vernier calipers and screw gauge.
• The zero error can be either positive or negative.
•Sometimes the readings of the scale are worn off and this can also lead to a bad
reading.
Examples:
• Non uniform divisions on meter scale
•Instrument showing the reading initially from some value not from zero.
6. Systematic Errors
Environmental errors:
• This type of error arises in the measurement due the effect of the
external conditions on the measurement.
• The external condition includes temperature, pressure, and
humidity, etc.
Example:
If you measure your temperature under the armpits and during the
measurement if the electricity goes out and the room gets hot, it
will affect your body temperature thereby affecting the reading.
7. Systematic errors
Observational Errors:
There are many sources of observational errors:
• Parallax, i.e. Apparent displacement when the line of vision is not
normal to the scale.
• Inaccurate estimate of average reading.
• Wrong scale reading and wrong recording the data.
• Incorrect conversion of units between consecutive reading.
8. • Here in Graph, Full Line shows the systematic Error in non
Linear Instrument.
• While Broken Line shows response of an ideal instrument
without Error.
9. Random errors
• The random errors are those errors, which occur irregularly and
hence are random.
• These can arise due to random and unpredictable fluctuations in
experimental conditions (e.g. unpredictable fluctuations in
temperature, voltage supply, mechanical vibrations of experimental
set-ups, etc, errors by the observer taking readings, etc.
• For example, when the same person repeats the same observation,
it is very likely that he may get different readings every time.
11. Statistical Analysis of Data
Arithmetic mean:
• The best approximation that can be made of a number of readings
of the same quantity is the arithmetic mean.
• It is also called Mean value.
• This mean is computed by summing all the values and dividing by
the number of measurements.
12. Statistical Analysis of Data
Dispersion from the mean:
• The property which denotes the extent to which the values are
dispersed about the central value is termed as dispersion.
•It also known as spread or scatter.
• Let the distribution of income in our random samples from year
2000 and 2015.
•We see that the two curves for the year 2015 and year 2000 have
the same mean i.e 52, but the curve for year 2015 is more spread out
as compared to that for year 2000.
•Thus, as compared to 2000,
there were more people in 2015
with higher and lower incomes
which validates our claim.
13. Statistical Analysis of Data
There are certain terms which must be defined as they form the
basis defining the measure of dispersion of data:
1. Range
2.Deviation
3.Average deviation
4. Standard deviation
5. Variance
Range:
• The range of a data set gives the difference between the largest
and smallest value. Therefore, the range only takes the two most
extreme values into account and tells nothing about what falls in the
middle.
Range = (Max. Value – Min. Value)
14. Statistical Analysis of Data
Deviation:
Deviation is departure of the observed reading from the arithmetic mean
of the group of readings.
Deviation =
Mean Deviation:
•The mean deviation gives us a measure of the typical difference (or
deviation) from the mean.
• If most data values are very similar to the mean, then the mean deviation
score will be low, indicating high similarity within the data.
•If there is great variation among scores, then the mean deviation score
will be high, indicating low similarity within the data.
•Let Xi be the observed value of data point, X(bar) be the mean and N be
the total data points.
15. Statistical Analysis of Data
Standard Deviation :
• The standard deviation of a data set gives a measure of how each
value in a dataset varies from the mean.
•This is very similar to the mean deviation, and indeed, gives us
quite similar information, substantively.
• Let Xi be the observed value of data point, X(bar) be the mean and
N be the total data points.