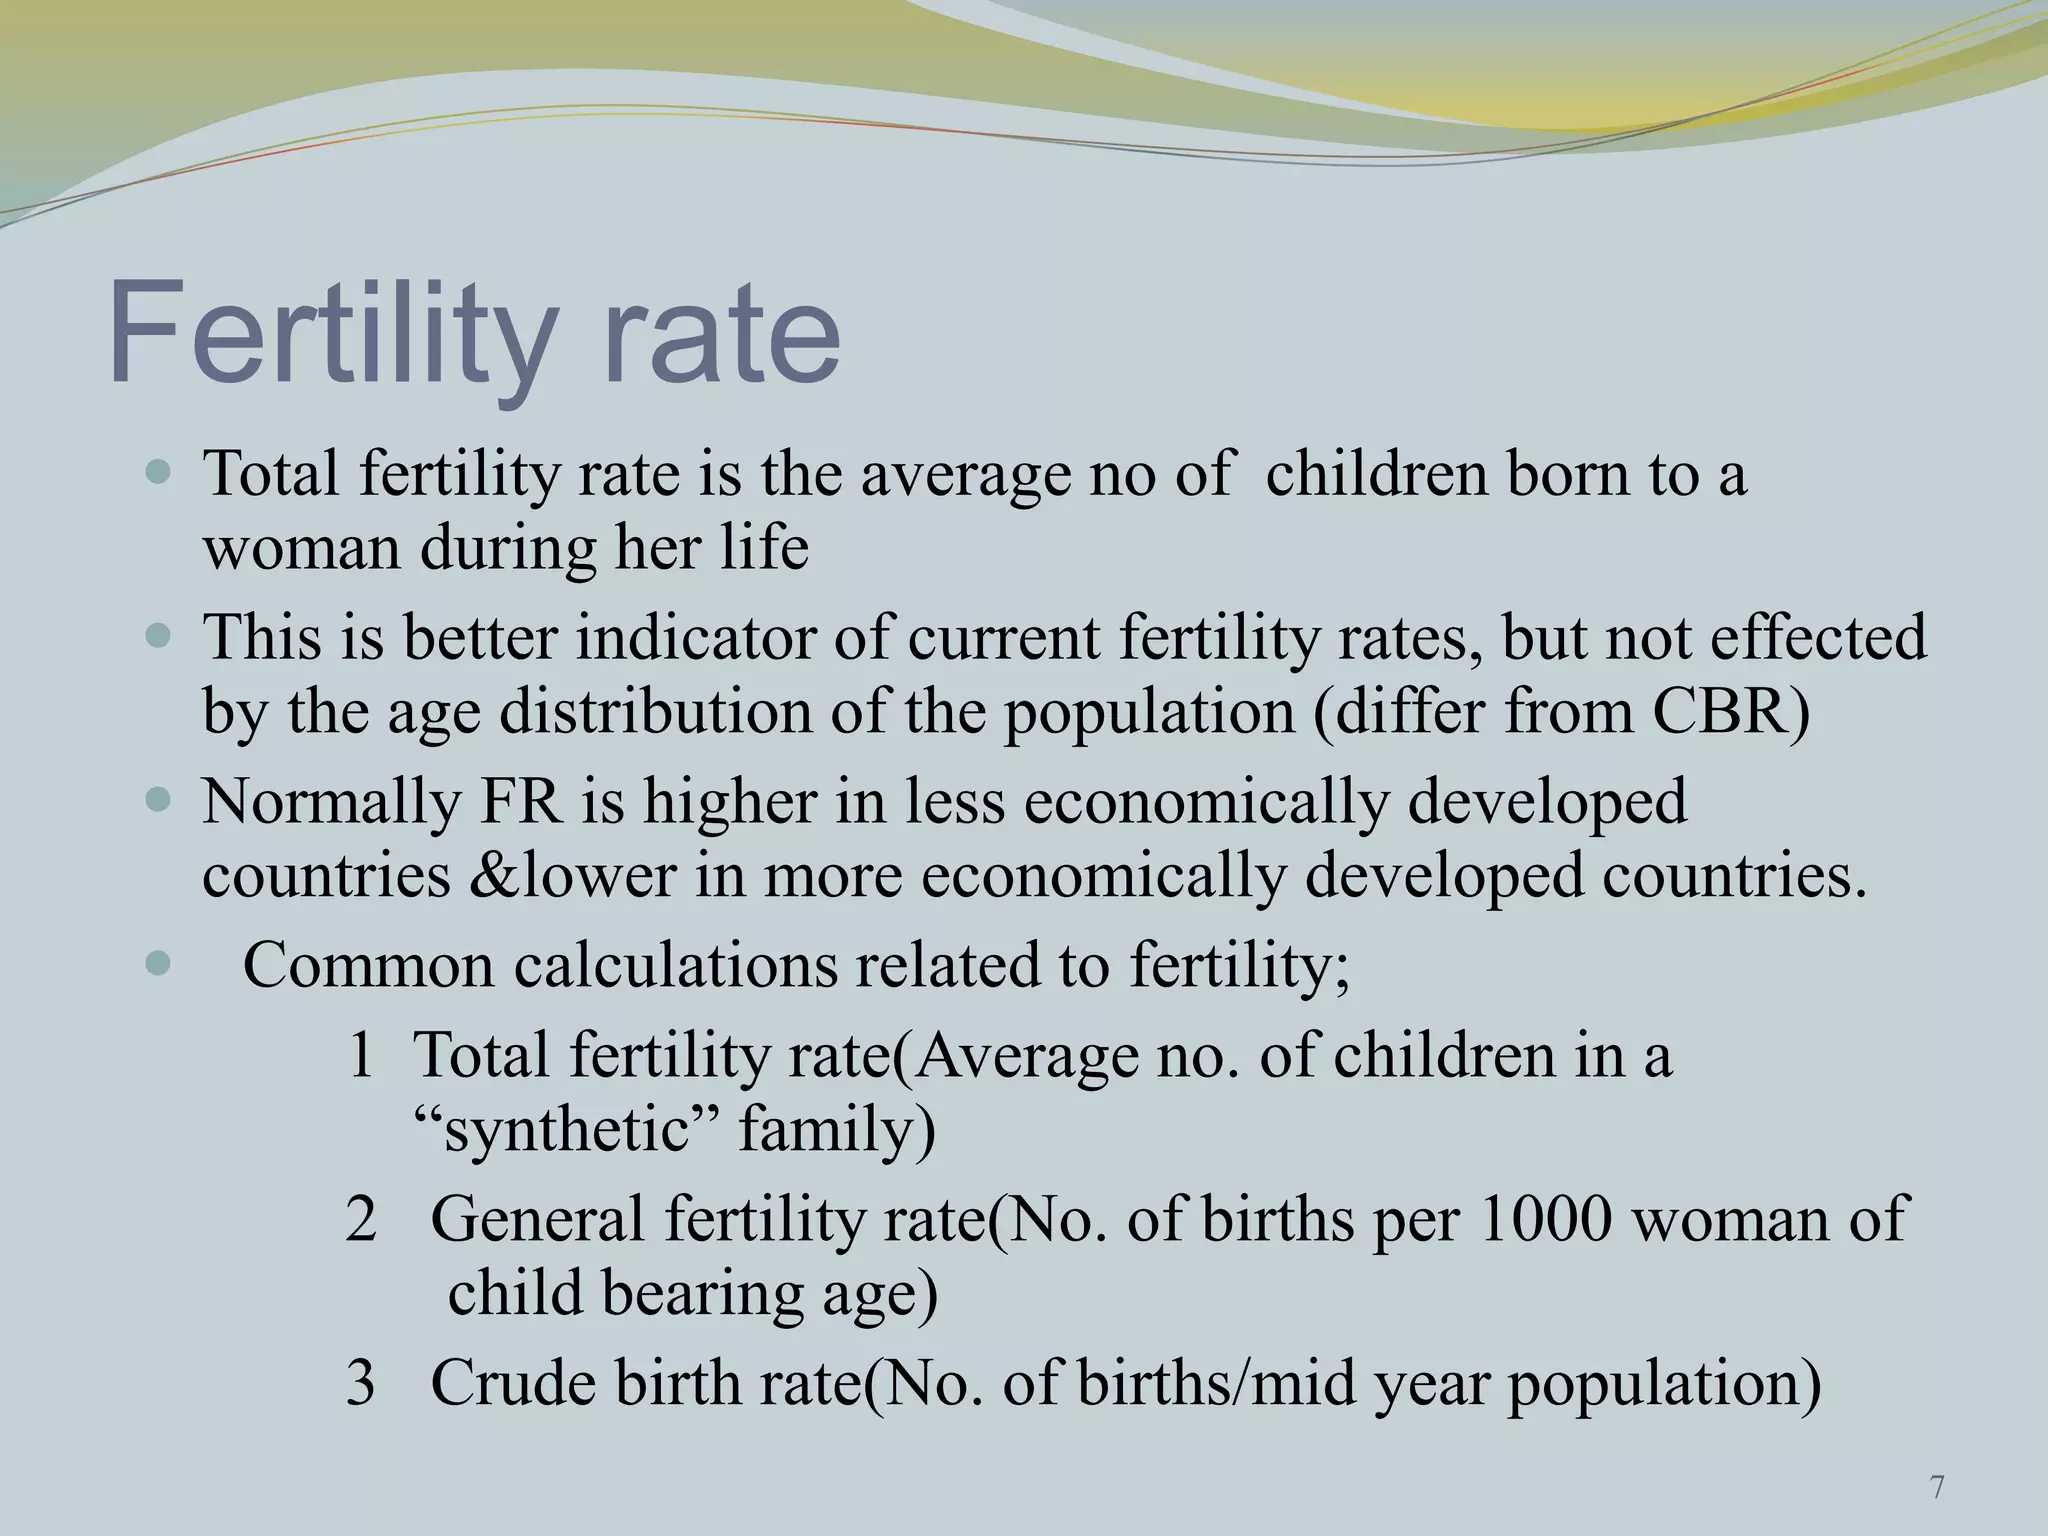
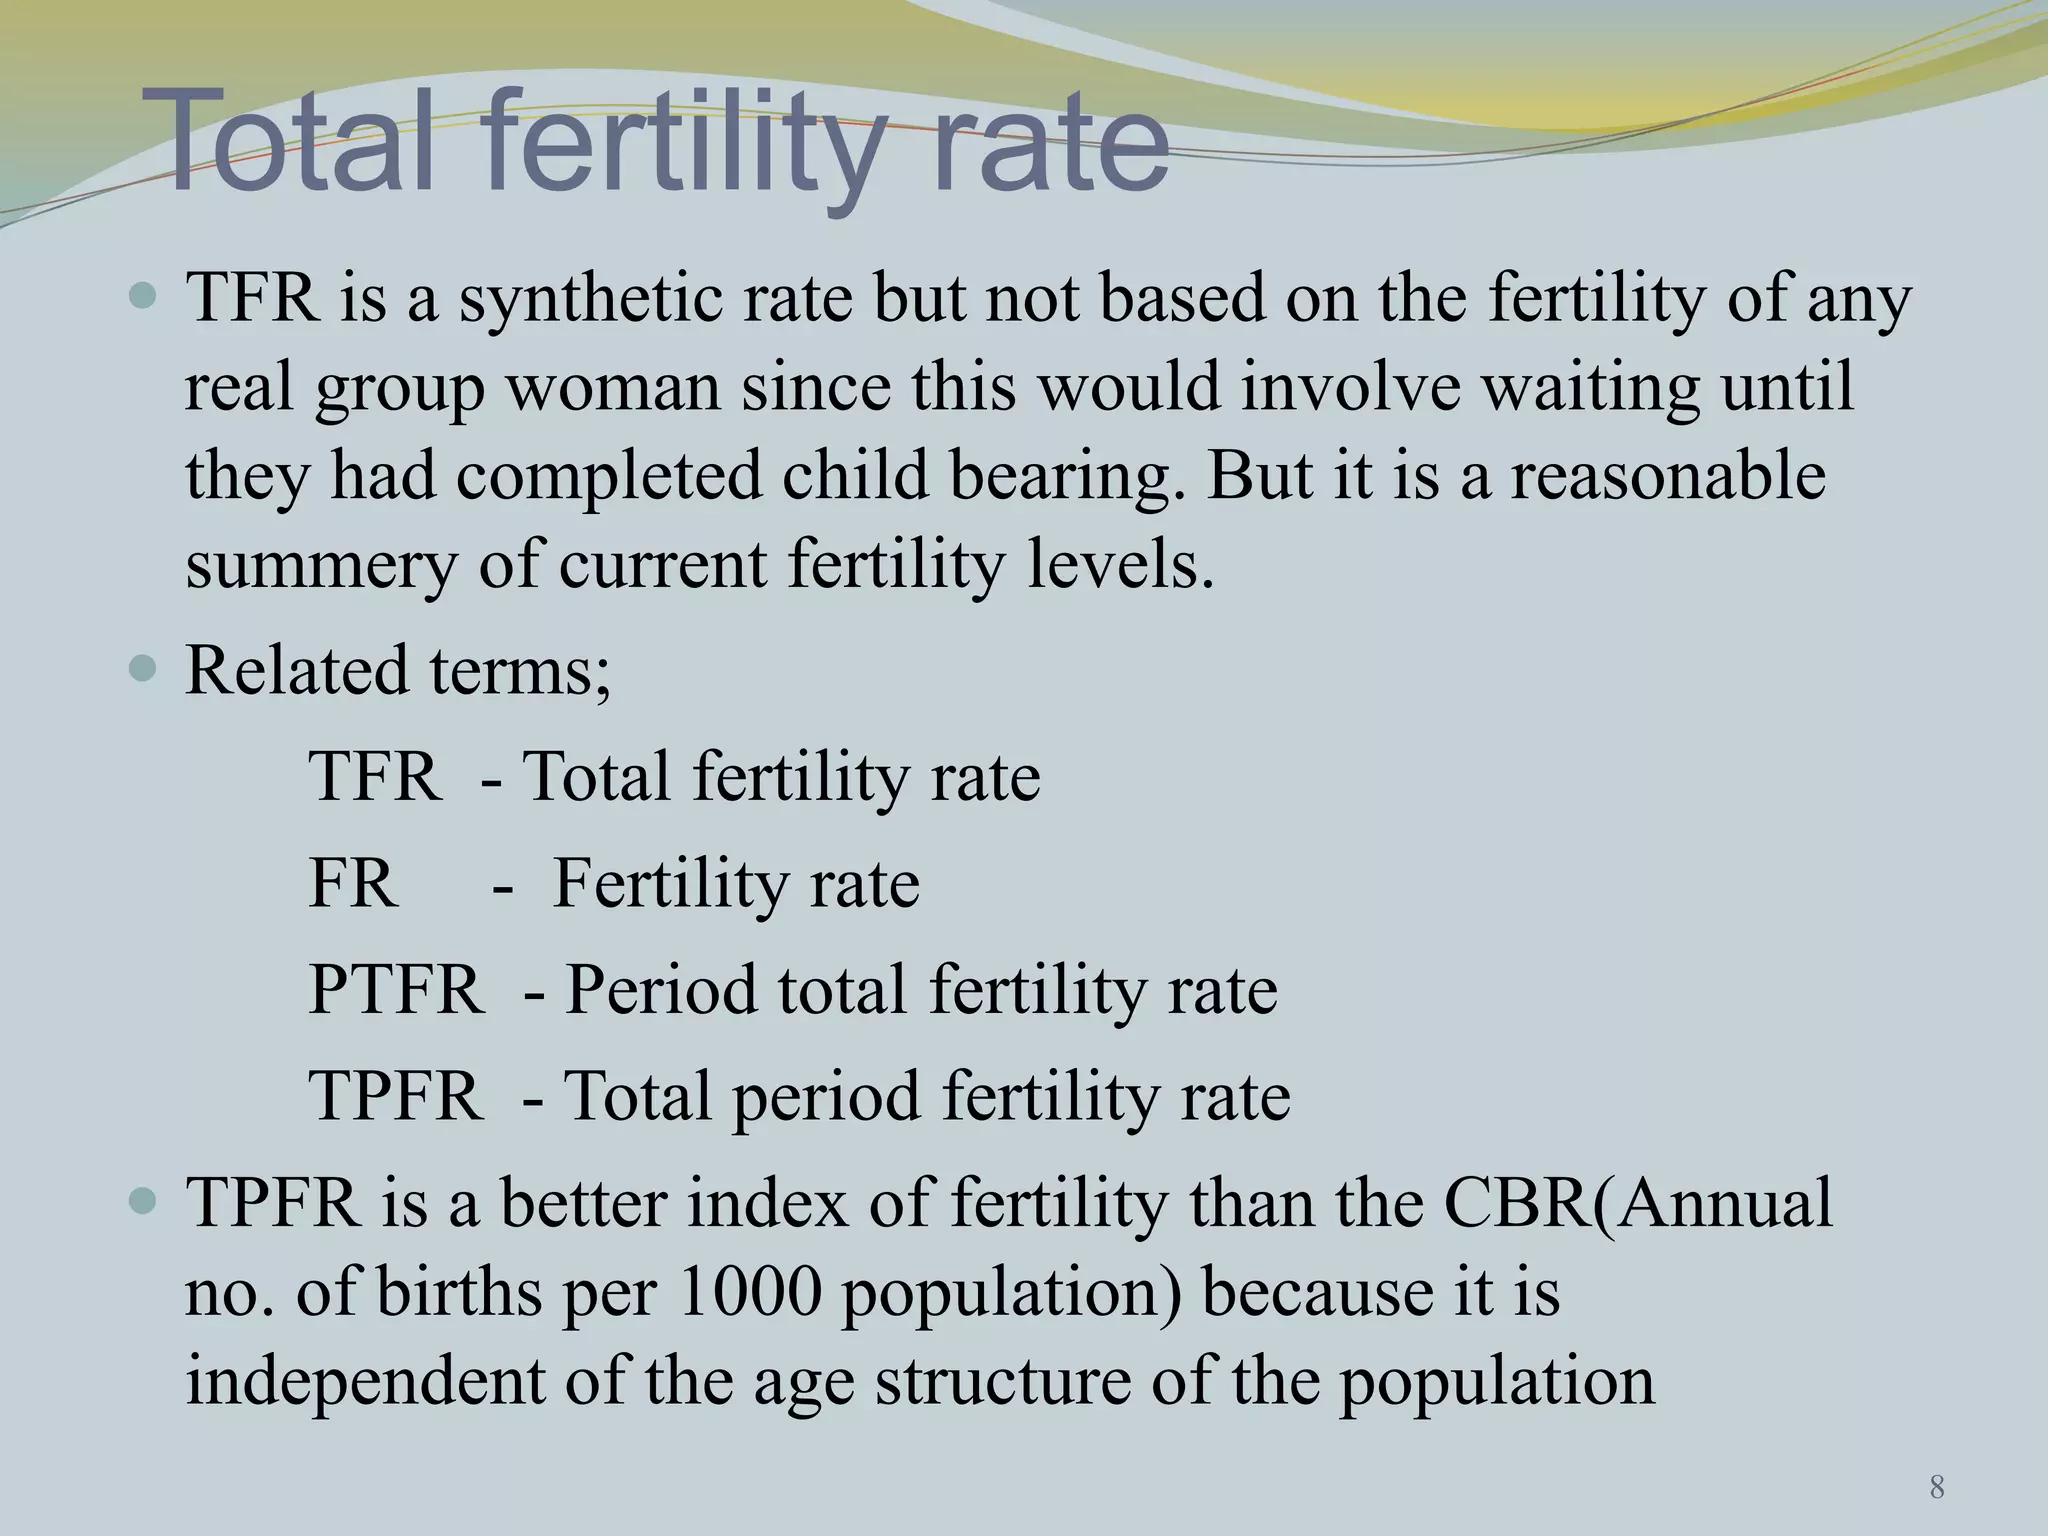
By Dr. Apsara Nishshanka 
1
The crude birth rate 
 Definition: 
No. of births per 1000 people per year (natality) 
 Measurement method: 
CBR=No of births in a given year, during a given time period 
(calander year) / Total population* 1000 
 Crude birth rate - crude death rate = The rate of natural increase(RNI) 
 This is also equal to the rate of population change in the absence of migration. 
 we can show this Age specially as well. 
( No of births per thousand persons in an Age group) 
2
Birth rate 
 The birth rate is typically the rate of births in a 
population over a time 
In 2012 the average global birth rate was 20.15 (births 
for 1000 total population) 
It was 20.09 in the year 2007 
Birth rates ranging from 10-20 births per 1000 are 
considered low 
40-50 considered high 
3
Government population policy, such as pronatalist or 
antinaterlist policies (eg.Tax on childlessness) 
Availability of family planning services, such as birth control & 
sex education 
Availability & safety of abortion & the safety of child birth 
Infant mortality rate 
Existing Age –sex structure 
Typical Age of marriage 
Social religious beliefs especially in relation to contraception and 
abortion 
Industrialization 
Economic prosperity or economic difficulty;(In economic 
difficulty times couples delay child bearing 
4
 Poverty levels 
Urbanization 
Pension availability 
Conflict 
Illiteracy & un employment 
5
Demographic transition 
 DT refers to the decline in population mortality & fertility 
decline with social and economic development 
 The 2 major factors affecting DT are the CBR & CDR 
 The CBR in S/L was 18.16 in 2010 (WBR-2012) 
 In pre industrial time high birth and death rates, then the birth 
rate was almost constant for a certain period of time while 
death rate was reducing .and then be constant it as well (due to 
better sanitation & health care) 
 After that transitional period, at the post industrial time both 
birth & death rates are become low and almost constant. 
 In S/L specially can see declining fertility . 
6
Fertility rate 
 Total fertility rate is the average no of children born to a 
woman during her life 
 This is better indicator of current fertility rates, but not effected 
by the age distribution of the population (differ from CBR) 
 Normally FR is higher in less economically developed 
countries &lower in more economically developed countries. 
 Common calculations related to fertility; 
1 Total fertility rate(Average no. of children in a 
“synthetic” family) 
2 General fertility rate(No. of births per 1000 woman of 
child bearing age) 
3 Crude birth rate(No. of births/mid year population) 
7
Total fertility rate 
 TFR is a synthetic rate but not based on the fertility of any 
real group woman since this would involve waiting until 
they had completed child bearing. But it is a reasonable 
summery of current fertility levels. 
 Related terms; 
TFR - Total fertility rate 
FR - Fertility rate 
PTFR - Period total fertility rate 
TPFR - Total period fertility rate 
 TPFR is a better index of fertility than the CBR(Annual 
no. of births per 1000 population) because it is 
independent of the age structure of the population 
8
9
10
11 
TFR of S/L
Replacement rates 
 RR is the TFR at which new born girls would have an 
average of exactly one daughter over their life times. 
 If there were no mortality rate in the female population 
until the end of the child bearing years of age (generally 
44 or 49);then the replacement level of TFR would be 
very close to 2.0 (but male births are slightly higher in 
human population) 
 Roughly, replacement fertility rate (RFR) of industrialized 
countries is - 2.1 ; but due to higher mortality rate it is 
about 2.5 to3.3 in developing countries 
12
Replacement level is affected by; 
 Mortality 
 Asexuality 
 Genetic disorders inhibiting procreation 
 Women who have no desire to have children 
(Woman have just enough female babies to replace 
themselves, or equivalently, adults have just enough 
total babies to replace them selves) 
 NRR - no. of daughters a woman would have in her 
life time it is also important specially For the 
areas male borns high 
13
When taken globally, the TFR at replacement is 2.33 
children per woman 
At this rate global population growth would trend towards 
zero 
If there is a high death or emigration rate and TFR also 
not maintained more than regular values, population 
dropped below replacement level, of it is carries forward 
for several generations is called population lag effect. 
In developed countries low FR,& MR(due to greater 
wealth ,education and urbanization, birth control is 
understood & easily accessible) 
In developing countries the situation is observed 
contravasary. 
14
Thank you 
15

An brief introduction to the

  • 1.
    By Dr. ApsaraNishshanka 1
  • 2.
    The crude birthrate  Definition: No. of births per 1000 people per year (natality)  Measurement method: CBR=No of births in a given year, during a given time period (calander year) / Total population* 1000  Crude birth rate - crude death rate = The rate of natural increase(RNI)  This is also equal to the rate of population change in the absence of migration.  we can show this Age specially as well. ( No of births per thousand persons in an Age group) 2
  • 3.
    Birth rate The birth rate is typically the rate of births in a population over a time In 2012 the average global birth rate was 20.15 (births for 1000 total population) It was 20.09 in the year 2007 Birth rates ranging from 10-20 births per 1000 are considered low 40-50 considered high 3
  • 4.
    Government population policy,such as pronatalist or antinaterlist policies (eg.Tax on childlessness) Availability of family planning services, such as birth control & sex education Availability & safety of abortion & the safety of child birth Infant mortality rate Existing Age –sex structure Typical Age of marriage Social religious beliefs especially in relation to contraception and abortion Industrialization Economic prosperity or economic difficulty;(In economic difficulty times couples delay child bearing 4
  • 5.
     Poverty levels Urbanization Pension availability Conflict Illiteracy & un employment 5
  • 6.
    Demographic transition DT refers to the decline in population mortality & fertility decline with social and economic development  The 2 major factors affecting DT are the CBR & CDR  The CBR in S/L was 18.16 in 2010 (WBR-2012)  In pre industrial time high birth and death rates, then the birth rate was almost constant for a certain period of time while death rate was reducing .and then be constant it as well (due to better sanitation & health care)  After that transitional period, at the post industrial time both birth & death rates are become low and almost constant.  In S/L specially can see declining fertility . 6
  • 7.
    Fertility rate Total fertility rate is the average no of children born to a woman during her life  This is better indicator of current fertility rates, but not effected by the age distribution of the population (differ from CBR)  Normally FR is higher in less economically developed countries &lower in more economically developed countries.  Common calculations related to fertility; 1 Total fertility rate(Average no. of children in a “synthetic” family) 2 General fertility rate(No. of births per 1000 woman of child bearing age) 3 Crude birth rate(No. of births/mid year population) 7
  • 8.
    Total fertility rate  TFR is a synthetic rate but not based on the fertility of any real group woman since this would involve waiting until they had completed child bearing. But it is a reasonable summery of current fertility levels.  Related terms; TFR - Total fertility rate FR - Fertility rate PTFR - Period total fertility rate TPFR - Total period fertility rate  TPFR is a better index of fertility than the CBR(Annual no. of births per 1000 population) because it is independent of the age structure of the population 8
  • 9.
  • 10.
  • 11.
  • 12.
    Replacement rates RR is the TFR at which new born girls would have an average of exactly one daughter over their life times.  If there were no mortality rate in the female population until the end of the child bearing years of age (generally 44 or 49);then the replacement level of TFR would be very close to 2.0 (but male births are slightly higher in human population)  Roughly, replacement fertility rate (RFR) of industrialized countries is - 2.1 ; but due to higher mortality rate it is about 2.5 to3.3 in developing countries 12
  • 13.
    Replacement level isaffected by;  Mortality  Asexuality  Genetic disorders inhibiting procreation  Women who have no desire to have children (Woman have just enough female babies to replace themselves, or equivalently, adults have just enough total babies to replace them selves)  NRR - no. of daughters a woman would have in her life time it is also important specially For the areas male borns high 13
  • 14.
    When taken globally,the TFR at replacement is 2.33 children per woman At this rate global population growth would trend towards zero If there is a high death or emigration rate and TFR also not maintained more than regular values, population dropped below replacement level, of it is carries forward for several generations is called population lag effect. In developed countries low FR,& MR(due to greater wealth ,education and urbanization, birth control is understood & easily accessible) In developing countries the situation is observed contravasary. 14
  • 15.