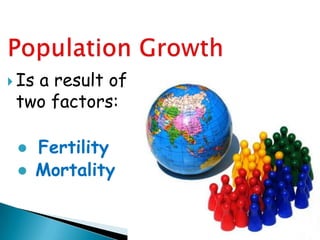
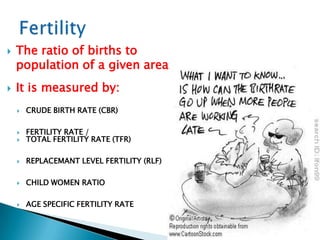
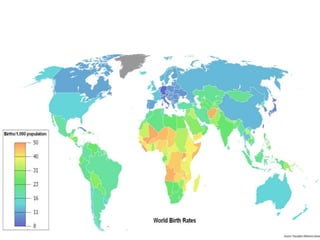
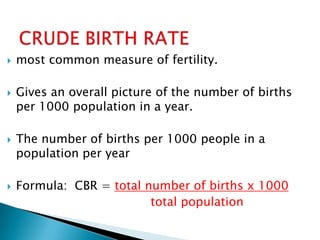
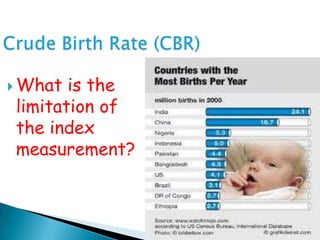
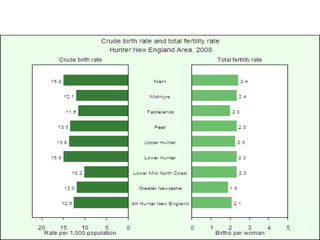
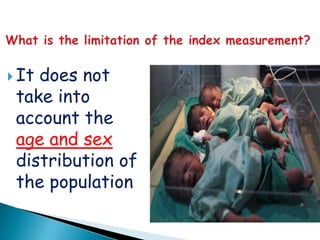
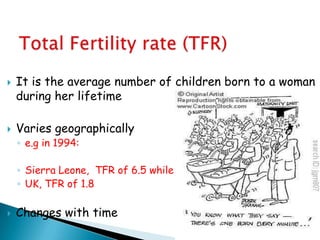
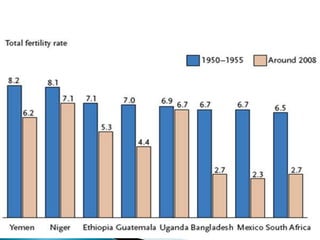
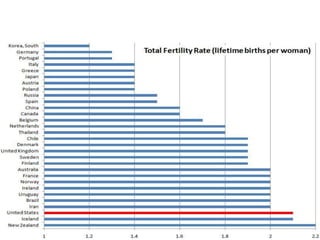
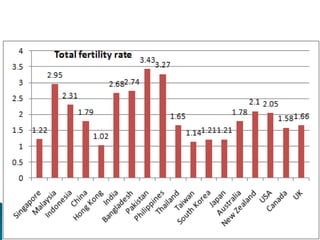
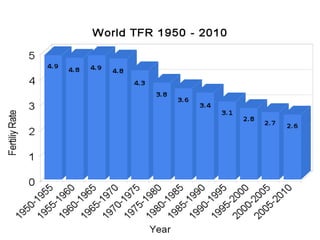
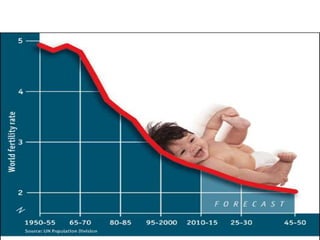
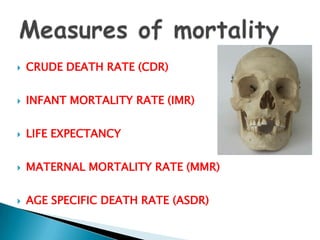
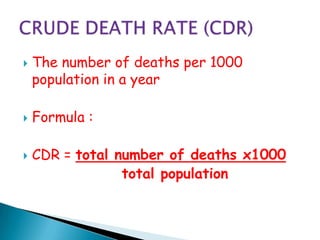
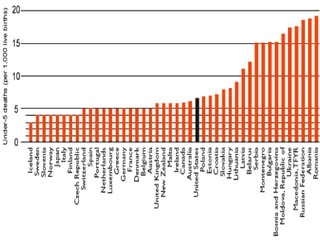
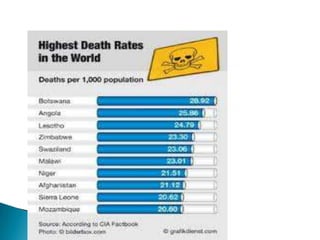
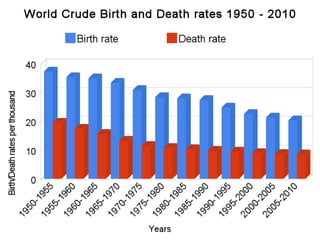
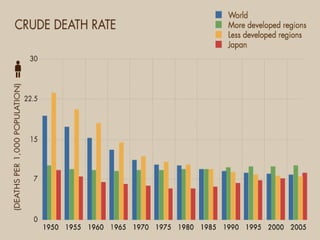
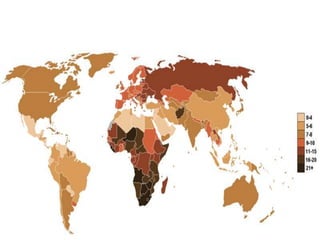
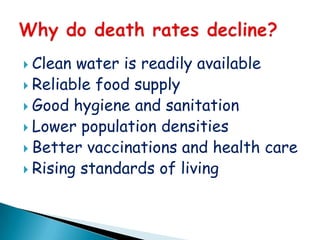
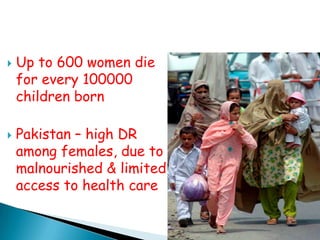
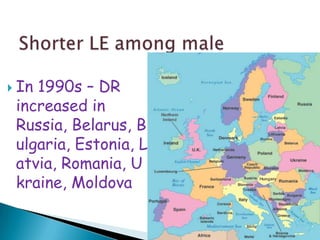
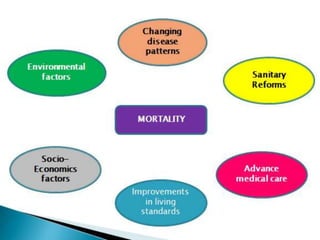
Fertilty
Mortality
 Is
   a result of
 two factors:

 ● Fertility
 ● Mortality
   The ratio of births to
    population of a given area
   It is measured by:
       CRUDE BIRTH RATE (CBR)

       FERTILITY RATE /
       TOTAL FERTILITY RATE (TFR)

       REPLACEMANT LEVEL FERTILITY (RLF)

       CHILD WOMEN RATIO

       AGE SPECIFIC FERTILITY RATE
   most common measure of fertility.

   Gives an overall picture of the number of births
    per 1000 population in a year.

   The number of births per 1000 people in a
    population per year

   Formula: CBR = total number of births x 1000
                          total population
 What is the
limitation of
the index
measurement?
 Itdoes not
 take into
 account the
 age and sex
 distribution of
 the population
   It is the average number of children born to a woman
    during her lifetime

   Varies geographically
    ◦ e.g in 1994:

    ◦ Sierra Leone, TFR of 6.5 while
    ◦ UK, TFR of 1.8

   Changes with time
   Is the level at which each generation of women has
    only enough daughters to replace themselves in the
    population

   What is the ideal replacement level?
    2.1 0r 2
 Mortality may prevent a proportion
 of the female children from
 reaching their productive years and
 also, on average, slightly more boys
 are born than girls
   Find the natural increase if

   a. BR = 25/1000           DR = 10/1000

   b. BR = 5/1000            DR = 10/1000

   c. BR = 10/1000           DR = 10/1000
   High fertilty rates ( 4.0 & above)


   Medium fertility rates (2.2 – 3.9)


   Low fertility rate: (2.1 & below)
a. Infant and child mortality
b. Population momentum
c. Views towards children
d. Status for women
e. Cultural factors
f. Religion factors
g. Political factors
 Isthe ratio of
 deaths to the
 population of a
 given area
   CRUDE DEATH RATE (CDR)


   INFANT MORTALITY RATE (IMR)


   LIFE EXPECTANCY


   MATERNAL MORTALITY RATE (MMR)


   AGE SPECIFIC DEATH RATE (ASDR)
   The number of deaths per 1000
    population in a year

   Formula :

   CDR = total number of deaths x1000
                 total population
 Yes!!!

 Itshows whether there is
 improvement in health system or
 not.
 If the CDR is low meaning there is
 improvement in health and if there
 is no improvement, CDR will be high
   It is a measure
    of the number
    of deaths of
    infants before
    the age of one
    per 1000 live
    births in a year
   Children respond
    easily to the state of
    their mother’s health
    and the state of pre
    and ante-natal
    services
   The average
    number of years a
    person is expected
    to live

   When mortality
    declines, life
    expectancy will
    increase
   Ageing population
   Accessibility to amenities
   Government commitment to improve health care
   Living environment
   Colonial past influence in LEDCs
   Education among mothers and adults
   Aids epidemic
   Population growth is even slower in developed countries

    Stabilising birth rates
    & increasing death
    rates have already
    led to natural
    population decrease
    in Italy & Germany

   Japan & Spain are
   expected to
   follow soon
 Lack of clean water
 Lack of food
 Poor hygiene and sanitation
 Overcrowding
 Contagious diseases such as diarrhea
  and respiratory infections
 Poverty
 The occurrence of war
 Clean water is readily available
 Reliable food supply
 Good hygiene and sanitation
 Lower population densities
 Better vaccinations and health care
 Rising standards of living
   Highest death rates
    are found in LEDCs
    esp. Sub-Saharan
    Africa.

   Mali, Gambia, Sierra
    Leone, Uganda, Zambi
    a – DR of 20/1000
   Up to 600 women die
    for every 100000
    children born

   Pakistan – high DR
    among females, due to
    malnourished & limited
    access to health care
 In1990s – DR
 increased in
 Russia, Belarus, B
 ulgaria, Estonia, L
 atvia, Romania, U
 kraine, Moldova
 Increase Cardiovascular disease
 Accidents
 Suicides
 Murders
 Stress
 Substance abuse (smoking & drinking)


   All these linked to increased
    unemployment, and worsening living
    condition
 The greater the
 proportion of
 population in the
 old age (65+), the
 higher the death
 rate for the
 population as a
 whole
 Mr. Henry
 Allingham was
 born on June
 6, 1896 and is
 now 112.
   Of the 40,399
    centenarians, 87
    percent are
    women, the Health and
    Welfare Ministry said.

   Japan's centenarian
    numbers rank it second
    in the world behind
    the United
    States, which now has
    more than
    96,000, according to
    U.S. Census Bureau
    estimates. But the
    U.S. population is more
    than double that of
    Japan.
 By2066, there
 are predicted to
 be over half a
 million people
 aged over 100
   Increase in the dependency ratio. This means that there
    will be more people claiming benefits such as state
    pensions and less people working and paying income taxes

   Increased government spending on health care and
    pensions

   Those in work will have to pay higher taxes. This could
    create disincentives to work and for firms to invest,
    therefore there could be a fall in productivity growth.

   Shortage of workers. This shortage of workers could
    push up wages causing wage inflation. Alternatively, firms
    may have to respond by encouraging more people to enter
    the workforce, through offering flexible working
    practices.
   Increase participation rate,

   Raise the retirement age

   Increase the importance of the private
    sector in providing pensions and health
    care. However this may cause increased
    inequality
Population growth lesson3

Population growth lesson3

  • 1.
  • 2.
     Is a result of two factors: ● Fertility ● Mortality
  • 3.
    The ratio of births to population of a given area  It is measured by:  CRUDE BIRTH RATE (CBR)  FERTILITY RATE /  TOTAL FERTILITY RATE (TFR)  REPLACEMANT LEVEL FERTILITY (RLF)  CHILD WOMEN RATIO  AGE SPECIFIC FERTILITY RATE
  • 5.
    most common measure of fertility.  Gives an overall picture of the number of births per 1000 population in a year.  The number of births per 1000 people in a population per year  Formula: CBR = total number of births x 1000 total population
  • 6.
     What isthe limitation of the index measurement?
  • 11.
     Itdoes not take into account the age and sex distribution of the population
  • 12.
    It is the average number of children born to a woman during her lifetime  Varies geographically ◦ e.g in 1994: ◦ Sierra Leone, TFR of 6.5 while ◦ UK, TFR of 1.8  Changes with time
  • 19.
    Is the level at which each generation of women has only enough daughters to replace themselves in the population  What is the ideal replacement level? 2.1 0r 2
  • 20.
     Mortality mayprevent a proportion of the female children from reaching their productive years and also, on average, slightly more boys are born than girls
  • 21.
    Find the natural increase if  a. BR = 25/1000 DR = 10/1000  b. BR = 5/1000 DR = 10/1000  c. BR = 10/1000 DR = 10/1000
  • 22.
    High fertilty rates ( 4.0 & above)  Medium fertility rates (2.2 – 3.9)  Low fertility rate: (2.1 & below)
  • 23.
    a. Infant andchild mortality b. Population momentum c. Views towards children d. Status for women e. Cultural factors f. Religion factors g. Political factors
  • 24.
     Isthe ratioof deaths to the population of a given area
  • 25.
    CRUDE DEATH RATE (CDR)  INFANT MORTALITY RATE (IMR)  LIFE EXPECTANCY  MATERNAL MORTALITY RATE (MMR)  AGE SPECIFIC DEATH RATE (ASDR)
  • 26.
    The number of deaths per 1000 population in a year  Formula :  CDR = total number of deaths x1000 total population
  • 32.
     Yes!!!  Itshowswhether there is improvement in health system or not.  If the CDR is low meaning there is improvement in health and if there is no improvement, CDR will be high
  • 33.
    It is a measure of the number of deaths of infants before the age of one per 1000 live births in a year
  • 34.
    Children respond easily to the state of their mother’s health and the state of pre and ante-natal services
  • 37.
    The average number of years a person is expected to live  When mortality declines, life expectancy will increase
  • 38.
    Ageing population  Accessibility to amenities  Government commitment to improve health care  Living environment  Colonial past influence in LEDCs  Education among mothers and adults  Aids epidemic
  • 39.
    Population growth is even slower in developed countries  Stabilising birth rates & increasing death rates have already led to natural population decrease in Italy & Germany  Japan & Spain are  expected to  follow soon
  • 40.
     Lack ofclean water  Lack of food  Poor hygiene and sanitation  Overcrowding  Contagious diseases such as diarrhea and respiratory infections  Poverty  The occurrence of war
  • 41.
     Clean wateris readily available  Reliable food supply  Good hygiene and sanitation  Lower population densities  Better vaccinations and health care  Rising standards of living
  • 42.
    Highest death rates are found in LEDCs esp. Sub-Saharan Africa.  Mali, Gambia, Sierra Leone, Uganda, Zambi a – DR of 20/1000
  • 44.
    Up to 600 women die for every 100000 children born  Pakistan – high DR among females, due to malnourished & limited access to health care
  • 45.
     In1990s –DR increased in Russia, Belarus, B ulgaria, Estonia, L atvia, Romania, U kraine, Moldova
  • 46.
     Increase Cardiovasculardisease  Accidents  Suicides  Murders  Stress  Substance abuse (smoking & drinking)  All these linked to increased unemployment, and worsening living condition
  • 47.
     The greaterthe proportion of population in the old age (65+), the higher the death rate for the population as a whole
  • 51.
     Mr. Henry Allingham was born on June 6, 1896 and is now 112.
  • 52.
    Of the 40,399 centenarians, 87 percent are women, the Health and Welfare Ministry said.  Japan's centenarian numbers rank it second in the world behind the United States, which now has more than 96,000, according to U.S. Census Bureau estimates. But the U.S. population is more than double that of Japan.
  • 53.
     By2066, there are predicted to be over half a million people aged over 100
  • 54.
    Increase in the dependency ratio. This means that there will be more people claiming benefits such as state pensions and less people working and paying income taxes  Increased government spending on health care and pensions  Those in work will have to pay higher taxes. This could create disincentives to work and for firms to invest, therefore there could be a fall in productivity growth.  Shortage of workers. This shortage of workers could push up wages causing wage inflation. Alternatively, firms may have to respond by encouraging more people to enter the workforce, through offering flexible working practices.
  • 55.
    Increase participation rate,  Raise the retirement age  Increase the importance of the private sector in providing pensions and health care. However this may cause increased inequality