The document discusses the measurement of morbidity, detailing various metrics such as incidence rates, prevalence rates, and disability rates, which are essential for understanding illness and disease in populations. It explains terms like health-adjusted life expectancy (HALE), quality-adjusted life years (QALY), and disability-adjusted life years (DALY), focusing on their definitions, calculations, and applications in assessing health outcomes. Additionally, it covers reproductive morbidity, which includes conditions related to pregnancy, childbirth, and contraceptive practices.
Measures Of Morbidity
-Ravi Prakash Verma
M.A. /M.Sc. 1st year
kriparavi@yahoo.com
International Institute for Population Sciences, Mumbai.
2.
The study ofMorbidity deals with the investigation of illness, sickness, ill-health or
disease in a population .
-Multilingual Demographic Dictionary
Morbidity is a extent of illness (disease), injury, or disability in a defined population.
-J. B. Stallman
Morbidity
3.
Measures of Morbidity
TheWHO expert committee on Health Statistics noted in its 6th report that
morbidity could be measured in terms of three units:
a) Person who were ill.
b) The illness (Periods /spells/illness) that diseased person experience.
c) The duration of these illness .
Source –WHO(1959)
4.
Illness Exist ina given Time Period as follows;
Illness beginning during the period and ending during the period.
Illness beginning during the period and still existing at the end of the period
Illnesses existing before the beginning of the period and ending during the period
Illnesses existing before the beginning of the period and existing at the end of the period (Prakasam
2017)
Illness :Time Period
5.
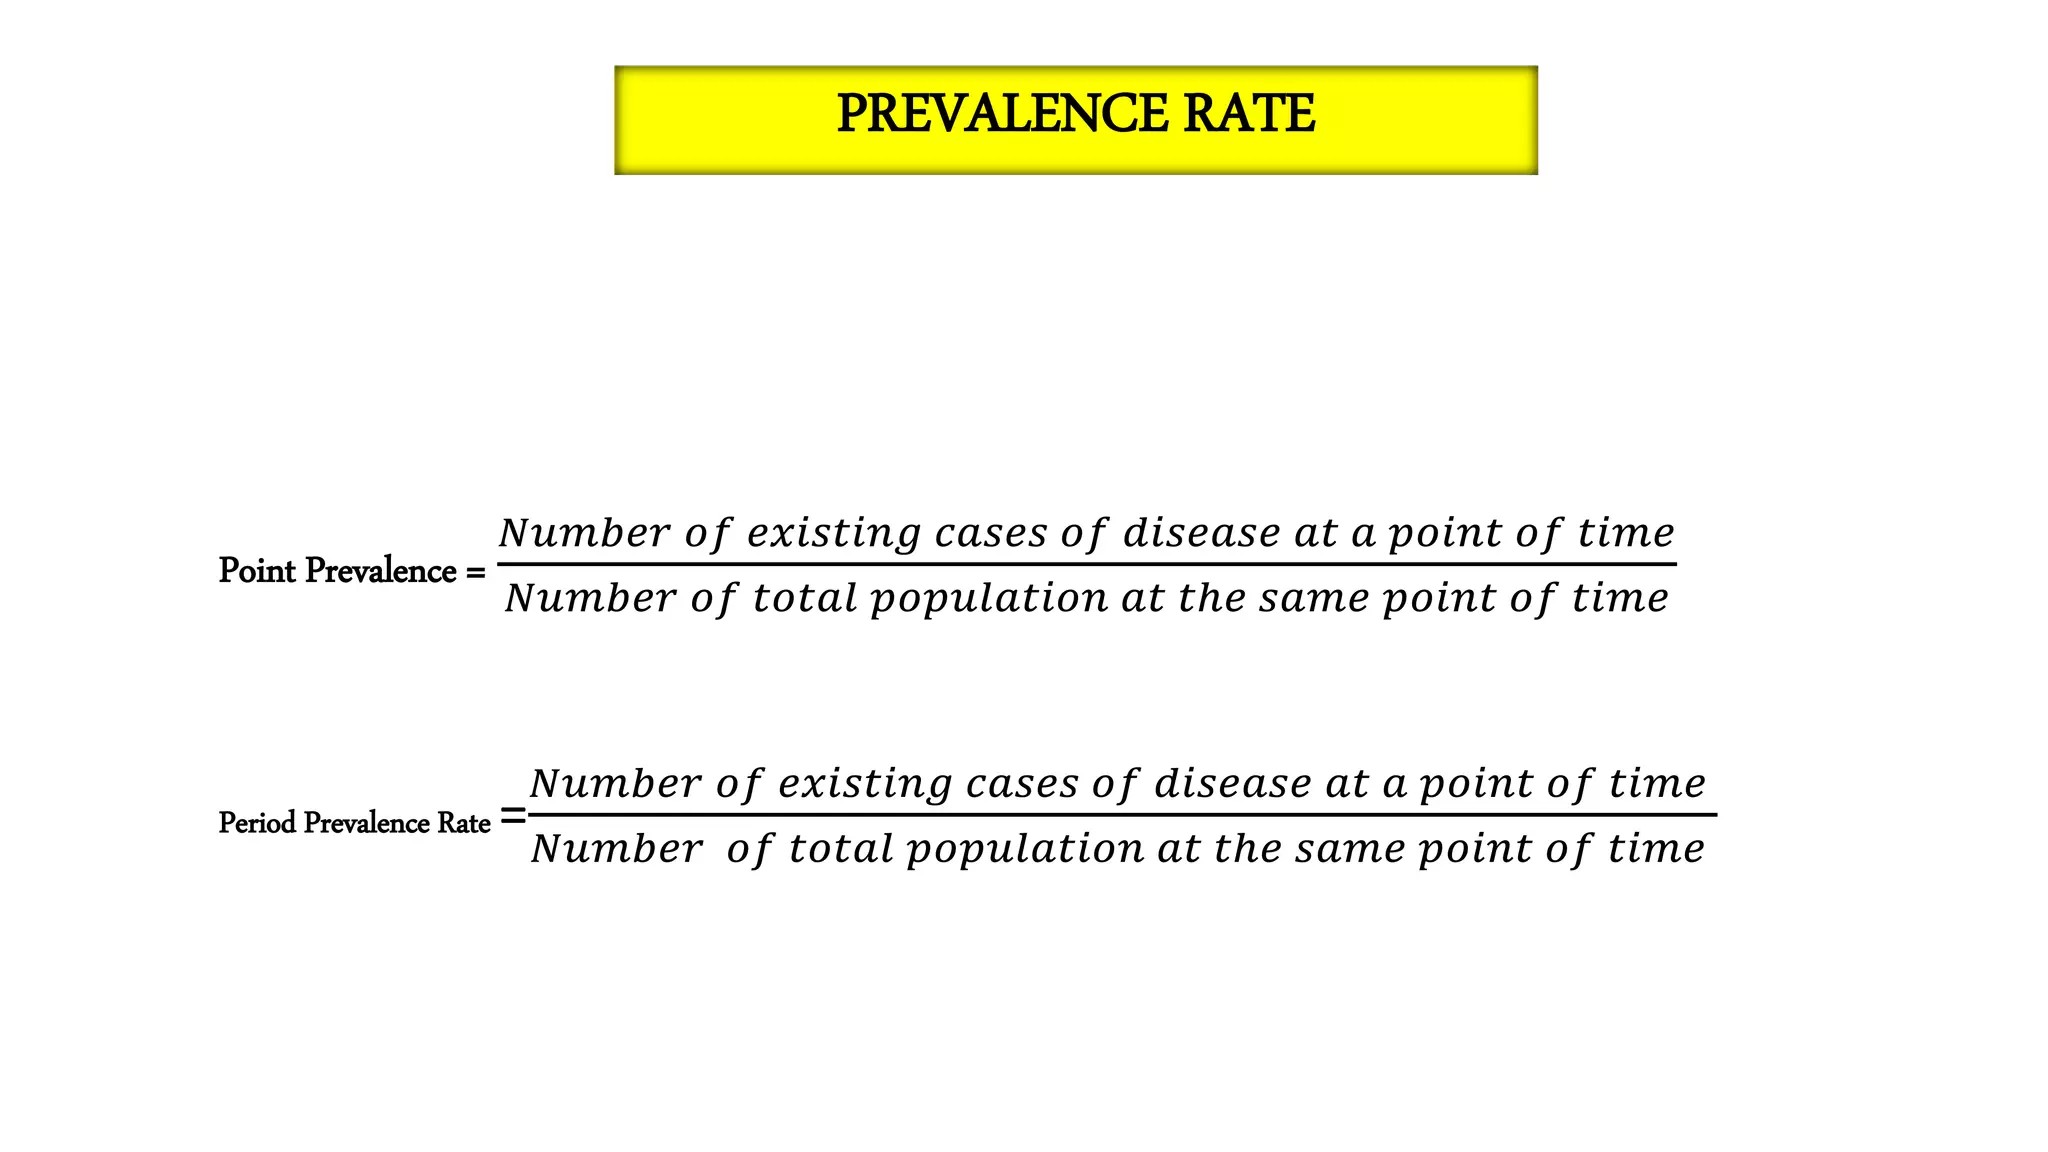
Disease , Illnessor Sickness is measured by calculating;
Incidence Rate
Prevalence Rate: Period Prevalence Rate, Point Prevalence Rate
Attack Rate , Secondary Attack Rate
Case Fatality Rate
Duration Of illness / Sickness
Relative Risk , Attributable Risk and Odds Ratio
Other measures:
o Disability Rate
o HALE
o QALY
o DFLE
o DALY
Measures:
6.
Incidence Rate isgiven by the following equation:
Number of new cases of specific,
Incidence rate (IR) =
𝑵𝒖𝒎𝒃𝒆𝒓 𝒐𝒇 𝒏𝒆𝒘 𝒄𝒂𝒔𝒆𝒔 𝒐𝒇 𝒔𝒑𝒆𝒄𝒊𝒇𝒊𝒄 𝑫𝒊𝒔𝒆𝒂𝒔𝒆 𝒅𝒖𝒓𝒊𝒏𝒈 𝒂 𝒈𝒊𝒗𝒆𝒏 𝒕𝒊𝒎𝒆 𝒑𝒆𝒓𝒊𝒐𝒅
𝑷𝒐𝒑𝒖𝒍𝒂𝒕𝒊𝒐𝒏 𝒂𝒕 𝒓𝒊𝒔𝒌 𝒅𝒖𝒓𝒊𝒏𝒈 𝒕𝒉𝒂𝒕 𝒑𝒆𝒓𝒊𝒐𝒅
× 𝟏𝟎𝟎𝟎
This measure is also discussed in the module on concepts of health.
INCIDENT RATE
Case 1
Case 2Case 3
Case 4
Case 5
Case 6
Case 7
Case 8
start of illness
duration of illness
Jan 1 Dec 31
Incidence would be –
Point prevalence (Jan 1) –
Point prevalence (Dec 31) –
Period prevalence (Jan-Dec) –
cases 3, 4, 5 and 8
cases 1, 2, 7
cases 1, 3, 5 and 8
cases 1, 2, 3, 4, 5, 7, 8
9.
𝑷
(𝟏−𝑷)
=I× 𝑫
Where,
P =Proportion of total population with the disease and I is Incidence rate
1-P = Proportion of the total population without the disease
In situations where the number of persons with the disease in a population and without the disease are stable, then it
is referred to as a steady-state population. In such situations, the point prevalence of the disease (prevalence of the
disease at a particular point of time) is approximately equal to the incidence rate X the average duration of the disease.
P=I× 𝑫
Relationship between Prevalence and Incident
10.
The attack ratethe number of new cases of a particular disease during a particular time interval, to the total
population at risk of that particular disease in the same period of time, multiplied by 100. It is given by the equation:
Attack rate=
𝑵𝒖𝒎𝒃𝒆𝒓 𝒐𝒇 𝒏𝒆𝒘 𝒄𝒂𝒔𝒆𝒔 𝒐𝒇 𝒔𝒑𝒆𝒄𝒊𝒇𝒊𝒆𝒅 𝒅𝒊𝒔𝒆𝒂𝒔𝒆 𝒅𝒖𝒓𝒊𝒏𝒈 𝒊𝒕𝒔 𝒔𝒑𝒆𝒄𝒊𝒇𝒊𝒆𝒅 𝒕𝒊𝒎𝒆 𝒊𝒏𝒕𝒆𝒓𝒗𝒂𝒍
𝑻𝒐𝒕𝒂𝒍 𝑷𝒐𝒑𝒖𝒍𝒂𝒕𝒊𝒐𝒏 𝒂𝒕 𝒓𝒊𝒔𝒌 𝒅𝒖𝒓𝒊𝒏𝒈 𝒕𝒉𝒆 𝒔𝒂𝒎𝒆 𝒊𝒏𝒕𝒆𝒓𝒗𝒂𝒍
× 𝟏𝟎𝟎
ATTACK RATE
11.
The number ofexposed persons developing the disease within the range of the incubation period, following
exposure to the primary case” (GOI 2015).
The attack rate is based on spells of the disease rather than persons. It is generally used for infections of short
period of time as during an epidemic. It usually measures the spread of the infection after exposure to an initial
case (Indrayan N.D.).
The secondary attack rate is the number of exposed persons developing the disease within the range of the
incubation period to the total number of exposed to susceptible contact, multiplied by 100.
Secondary Attack Rate =
𝑵𝒖𝒎𝒃𝒆𝒓 𝒐𝒇 𝒆𝒙𝒑𝒐𝒔𝒆𝒅 𝒑𝒆𝒓𝒔𝒐𝒏𝒔 𝒅𝒆𝒗𝒍𝒐𝒑𝒊𝒏𝒈 𝒕𝒉𝒆 𝒅𝒊𝒔𝒆𝒂𝒔𝒆 𝒘𝒊𝒕𝒉𝒊𝒏 𝒕𝒉𝒆 𝒓𝒂𝒏𝒈𝒆 𝒐𝒇 𝒕𝒉𝒆 𝒊𝒏𝒄𝒖𝒃𝒂𝒕𝒊𝒐𝒏 𝒑𝒆𝒓𝒊𝒐𝒅
𝑻𝒐𝒕𝒂𝒍 𝑵𝒖𝒎𝒃𝒆𝒓 𝒐𝒇 𝒆𝒙𝒑𝒐𝒔𝒆𝒅 𝒔𝒖𝒔𝒄𝒆𝒑𝒕𝒊𝒃𝒍𝒆 𝒄𝒐𝒏𝒕𝒂𝒄𝒕
×100
Secondary Attack Rate
12.
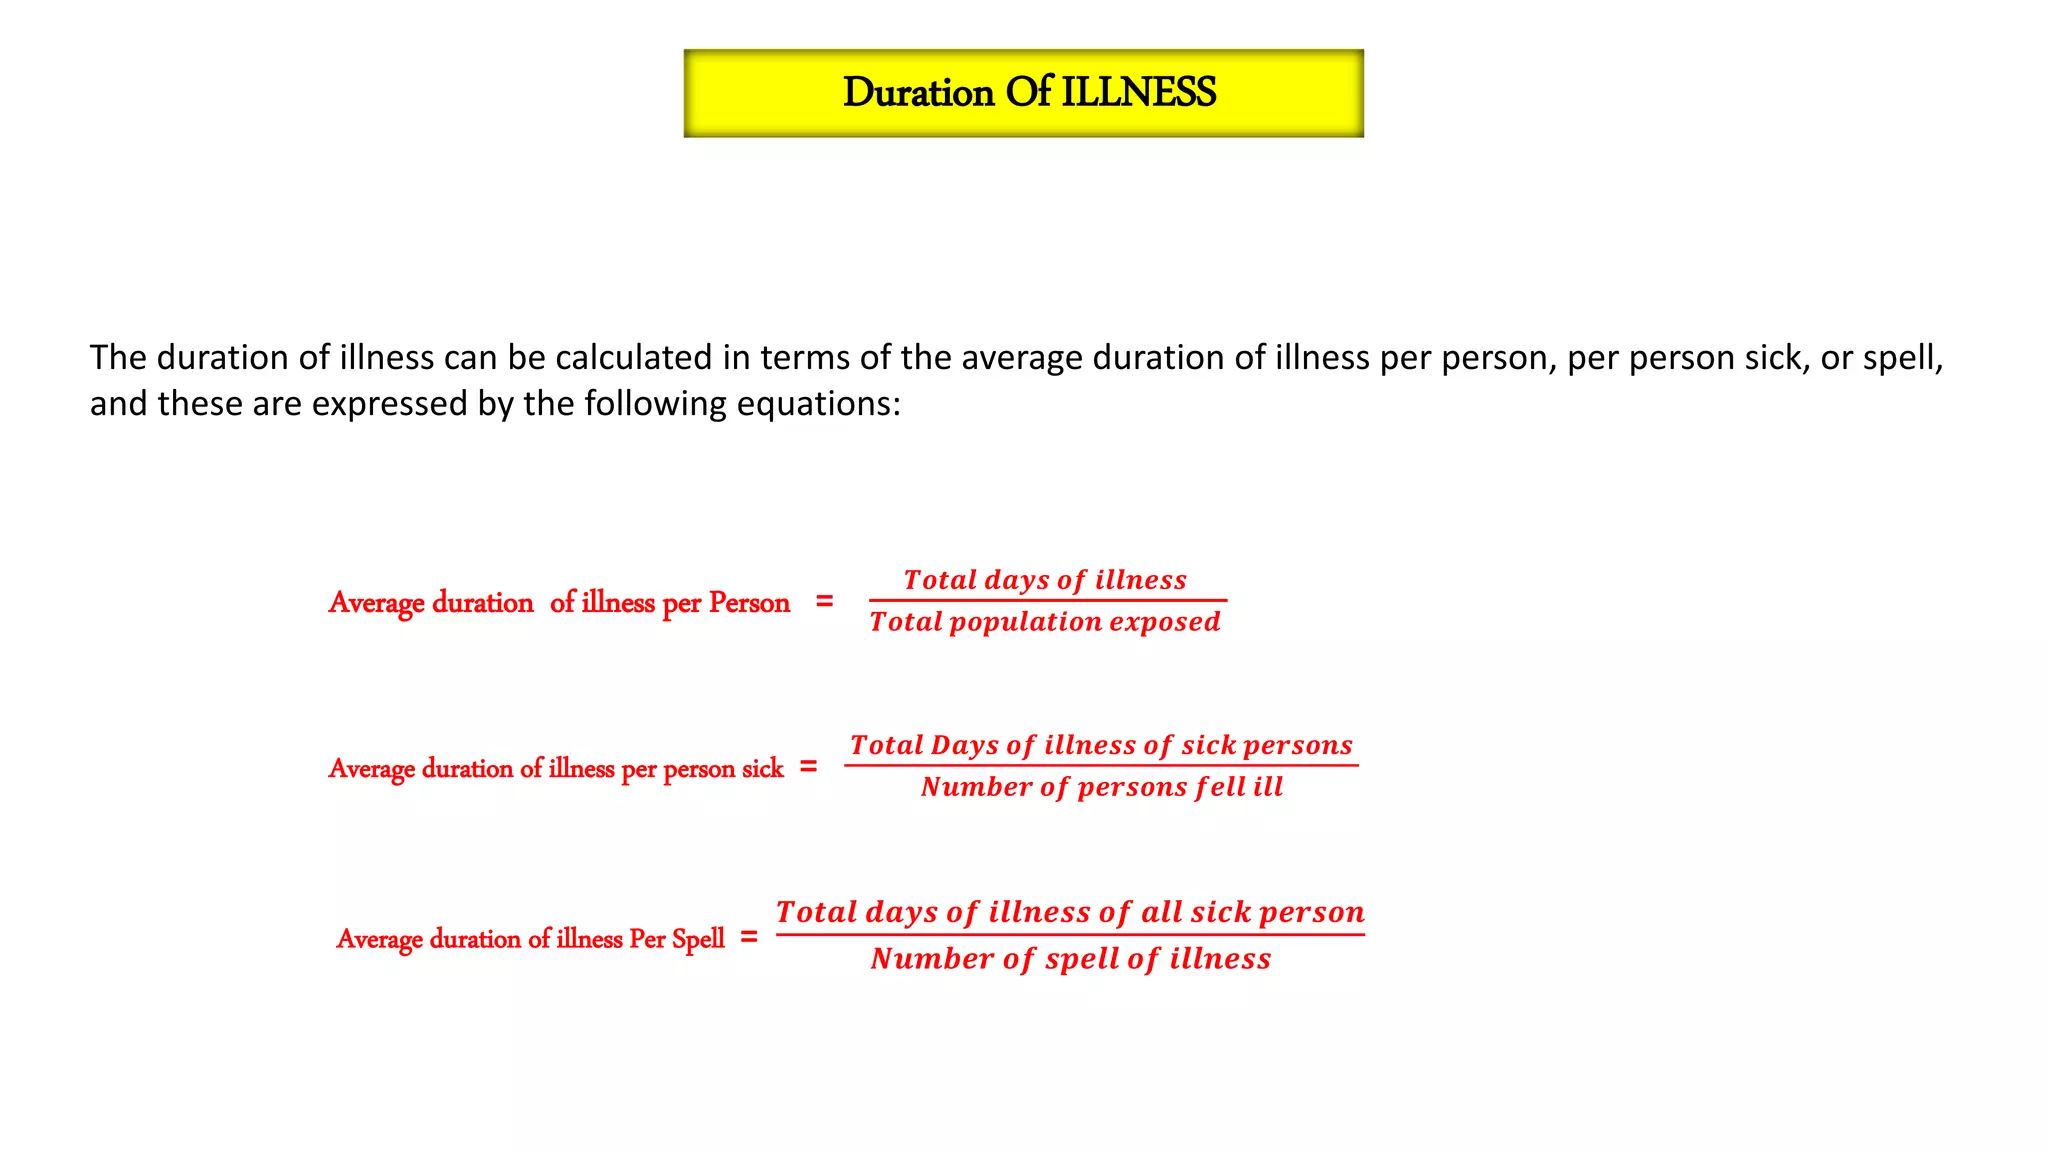
The duration ofillness can be calculated in terms of the average duration of illness per person, per person sick, or spell,
and these are expressed by the following equations:
Average duration of illness per Person =
𝑻𝒐𝒕𝒂𝒍 𝒅𝒂𝒚𝒔 𝒐𝒇 𝒊𝒍𝒍𝒏𝒆𝒔𝒔
𝑻𝒐𝒕𝒂𝒍 𝒑𝒐𝒑𝒖𝒍𝒂𝒕𝒊𝒐𝒏 𝒆𝒙𝒑𝒐𝒔𝒆𝒅
Average duration of illness per person sick =
𝑻𝒐𝒕𝒂𝒍 𝑫𝒂𝒚𝒔 𝒐𝒇 𝒊𝒍𝒍𝒏𝒆𝒔𝒔 𝒐𝒇 𝒔𝒊𝒄𝒌 𝒑𝒆𝒓𝒔𝒐𝒏𝒔
𝑵𝒖𝒎𝒃𝒆𝒓 𝒐𝒇 𝒑𝒆𝒓𝒔𝒐𝒏𝒔 𝒇𝒆𝒍𝒍 𝒊𝒍𝒍
Average duration of illness Per Spell =
𝑻𝒐𝒕𝒂𝒍 𝒅𝒂𝒚𝒔 𝒐𝒇 𝒊𝒍𝒍𝒏𝒆𝒔𝒔 𝒐𝒇 𝒂𝒍𝒍 𝒔𝒊𝒄𝒌 𝒑𝒆𝒓𝒔𝒐𝒏
𝑵𝒖𝒎𝒃𝒆𝒓 𝒐𝒇 𝒔𝒑𝒆𝒍𝒍 𝒐𝒇 𝒊𝒍𝒍𝒏𝒆𝒔𝒔
Duration Of ILLNESS
13.
RR =
𝐼𝑛𝑐𝑖𝑑𝑒𝑛𝑐𝑒 𝑜𝑓𝑑𝑖𝑠𝑒𝑎𝑠𝑒 (𝑜𝑟 𝑑𝑒𝑎𝑡ℎ) 𝑎𝑚𝑜𝑛𝑔 𝑒𝑥𝑝𝑜𝑠𝑒𝑑
𝐼𝑛𝑐𝑖𝑑𝑒𝑛𝑐𝑒 𝑜𝑓 𝑑𝑖𝑠𝑒𝑎𝑠𝑒 (𝑜𝑟 𝑑𝑒𝑎𝑡ℎ) 𝑎𝑚𝑜𝑛𝑔 𝑛𝑜𝑛−𝑒𝑥𝑝𝑜𝑠𝑒𝑑
An example of using the Relative Risk, is with a measure of the association between Cancer and smoking. It is given in
the table below, wherein those who smoke cigarettes are compared with those who do not smoke cigarettes, in
relation to having developed cancer,
Relative Risk of those who smoke to get cancer= (a/a+b)
= Those who smoke who developed cancer/ the total persons who smoke
= 80/4000 x 1000= 2.0
Relative Risk of those who do not smoke to get cancer= (c/c + d )
= Those who do not smoke who developed cancer/ the total number of persons who do not smoke
. =6/5000 x 1000= 1.2
Relative Risk (cigarette smoking causes cancer) = (a/a+b) / (c/c + d) = 2.0/1.2 = 1.67
Cigarette Smoking Developed Cancer Not Cancer Total
Yes 80(a) 3200(b) 4000( a+b )
NO 6(c) 4994(d) 5000( c+d )
Relative Risk
14.
Relative risk(RR) is a ratio. It directly measures the strength
of association between the studied cause and the effect .
If the RR ratio is more than 1, then it suggests a “positive”
association.
15.
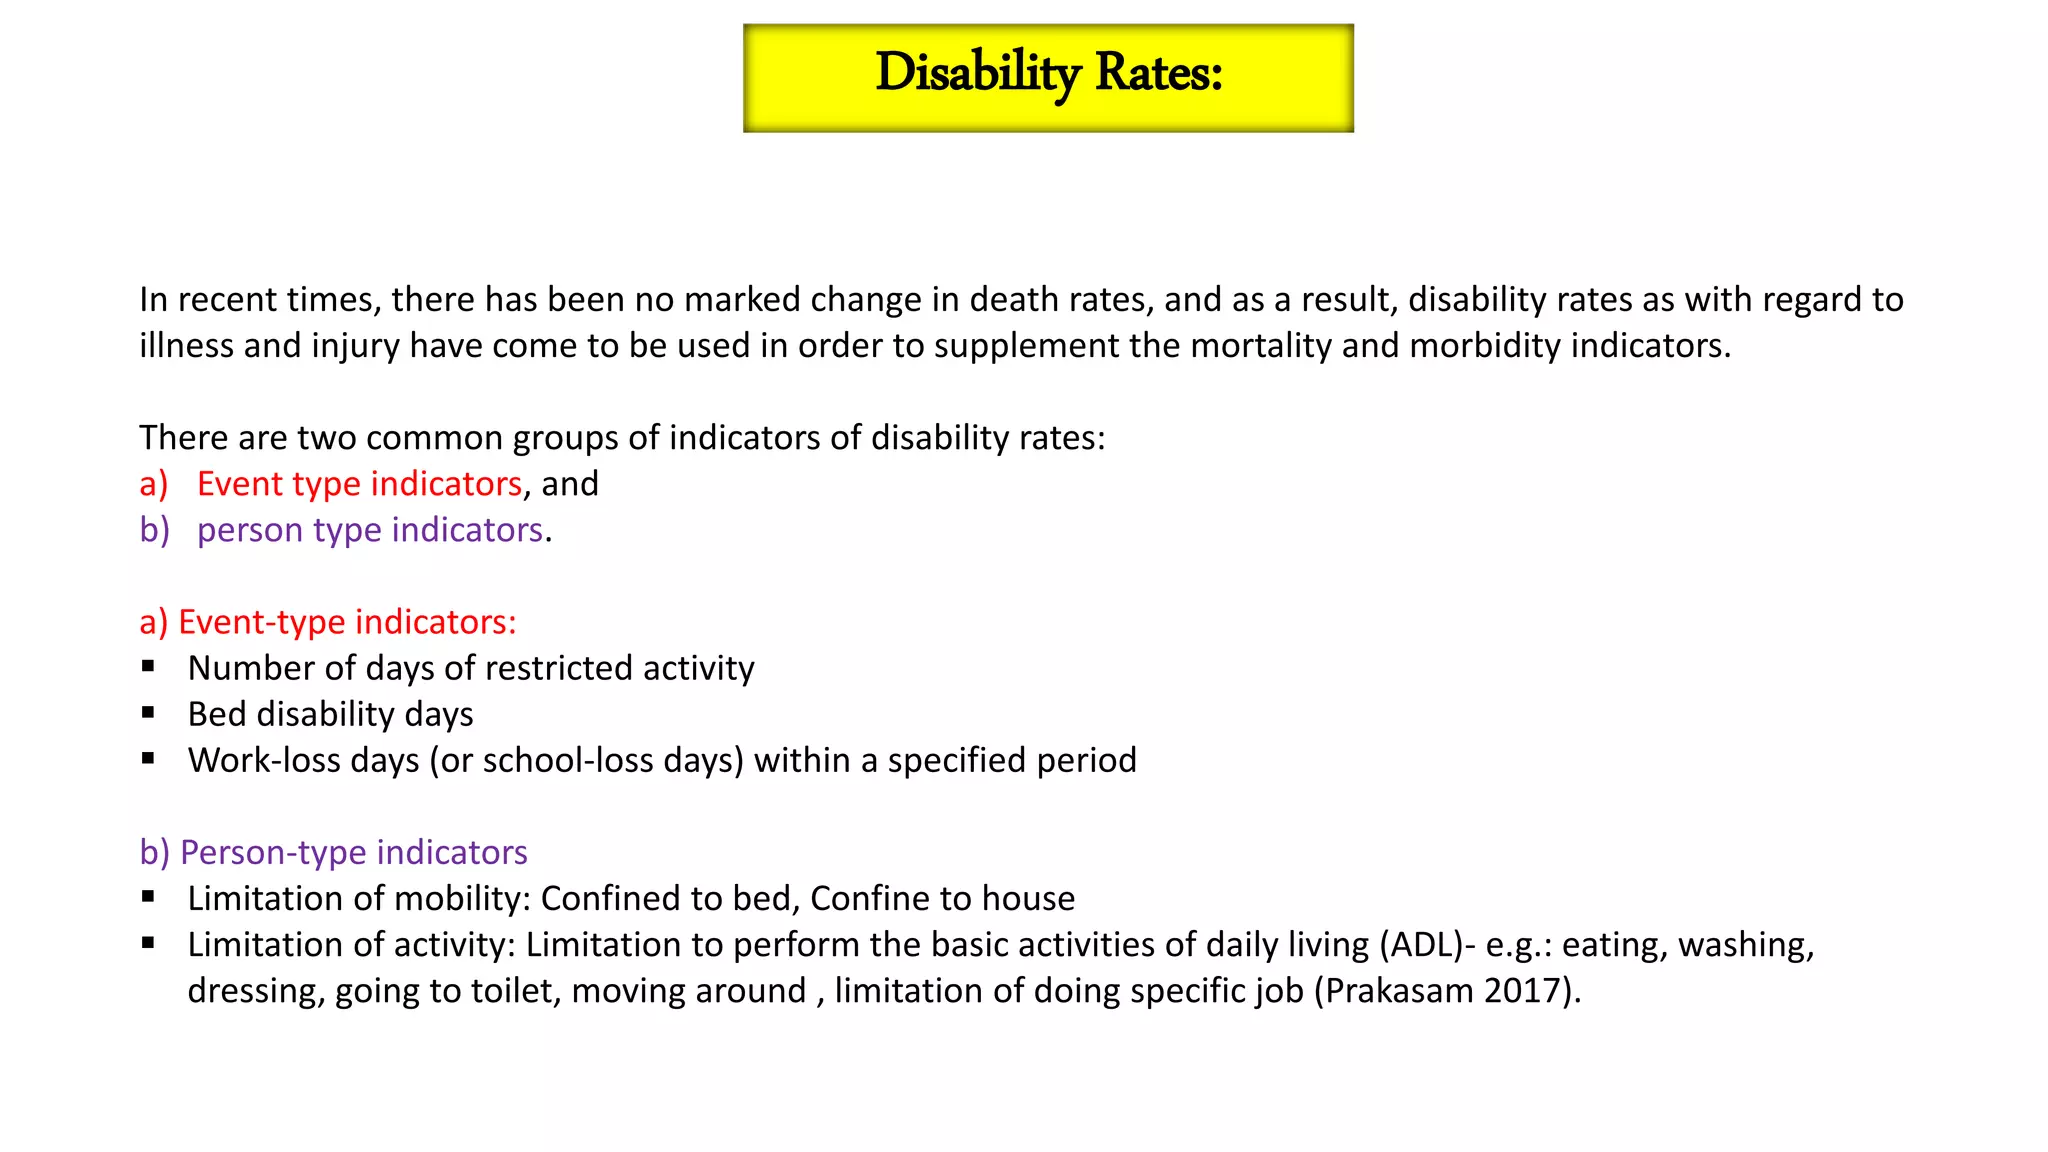
In recent times,there has been no marked change in death rates, and as a result, disability rates as with regard to
illness and injury have come to be used in order to supplement the mortality and morbidity indicators.
There are two common groups of indicators of disability rates:
a) Event type indicators, and
b) person type indicators.
a) Event-type indicators:
Number of days of restricted activity
Bed disability days
Work-loss days (or school-loss days) within a specified period
b) Person-type indicators
Limitation of mobility: Confined to bed, Confine to house
Limitation of activity: Limitation to perform the basic activities of daily living (ADL)- e.g.: eating, washing,
dressing, going to toilet, moving around , limitation of doing specific job (Prakasam 2017).
Disability Rates:
16.
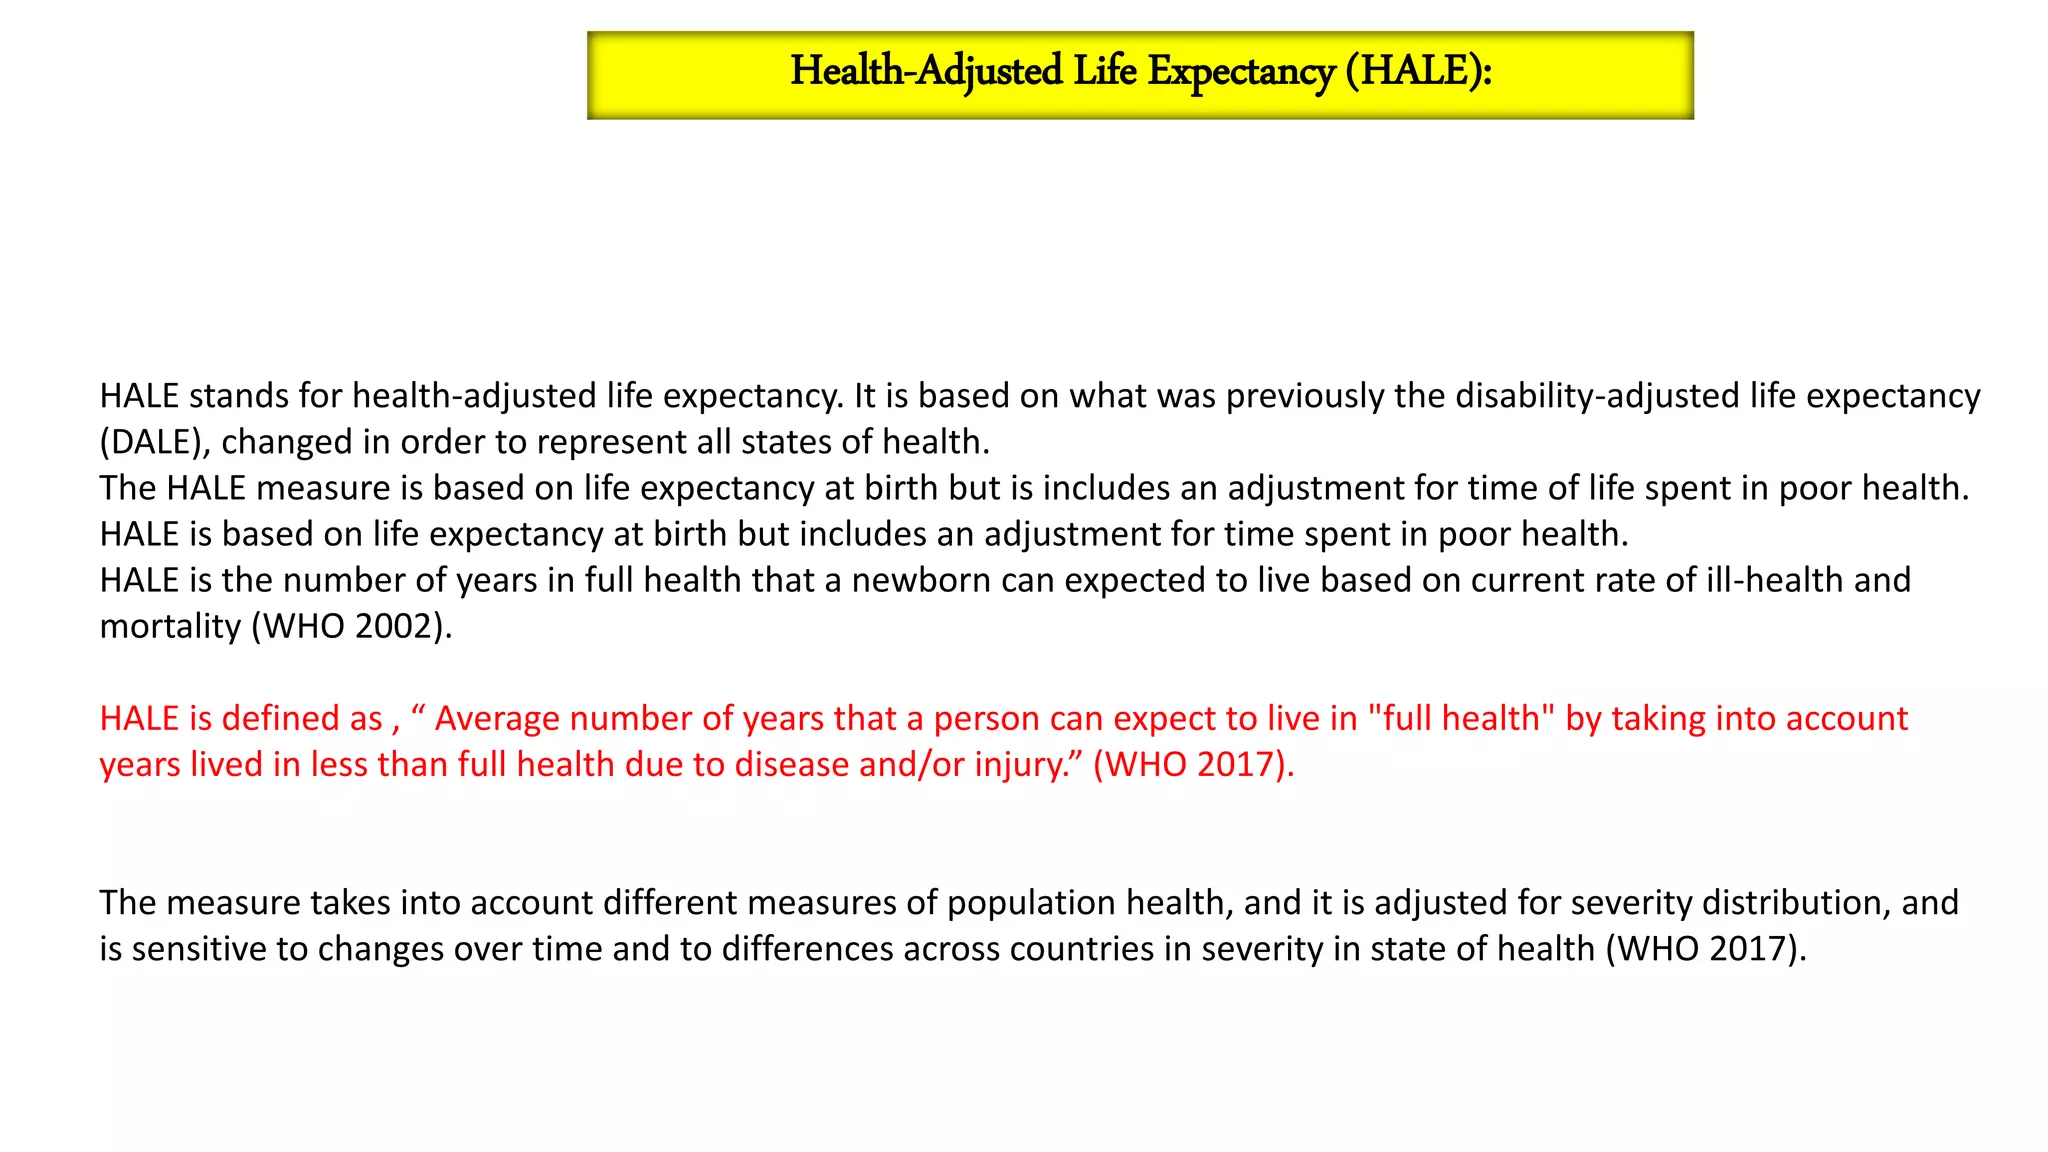
HALE stands forhealth-adjusted life expectancy. It is based on what was previously the disability-adjusted life expectancy
(DALE), changed in order to represent all states of health.
The HALE measure is based on life expectancy at birth but is includes an adjustment for time of life spent in poor health.
HALE is based on life expectancy at birth but includes an adjustment for time spent in poor health.
HALE is the number of years in full health that a newborn can expected to live based on current rate of ill-health and
mortality (WHO 2002).
HALE is defined as , “ Average number of years that a person can expect to live in "full health" by taking into account
years lived in less than full health due to disease and/or injury.” (WHO 2017).
The measure takes into account different measures of population health, and it is adjusted for severity distribution, and
is sensitive to changes over time and to differences across countries in severity in state of health (WHO 2017).
Health-Adjusted Life Expectancy (HALE):
17.
QALY or Quality-adjustedlife years measures the burden of disease including both quantity of live lives as well as
the quality of life lived. It is used to assess a medical intervention in terms of value for money.
QALY is thus based on estimating the “number of years of life that would have been lived with perfect life with the
medical intervention” (Prieto et.al. 2003).
In other words, it can be said to be an indicator that assesses both the quantity and quality of life in the health of
a population. Therefore, an extension of life expectancy can also be measured in terms of whether they are years
of healthy life.
One example is that a person may be taking an intervention to address the problem of hypertension for about 3
decades, which adds a decade more to his life, at a slightly reduced level of quality. He would also need further
intervention, which reduces his quality of life further by a given amount. The QALY would then be calculated to
see how many years in total would be gained – say, around 8 years after adjusting above. There are many other
ways in which QALYs can be applied (uOttawa 2014)
Quality-adjusted life years (QALY):
18.
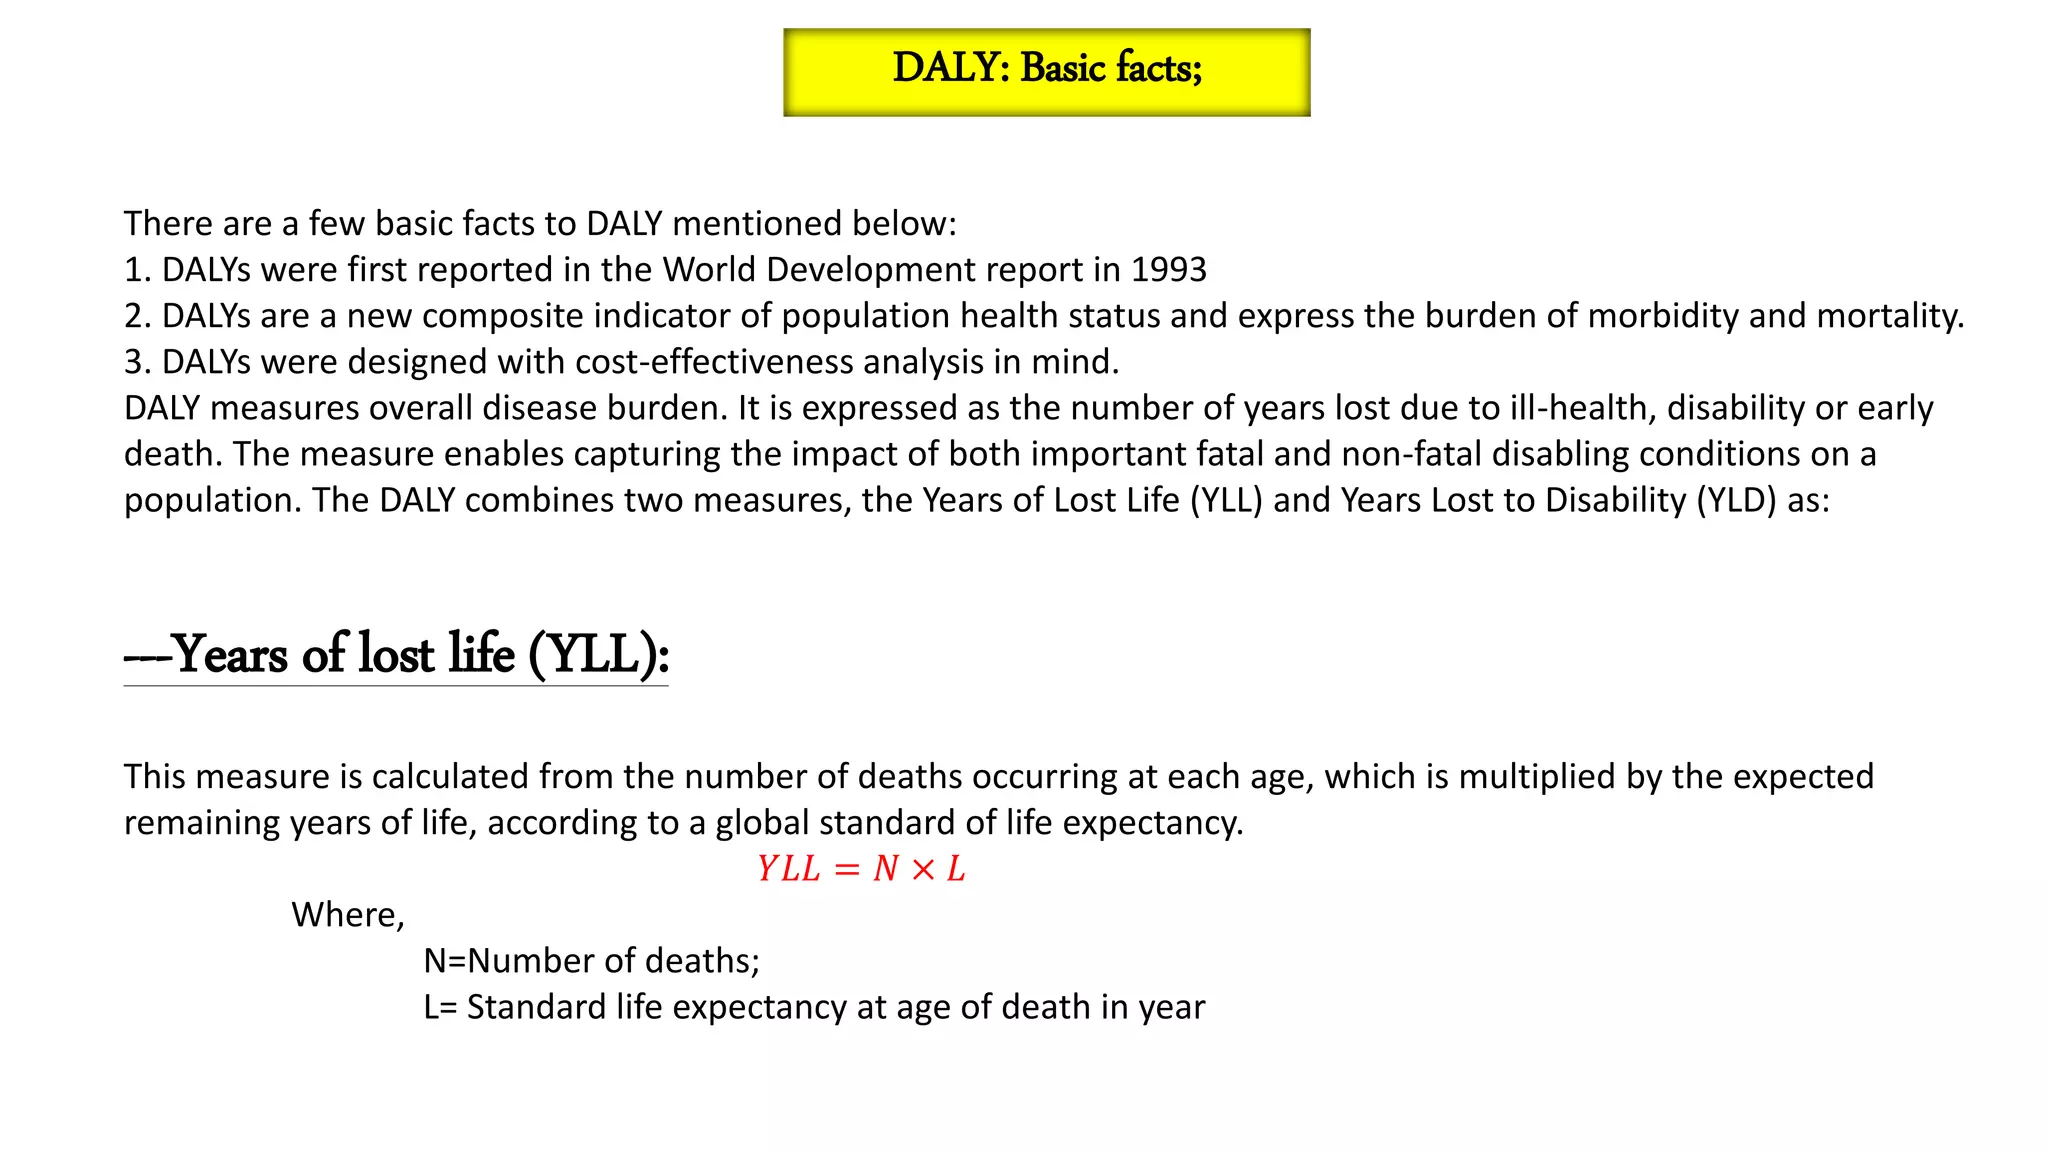
There are afew basic facts to DALY mentioned below:
1. DALYs were first reported in the World Development report in 1993
2. DALYs are a new composite indicator of population health status and express the burden of morbidity and mortality.
3. DALYs were designed with cost-effectiveness analysis in mind.
DALY measures overall disease burden. It is expressed as the number of years lost due to ill-health, disability or early
death. The measure enables capturing the impact of both important fatal and non-fatal disabling conditions on a
population. The DALY combines two measures, the Years of Lost Life (YLL) and Years Lost to Disability (YLD) as:
---Years of lost life (YLL):
This measure is calculated from the number of deaths occurring at each age, which is multiplied by the expected
remaining years of life, according to a global standard of life expectancy.
𝑌𝐿𝐿 = 𝑁 × 𝐿
Where,
N=Number of deaths;
L= Standard life expectancy at age of death in year
DALY: Basic facts;
19.
This measure iscalculated as the number of incident cases of disability due to injury and illness, multiplied by
the average duration of the disease and a weighting factor which reflects disease severity on a scale from 0
(perfect health) to 1 (dead) (Prakasam 2017)
YLD=𝐼 × 𝐷𝑊 × 𝐿.
Where, I= Number of incidence cases
DW = Disability Weight
L= average duration of the case until remission or death (years)
DALY=𝑌𝐿𝐿 + 𝑌𝐿𝐷
---Years lost to disability (YLD):
20.
Disability-free lifeexpectancy (DFLE) is the average number of years an individual is
expected to live free of disability if the current pattern of mortality and disability
continues to apply.
The DFLE indicator has been developed and used in many countries since the 1970s.
The definition is a derivation from statistical sources of organizations as the IMF and
OECD. As per the OECD, can be considered in terms of functional limitation-free life
expectancy, and activity restriction-free life expectancy (OECD 2003).
Disability-free life expectancy (DFLE);
21.
Reproductive Morbidity :
Apartfrom the above rates, in the recent period morbidity related to pregnancy and contraception is measured under
Reproductive morbidity.
Reproductive morbidity:
Reproductive morbidities are morbidities that occur during pregnancy, during childbirth or within a period of 42 days of
giving birth (Prakasam 2017).
WHO (1990) has defined reproductive morbidity broadly as:
“any morbidity or dysfunction of the reproductive tract or any morbidity which is a consequence of reproductive
behavior including pregnancy, abortion, childbirth or sexual behavior. Morbidities may include those of a psychological
nature”
The WHO has spelled reproductive morbidity as consisting of three types of morbidity:
1. Obstetric,
2. Gynecological and
3. contraceptive morbidity.
22.
Obstetric morbidity:
Morbidity ina women who has been pregnant (regardless of the duration of pregnancy) from any cause related to
or aggravated by the pregnancy or its management, but not from accidental or incidental causes.
Gynecological morbidity:
includes any condition, disease or dysfunction of the reproductive system, which is not related to pregnancy,
abortion, or childbirth but may be related to sexual behavior.
Contraceptive Morbidity:
Contraceptive morbidity includes condition, which result from efforts (other than abortion) to limit family size,
whether they are traditional or modern methods” (WHO 1990).