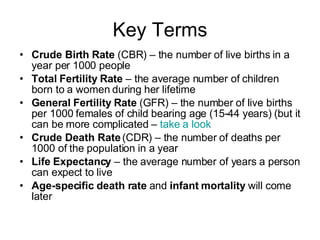
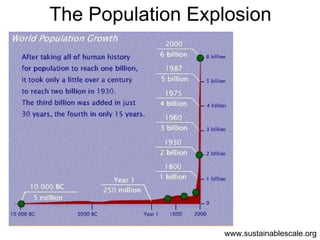
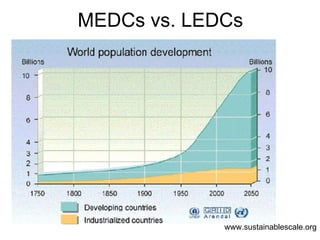
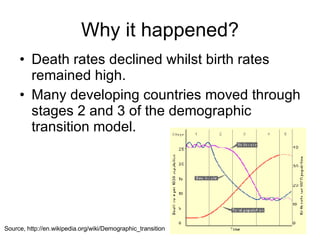
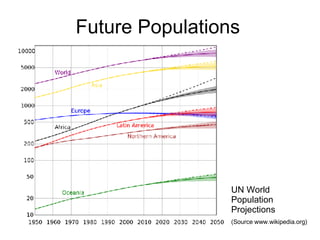
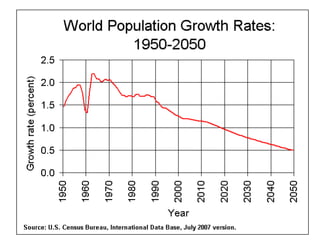
Key Terms Crude Birth Rate  (CBR) – the number of live births in a year per 1000 people Total Fertility Rate  – the average number of children born to a women during her lifetime General Fertility Rate  (GFR) – the number of live births per 1000 females of child bearing age (15-44 years) (but it can be more complicated –  take a look  Crude Death Rate  (CDR) – the number of deaths per 1000 of the population in a year Life Expectancy  – the average number of years a person can expect to live Age-specific death rate  and  infant mortality  will come later
The Population Formula Natural Population Change = CBR – CDR
The Population Explosion www.sustainablescale.org
MEDCs vs. LEDCs www.sustainablescale.org
Why it happened? Death rates declined whilst birth rates remained high. Many developing countries moved through stages 2 and 3 of the demographic transition model. Source, http://en.wikipedia.org/wiki/Demographic_transition
Doubling Times With a 2% growth rate the population doubling time would be 35 years. With 3% it would take 24 years and with 4% only 17 years for a population to double To get the doubling time divide 70 by the %  (Chrispin and Jegede 2000)
Exemplification (Source, Nagle 2005) 23 3.0 Uganda 44 1.6 Indonesia 78 0.9 Brazil 700 0.1 Denmark Doubling Time (years) Growth Rate (%) Country
So What? Today Indonesia’s population is 235m by 2051 it will be 470m Uganda’s population is 30m (2007 est. CIA World Factbook), it will be 60m by 2030
 
Future Populations UN World Population Projections  (Source www.wikipedia.org)
The Slowing of Growth Annual growth is currently 1.2% way below the rates of 2.2% seen 40 years ago. This is largely due to declines in fertility. In 1990 the average women gave birth to 3.3 children, by 2002 this had dropped to 2.6. (Nagle 2005)
 
Development Development can be both a state and a process Development suggests economic progress and social improvement which will affect demographic change Increasingly development is considered in terms of sustainability (sustainable development) (Nagle 2005)
How do we measure development?
Population and Development 80-90% of the population explosion occurred in the developing world Development acts to lower a countries birth rate (Guardian Online 2007) The most developed countries in the world are in crises, their populations are shrinking.  By the Year 3000 the population of Japan will be 500.  By 3500 there will only be 1 person left (McNaught and Witherick 2001)
What demands will population and development changes place on the worlds human and physical resources? What will the implications of these demands be in terms of sustainable development?
Population and Development Issue Ecological footprint data suggests that 3-4 planets would be required to support the current population at the consumption level of North Americans ( www.sustainablescale.org ).
 
Personal Investigation Your enquiry should aim to investigate the relationship between development and one of the key demographic indicators associated with  fertility ,  mortality  and  natural population change .
Follow These Steps Formulate hypothesis Identify the data that you need and collect and collate it.  Now you need to present and process the data.   Finally you need to write a report presenting your findings.
References Websites World Population Growth graph, available from:  http://www.sustainablescale.org/AreasofConcern/Population/PopulationandScale/QuickFacts.aspx  (cited 9th September 2007) World Population Development graph available from:  http://www.sustainablescale.org/AreasofConcern/Population/PopulationandScale/QuickFacts.aspx  (cited 9th September 2007) Total birth world map, available from: WorldMapper.org,  http://www.worldmapper.org/images/largepng/3.png  (cited 11th Sept 2007) Population data on Indonesia and Uganda, available from:  CIA World Factbook,   https://www.cia.gov/library/publications/the-world-factbook/  (cited 9 th  September 2007) Demographic transition model graph available from:  Wikipedia,  Source,  http://en.wikipedia.org/wiki/Demographic_transition  (cited 9th September 2007) World Population Growth Rates graph available from US Census Bureau  http://www.census.gov/ipc/www/idb/worldpopinfo.html  (cited 11th Sept 2007) Ecological footprint comparison data available from:  Sustainablescale.org ,   http://www.sustainablescale.org/AreasofConcern/Population/PopulationandScale/QuickFacts.aspx  (cited 9th September 2007) World Wildlife Fund 2002, Living Planet Report: available from Optimal Population Trust,  http://www.optimumpopulation.org/opt.sustainable.numbers.html  (cited 9th September 2007) Figures on numbers of forced migrants by 2050 available from  http://www.sourceuk.net/article/9/9830/world_facing_migration_crisis.html  (cited 11th Sept. 2007) Books Chrispin, J. and Jegede, F., 2000.  Population, Resources and Development.  London: Harper Collins Publishers Ltd. Gillet, J., 2005  Population.  London: Hodder Murray McNaught, A. and Witherick, M., 2001.  Global Challenge. London: Pearson Education Ltd. Nagle, G., 2005  Development.  London: Hodder Murray Other Anon, 2007, How to deal with a falling population.  The Economist , 28 th  July. Pp.13.

Population 3 Intro To Population Change

  • 1.
    Key Terms CrudeBirth Rate (CBR) – the number of live births in a year per 1000 people Total Fertility Rate – the average number of children born to a women during her lifetime General Fertility Rate (GFR) – the number of live births per 1000 females of child bearing age (15-44 years) (but it can be more complicated – take a look Crude Death Rate (CDR) – the number of deaths per 1000 of the population in a year Life Expectancy – the average number of years a person can expect to live Age-specific death rate and infant mortality will come later
  • 2.
    The Population FormulaNatural Population Change = CBR – CDR
  • 3.
    The Population Explosionwww.sustainablescale.org
  • 4.
    MEDCs vs. LEDCswww.sustainablescale.org
  • 5.
    Why it happened?Death rates declined whilst birth rates remained high. Many developing countries moved through stages 2 and 3 of the demographic transition model. Source, http://en.wikipedia.org/wiki/Demographic_transition
  • 6.
    Doubling Times Witha 2% growth rate the population doubling time would be 35 years. With 3% it would take 24 years and with 4% only 17 years for a population to double To get the doubling time divide 70 by the % (Chrispin and Jegede 2000)
  • 7.
    Exemplification (Source, Nagle2005) 23 3.0 Uganda 44 1.6 Indonesia 78 0.9 Brazil 700 0.1 Denmark Doubling Time (years) Growth Rate (%) Country
  • 8.
    So What? TodayIndonesia’s population is 235m by 2051 it will be 470m Uganda’s population is 30m (2007 est. CIA World Factbook), it will be 60m by 2030
  • 9.
  • 10.
    Future Populations UNWorld Population Projections (Source www.wikipedia.org)
  • 11.
    The Slowing ofGrowth Annual growth is currently 1.2% way below the rates of 2.2% seen 40 years ago. This is largely due to declines in fertility. In 1990 the average women gave birth to 3.3 children, by 2002 this had dropped to 2.6. (Nagle 2005)
  • 12.
  • 13.
    Development Development canbe both a state and a process Development suggests economic progress and social improvement which will affect demographic change Increasingly development is considered in terms of sustainability (sustainable development) (Nagle 2005)
  • 14.
    How do wemeasure development?
  • 15.
    Population and Development80-90% of the population explosion occurred in the developing world Development acts to lower a countries birth rate (Guardian Online 2007) The most developed countries in the world are in crises, their populations are shrinking. By the Year 3000 the population of Japan will be 500. By 3500 there will only be 1 person left (McNaught and Witherick 2001)
  • 16.
    What demands willpopulation and development changes place on the worlds human and physical resources? What will the implications of these demands be in terms of sustainable development?
  • 17.
    Population and DevelopmentIssue Ecological footprint data suggests that 3-4 planets would be required to support the current population at the consumption level of North Americans ( www.sustainablescale.org ).
  • 18.
  • 19.
    Personal Investigation Yourenquiry should aim to investigate the relationship between development and one of the key demographic indicators associated with fertility , mortality and natural population change .
  • 20.
    Follow These StepsFormulate hypothesis Identify the data that you need and collect and collate it. Now you need to present and process the data. Finally you need to write a report presenting your findings.
  • 21.
    References Websites WorldPopulation Growth graph, available from: http://www.sustainablescale.org/AreasofConcern/Population/PopulationandScale/QuickFacts.aspx (cited 9th September 2007) World Population Development graph available from: http://www.sustainablescale.org/AreasofConcern/Population/PopulationandScale/QuickFacts.aspx (cited 9th September 2007) Total birth world map, available from: WorldMapper.org, http://www.worldmapper.org/images/largepng/3.png (cited 11th Sept 2007) Population data on Indonesia and Uganda, available from: CIA World Factbook, https://www.cia.gov/library/publications/the-world-factbook/ (cited 9 th September 2007) Demographic transition model graph available from: Wikipedia, Source, http://en.wikipedia.org/wiki/Demographic_transition (cited 9th September 2007) World Population Growth Rates graph available from US Census Bureau http://www.census.gov/ipc/www/idb/worldpopinfo.html (cited 11th Sept 2007) Ecological footprint comparison data available from: Sustainablescale.org , http://www.sustainablescale.org/AreasofConcern/Population/PopulationandScale/QuickFacts.aspx (cited 9th September 2007) World Wildlife Fund 2002, Living Planet Report: available from Optimal Population Trust, http://www.optimumpopulation.org/opt.sustainable.numbers.html (cited 9th September 2007) Figures on numbers of forced migrants by 2050 available from http://www.sourceuk.net/article/9/9830/world_facing_migration_crisis.html (cited 11th Sept. 2007) Books Chrispin, J. and Jegede, F., 2000. Population, Resources and Development. London: Harper Collins Publishers Ltd. Gillet, J., 2005 Population. London: Hodder Murray McNaught, A. and Witherick, M., 2001. Global Challenge. London: Pearson Education Ltd. Nagle, G., 2005 Development. London: Hodder Murray Other Anon, 2007, How to deal with a falling population. The Economist , 28 th July. Pp.13.