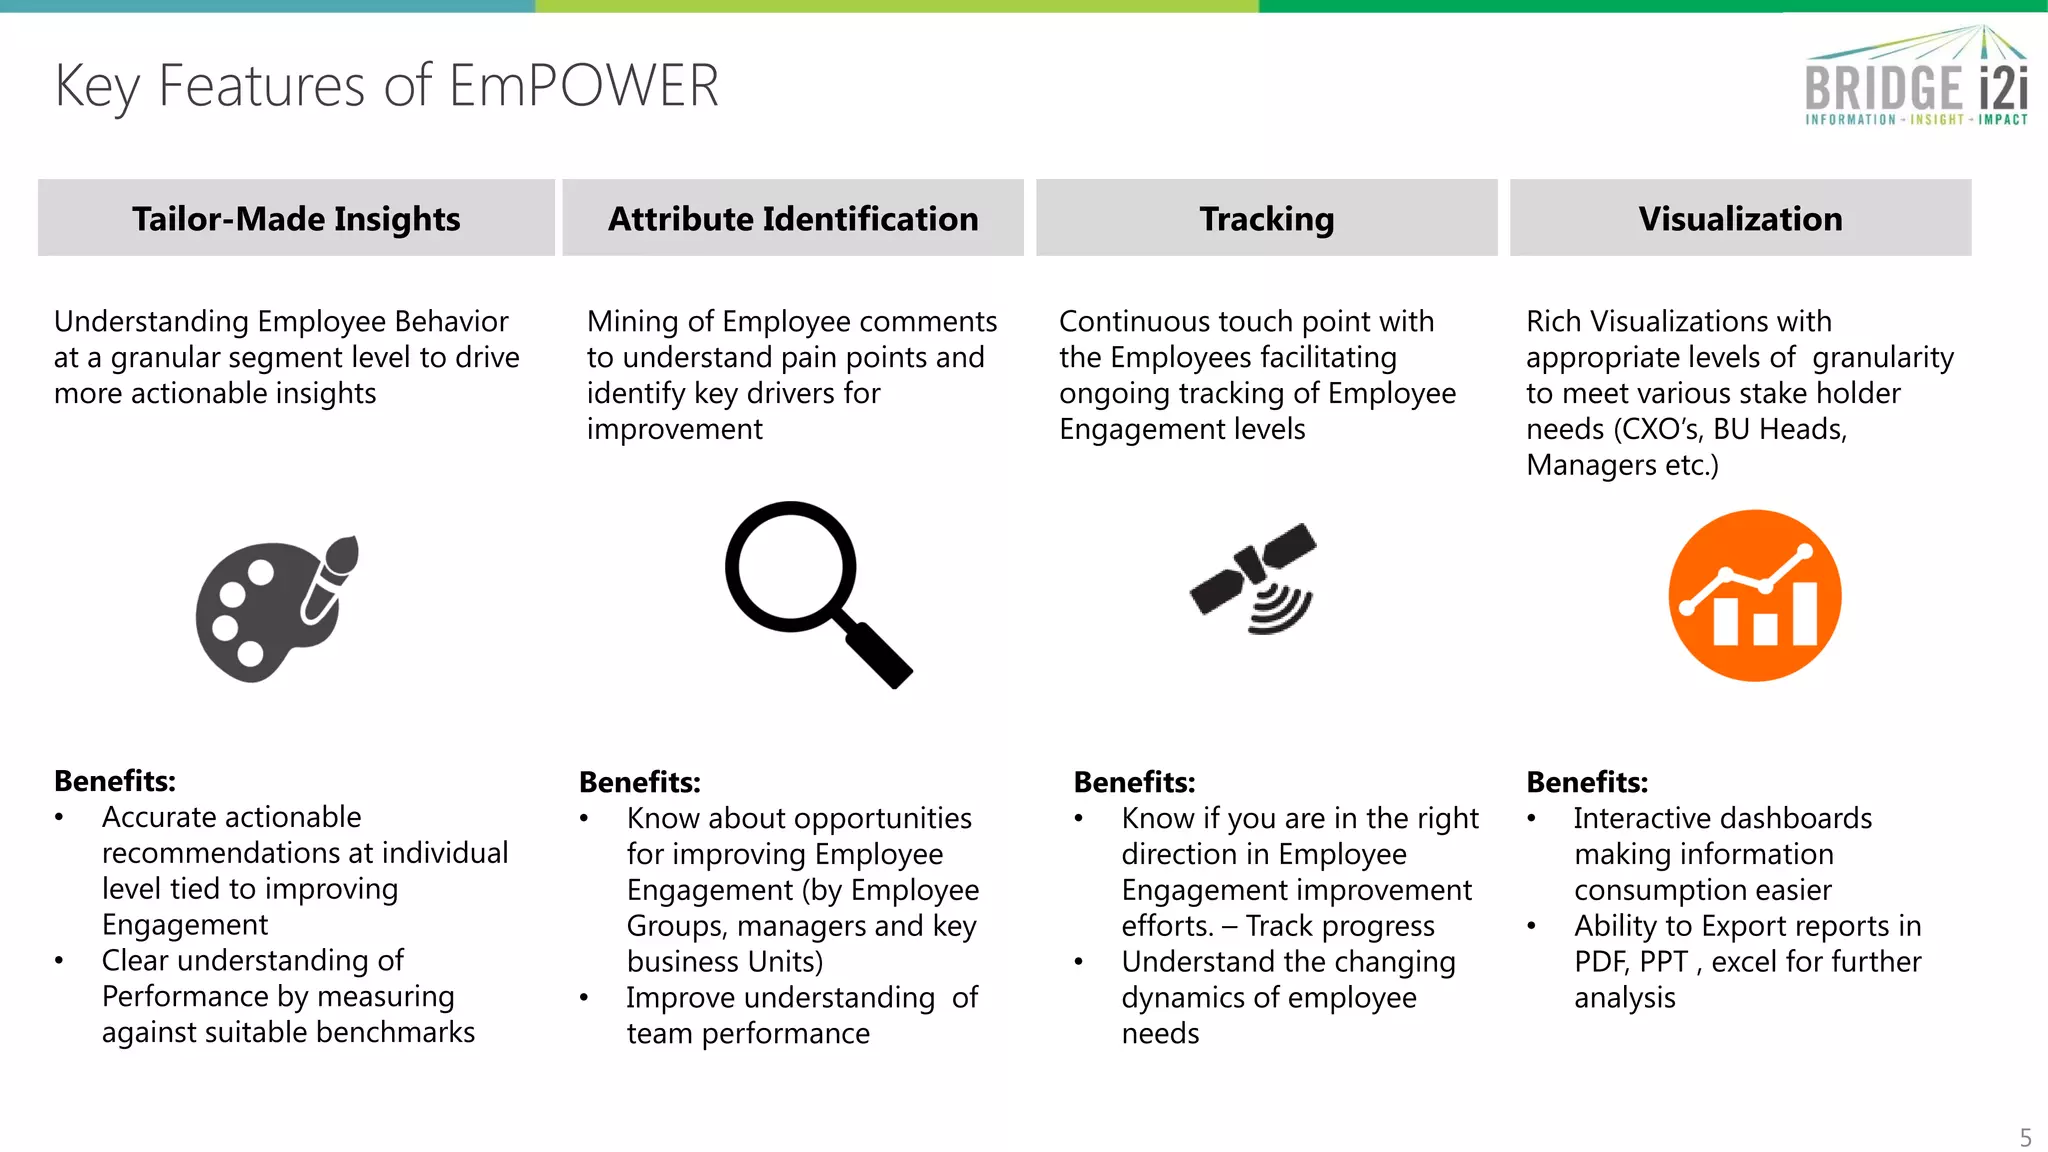
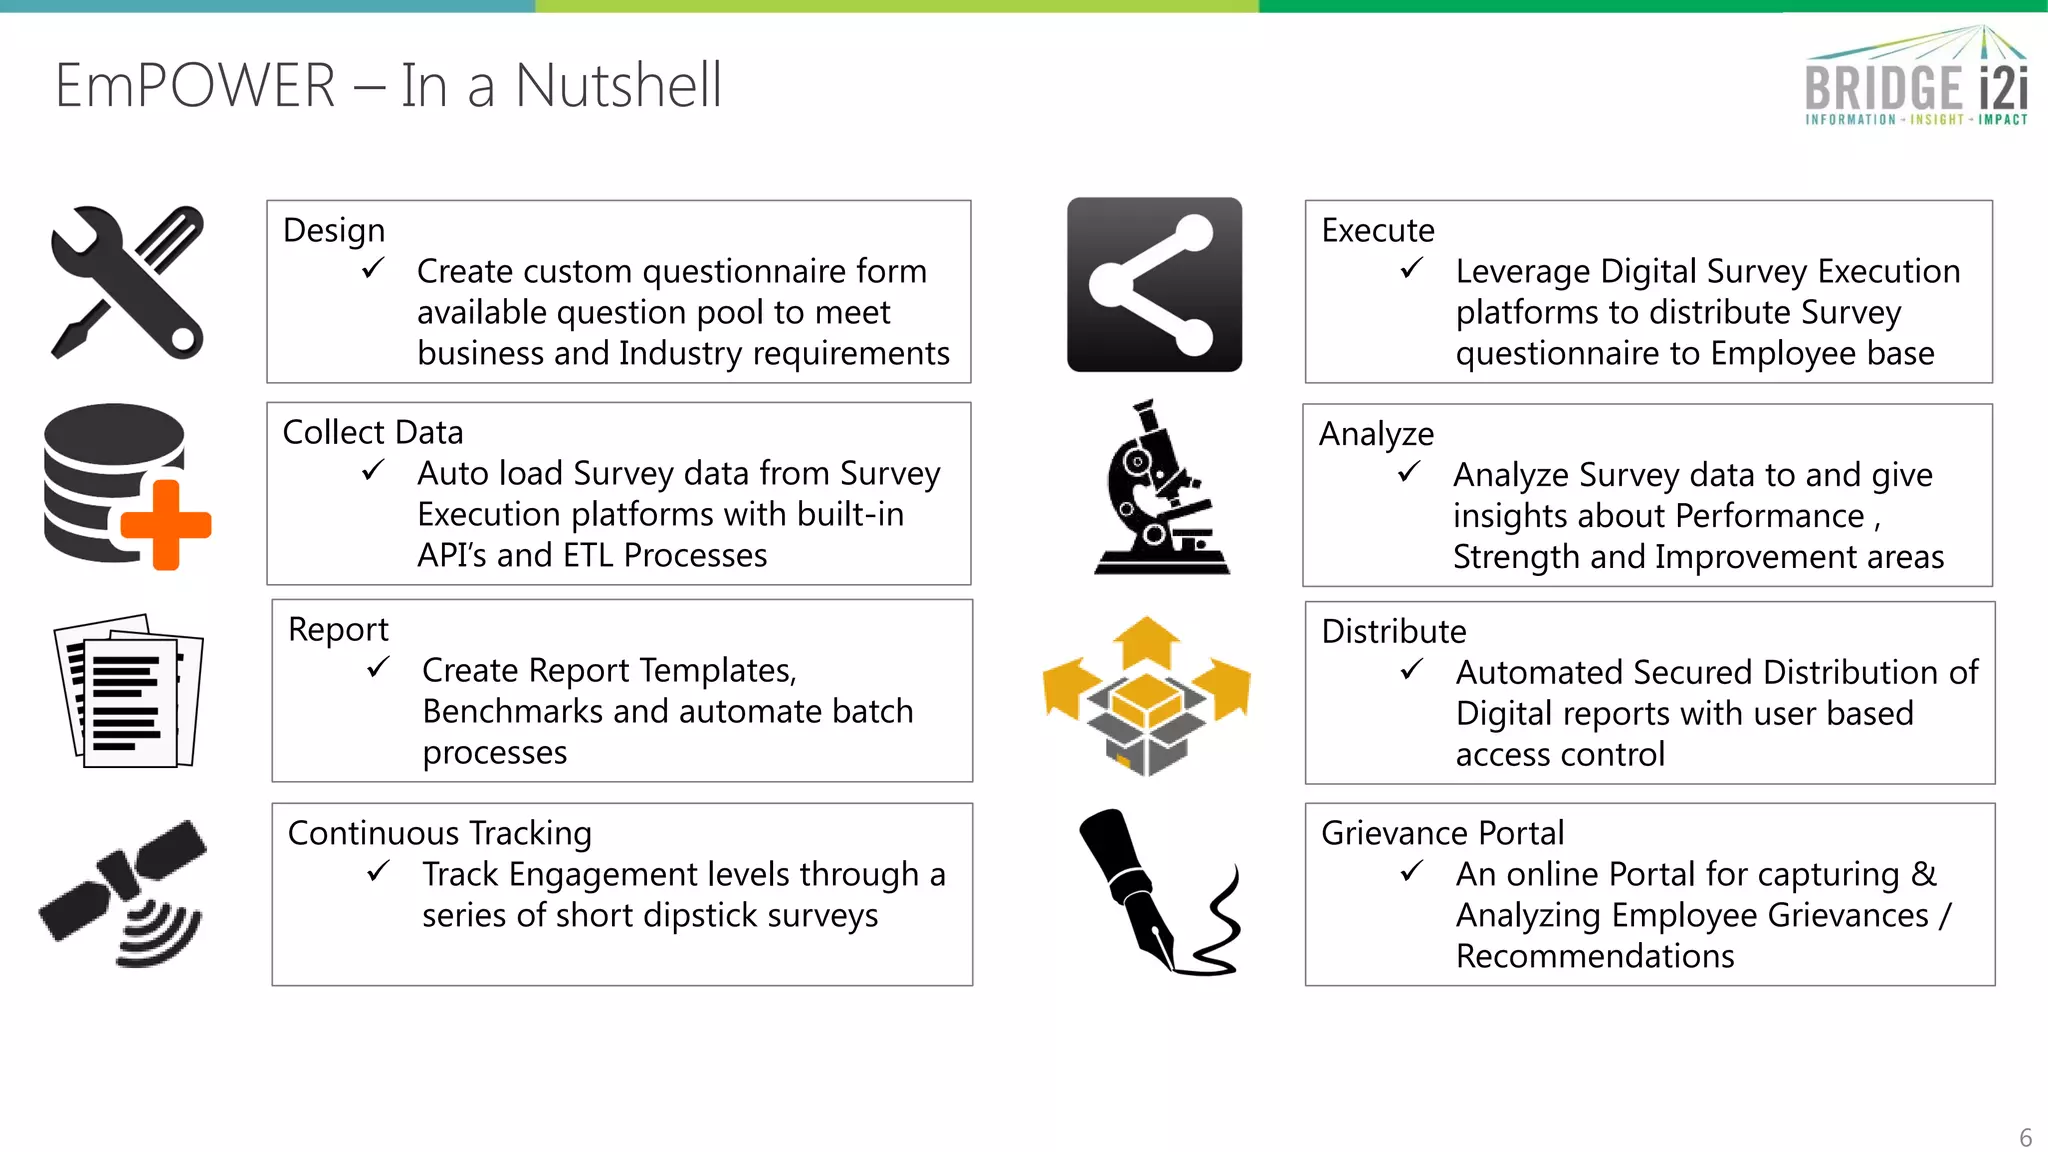
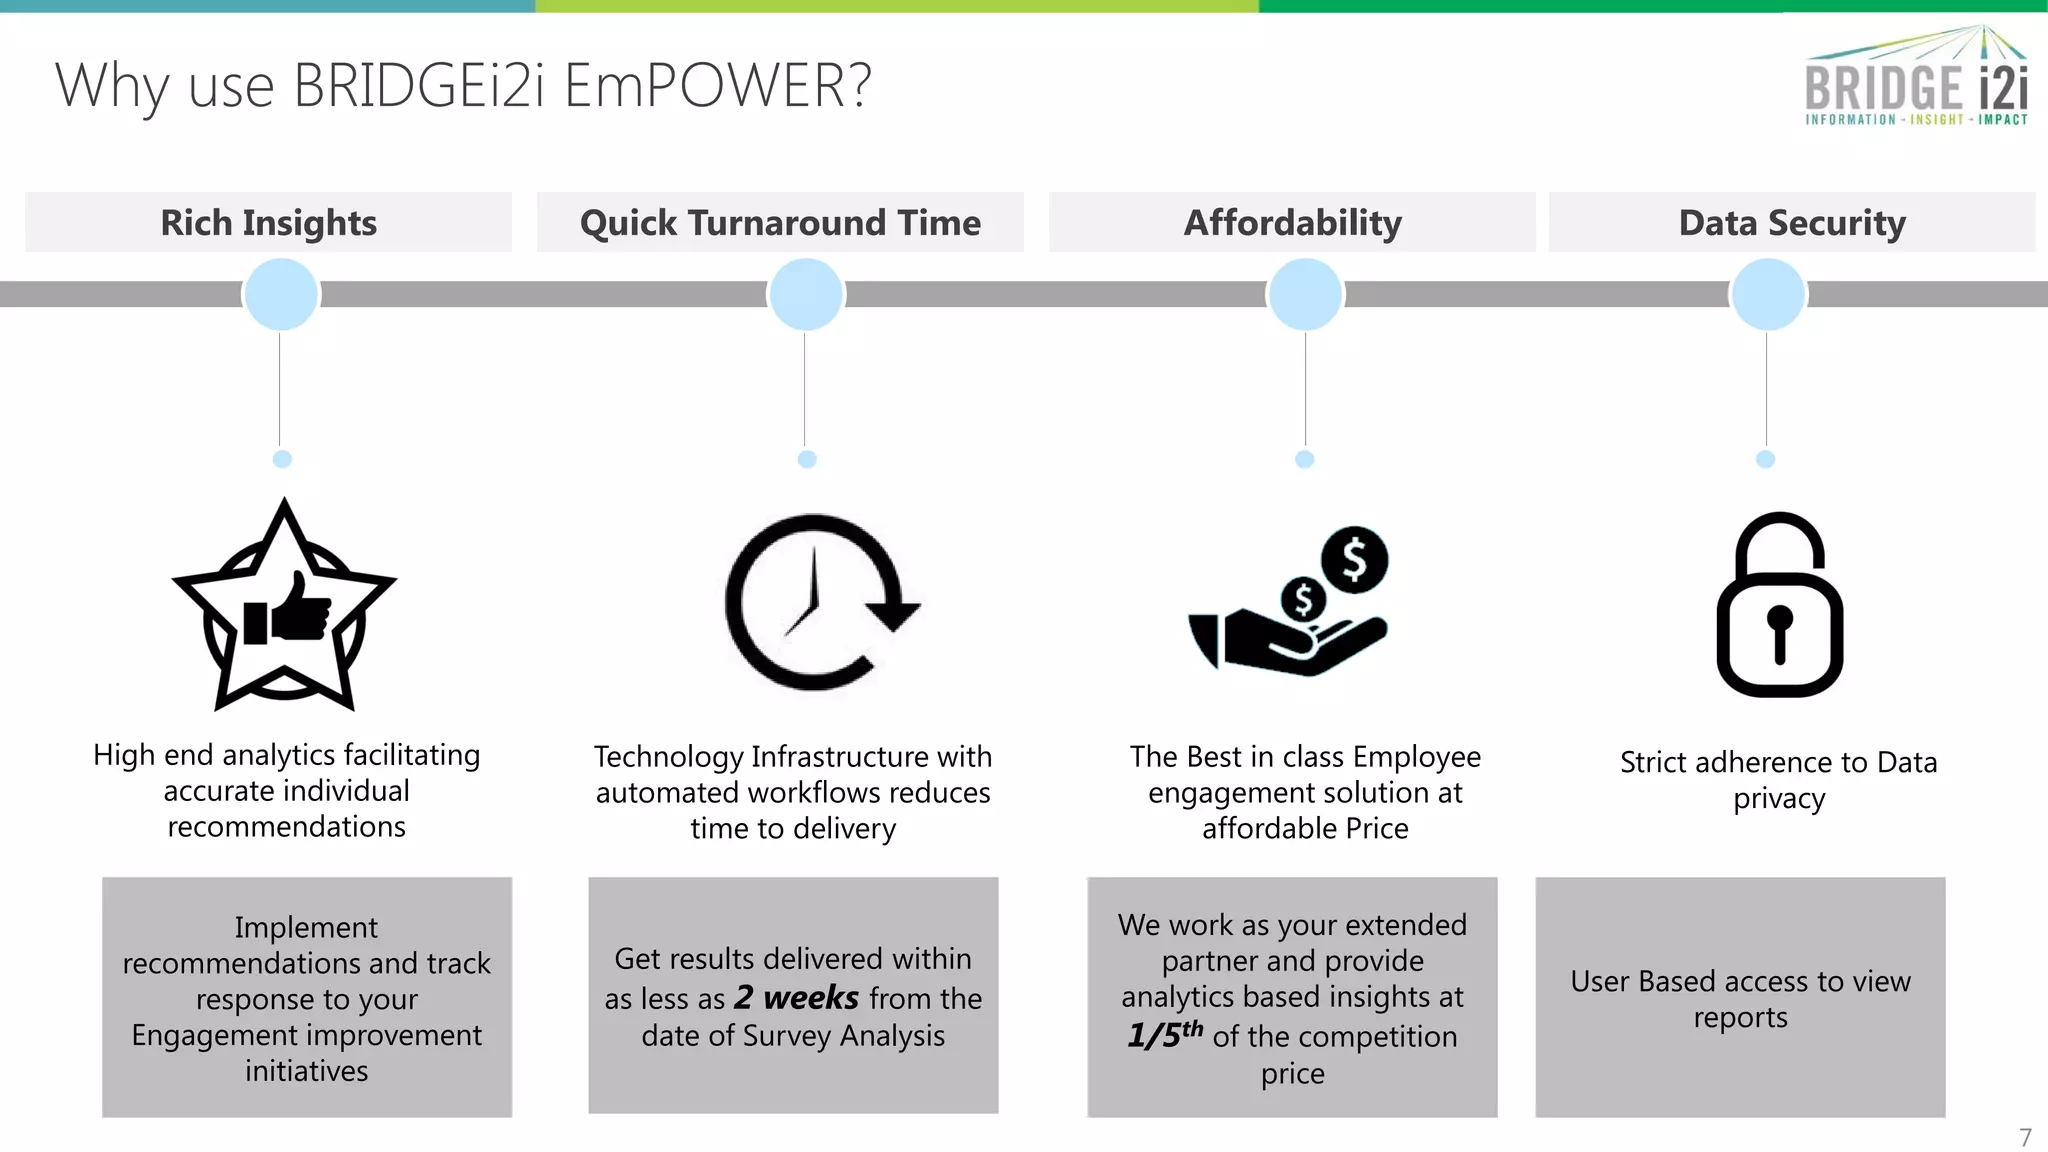
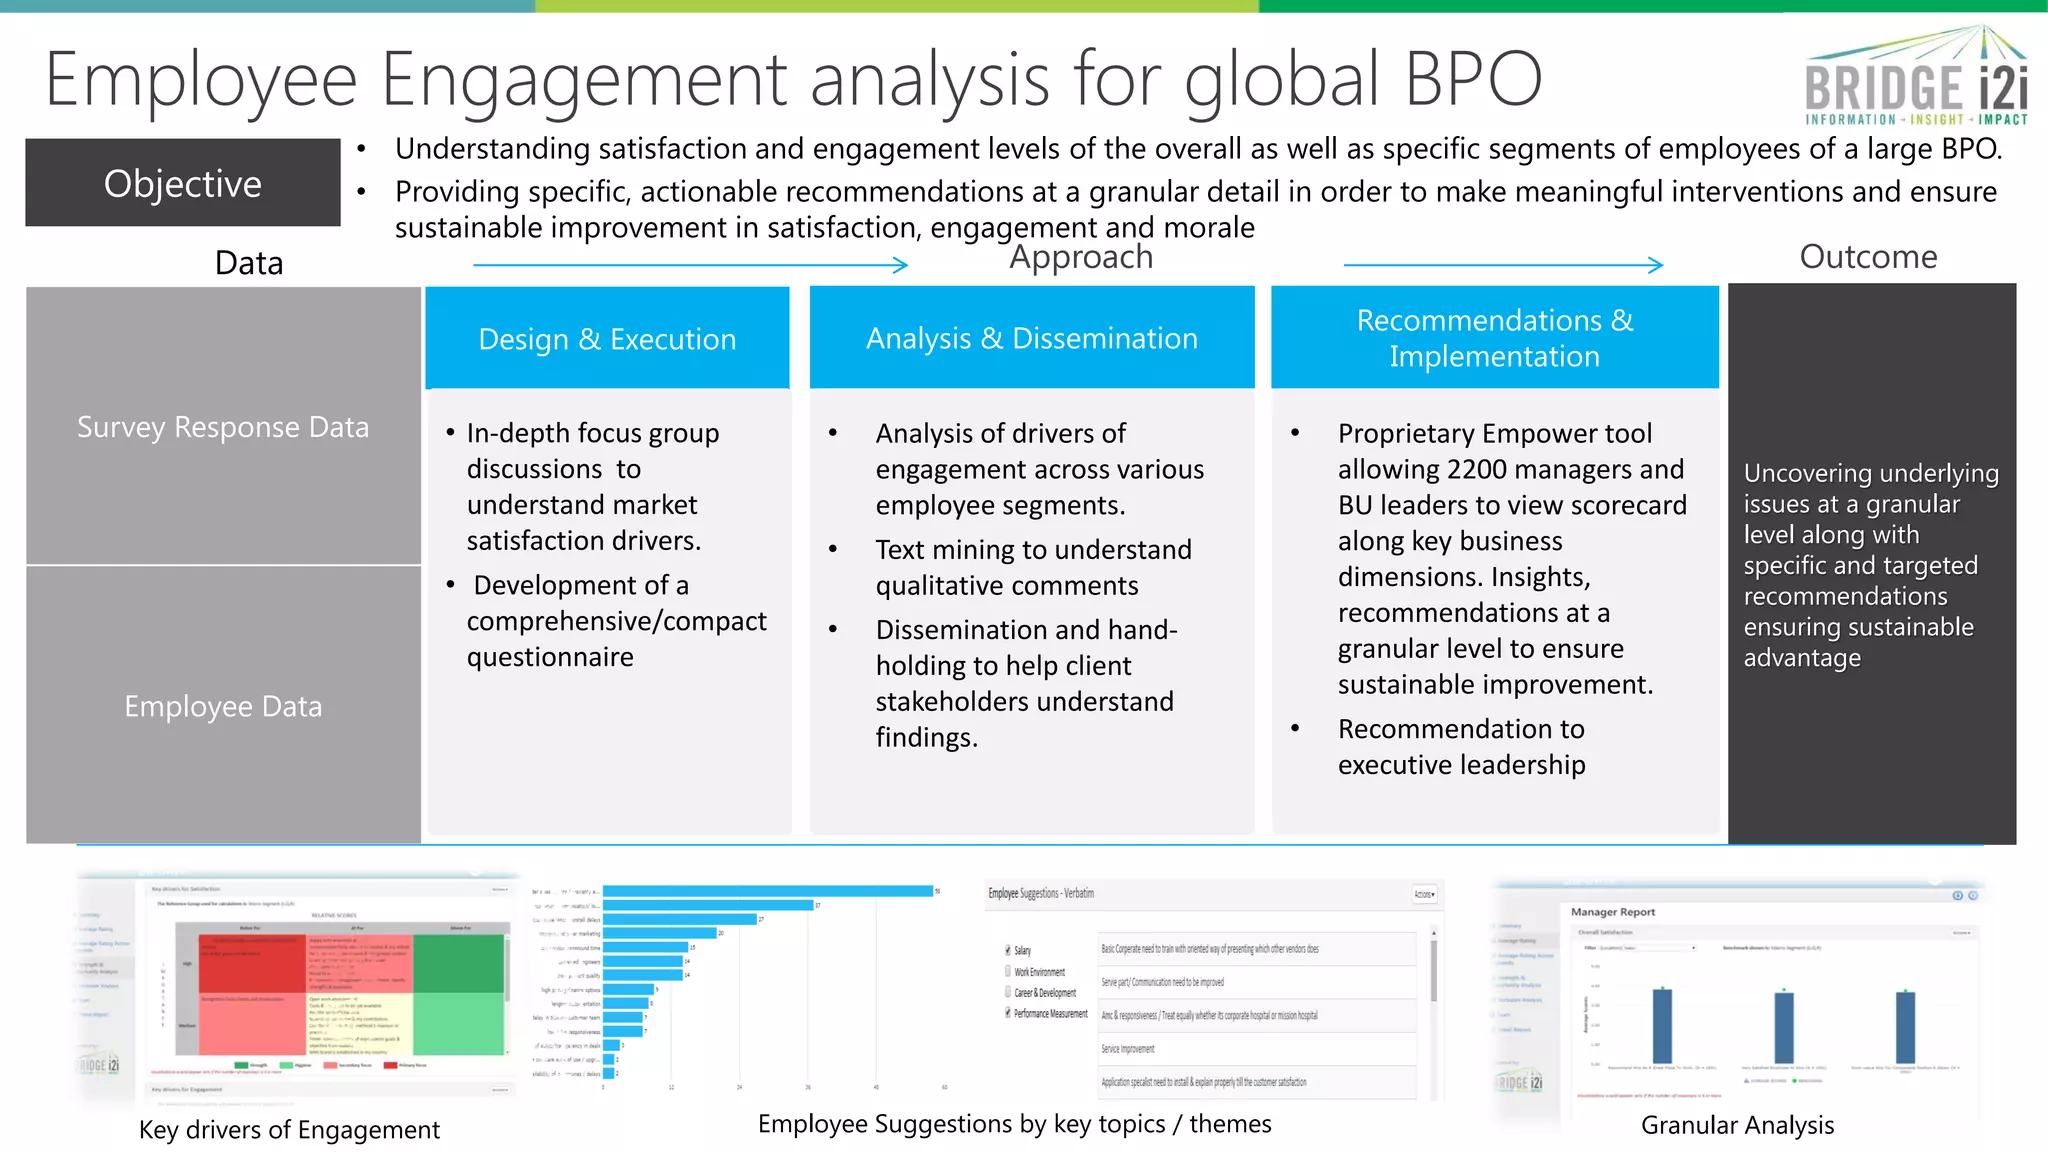
This document discusses an employee engagement analytics solution called EmPOWER. It provides insights into employee behavior through tailored analysis and continuous tracking. Key features include understanding employee sentiment at different levels, identifying attributes that influence engagement, and visualizing results. The solution aims to help organizations address gaps in current engagement surveys and institutionalize data-driven decisions to improve business value.
Customer experience measurement in the utilities industry – closing the loopCourse5i
Though utilities enjoy the relative comfort of a semi-monopolistic market, they do need to address the challenges around deregulation pressures and the continued to need to maintain profitability with a commodity product that only makes its presence felt when it is absent. In addition, environment consciousness, sensitivity to climate change, and demand for clean energy is at unprecedented levels – creating competitive pressures that utilities have never experienced before. Satisfied customers raise the competitive threshold and hence assure predictable and steady revenue streams.
Effectively managing customer engagement at every touch point to ensure a positive, memorable experience is key to retaining customers and enhancing customer life time value. Dynamically aligning the organization to changing customer preferences and expectations is key to creating and retaining a competitive edge in the markets.This requires a good understanding of the customer’s collective and segmented usage patterns, attitudes, preferences, dislikes, concerns, habits, behaviors and budgets. To successfully manage customer experience, there is also the need for an ability to quantify all of these characteristics and track them over a period of time to understand the gradual evolution in these.
This webinar will summarize the need for customer experience measurement in the utilities industry and the evolving challenges associated with measuring customer satisfaction. During this knowledge sharing session, we will be sharing a holistic approach towards customer experience measurement – especially with respect to harnessing the plethora of information sources available today. We will present the latest thinking on what drives customer experience in the utilities sector. We will end the session with an outlining of the key information areas that utilities need to monitor, the types of analytics and tools to consider, and the approaches that are likely to yield the best returns on your Customer Experience Measurement (CEM).
In this case study learn how BRIDGEi2i helped a Fortune 100 Technology company to leverage a Teradata environment to pull Bookings, Builds and Shipment information onto 1 platform and to correlate supply chain health with KPIs, Inventory and Backlog – REAL-TIME.
As an independent provider of Speech Analytics technology, Business Systems offers a unique perspective having seen a lot of implementations over the last few years spanning many different technologies, some have gone exceptionally well and some have been a little more challenging.
http://bit.ly/agile-marketing-metrics-guide
Analytics vs. Measurement: A topic near every marketer's heart - and its rate. Some love it, some hate it, but we all know measuring success is the only way to improve your changes at it.
But too often, big enterprise falls short. KPIs reporting and tactical optimization become the primary focus when that should just be the beginning of the roadmap.
Analytics has demonstrably helped transform supply chains in the modern enterprise. Across Procurement, Planning and Operations functions, organizations have benefited from leveraging analytics to optimize business processes and cultivate a data-driven decision making practice. At BRIDGEi2i, we help organizations get the best out of their data assets to address key supply chain challenges.
Manufacturing, a slow-adopter of Analytics, is now catching up in leaps and bounds. Across all business domains, applying analytics is providing answers to the most critical questions of the business.With exponential expansion of data, data driven insights have become a strategic necessity.
This booklet explores a few use cases of Big Data for manufacturing and how it can be leveraged.
For more info visit: https://www.teamcomputers.com/businessanalytics/Manufacturing/Booklet-Manufacturing-Digital.pdf
Presenter: Elizabeth Birabwa
Podcast: http://bit.ly/1jUBny1
Elizabeth Birabwa is the programme manager of at the Economic Policy Research Centre (EPRC) in Kamapa, Uganda, presents EPRC’s tools for measuring communications. Elizabeth has over 14 years of experience in advocacy, communications, media relations and information management. She holds a bachelor's degree in Mass Communication from Makerere University and a Master's Degree in Library and Inform
Presenter: Drusilla David
Podcast: http://bit.ly/1fauCTH
Drusilla is the communications officer at the Centre for the Study of Economies in Africa (CSEA) in Abuja, Nigeria, presents a case study on the Impact Log, a tool that CSEA uses to monitor its communications. Drusilla possesses communication and writing skills gained from her experience working as a correspondent on various sectors of the economy with a Nigerian daily newspaper.
Predictive project analytics: Will your project be successful?Deloitte Canada
We may not often ask ourselves whether our project will succeed for fear of the answer. But 63 percent of projects either fail or struggle to meet their budget or completion objectives. The more complex the project, the more likely it is to fail. A recent, high-profile example of this was the roll-out of the U.S. government’s healthcare.gov program. While the government acted quickly to fix major problems with the website, the glitch led many Americans to delay their decision to join the program and turned many others off altogether. Several factors contributed to the website’s failure, including incorrectly forecasting the performance requirements, not giving sufficient time for appropriate testing and underestimating the complexity of the project. The same shortcomings doom other projects, too.
To avoid making similar mistakes, leading organizations need to identify in advance which projects are more likely to end badly and how to give them the best shot at success. Predictive project analytics, or PPA, is a new approach that leverages advanced analytics to evaluate a given project’s likelihood of success. Read how it works and how it can help your organization.
Business Analytics to solve your Business ProblemsVishal Pawar
Business Analytics Solution in 12 Steps
What is Business Analytics ?
Why we need it ?
Identify your Focus Area and Target Applications
Importance of Business Analytics with different Roles
Confirming your Business Goal with value of Business Analytics
Differentiating Business Analysis , Analyst & Intelligence
What world is doing for Business Analytics Problems
Segregate solution with Data Discovery , Analytics & Science
Gathering information with All Available Data Source
Developing Business Analytics Framework & Components
Developing Visualization with Best User Experience
Improvising Maturity Level of Business Analytics
Get Connected with Expert Team , Who know technology !
Acquire, grow and retain customers with IBM Big Data & Analytics - Client Exa...David Pittman
Are you effectively converting your audience insights into added value for your consumers? 80% of CEOs believe they deliver a superior customer experience, but only 8% of their customers agree. With IBM Big Data & Analytics solutions you can acquire, grow, and retain customers by improving customer interaction, building long term relationships and realizing value from customer sentiment.
Acquire, grow and retain customers with IBM Big Data & Analytics - Client Exa...IBM Analytics
Are you effectively converting your audience insights into added value for your consumers? 80% of CEOs believe they deliver a superior customer experience, but only 8% of their customers agree. With IBM Big Data & Analytics solutions you can acquire, grow, and retain customers by improving customer interaction, building long term relationships and realizing value from customer sentiment.
In the past decade, the HR function has undergone a significant transformation. It has evolved from being a support function to a strategic business driver. Modern day HR’s can leverage plethora of data that to manage Employee Engagement. This presentation provides a sneak peak in to the key deliverables of BRIDGEi2i’s Employee Engagement Analytics Solution - EmPOWER
The Client is one of the world’s largest golf entertainment companies with assets in 11 cities across US and UK. As an initiative to improve their brand presence and perception, The Client is interested in (a) understanding the reach of its social media promotion activities and (b) innovative methods to identify & manage consumer sentiments as soon as a negative event has been triggered.
Do you want a GOOD project management methodology?Piotr Zygadlo
Slides to talk at Game Industry Conference 2015
During the talk I tried to explain why you can't just blindly implement something like SCRUM and why do you need to prepare own solution. And that you shouldn't cut costs of training.
In multiple Agile transformations, a key to success was clearly seperating the activities and phases of a project management methodology and the execution methodologies. This allows a PM methodology to apply to technology and non-technology projects and it allows teams to select from a range of methods to build the final "product" to satisfy the objectives of the project.
In the past decade, the HR function has undergone a significant transformation. It has evolved from being a support function to a strategic business driver. Modern day HR’s can leverage plethora of data that to manage Employee Engagement. This Flyer gives an overview about the key features of BRIDGEi2i’s Employee Analytics Management Solution - EmPOWER
Presentation from my Breakout Session at the great Congres Intranet 2014 conference in Utrecht (NL).
This presentation makes the case for employee engagment and knowledge work - both areas with massive problems in today's organisations - to be really just different sides of the same coin and what role the Intranet as a universal work tool can do to drive results in both areas.
The benefits of diversity for the workforce in Canada.
Canadian employers are making significant strides in
inclusive hiring and improving accessibility across an
increasingly broad range of industries.
Even without a diversity hiring strategy, it’s likely your workforce already reflects a variety of cultures and
capabilities.
Read more to find out how Canada is changing and how to facilitate workforce diversity
How combining the methodology of PRINCE2 and the framework of ITIL can enable...ILX Group
A comprehensive understanding of the fundamental differences and cross-overs between ITIL and PRINCE2 and the implications of utilising both methodologies into a project.
In this case study learn how BRIDGEi2i helped a Fortune 100 Technology company to understand patterns in New Product Introductions and use this understanding for better insights into planning demand for NPIs
After The Employee Engagement Survey: Now What? Best Practices in Communicati...Stephen Shinnan
The results are in. The presentation to the leadership team went well, and all eyes turn to you as the CEO utters those famous words: So, what are the next steps? You’ve been anticipating that, and have loads of questions:
How should we cascade the results to managers and staff? Is there are a right way and a wrong way? What are the best practices?
How do we go about action planning?
What should we focus on?
How do I deal with groups that don’t want to follow the organizational approach, i.e. they want to do their own thing?
How do I satisfy the people who don’t accept the organization’s results and think their group is different?
Join Norm Baillie-David, SVP Consulting, as he draws from numerous case studies and success stories to provide best practices in how to proceed after the survey to ensure that your survey investment is maximized and that you do the right things right to improve employee engagement in your organization.
In the past decade, the HR function has undergone a significant transformation. It has evolved from being a support function to a strategic business driver. Modern day HR’s can leverage plethora of data that to manage Employee Engagement. This presentation describes in detail about BRIDGEi2i’s offering on Employee Engagement Analytics and how HR’s can leverage the data eco system to get granular insights for improving Employee Engagement with snapshots of key deliverables
Predictive Analytics & Decision Solutions [PrADS], a subsidiary of Dun & Bradstreet provides cutting edge analytics solutions and actionable insights to leading organizations globally , The following presentation provides an overview of the services offered
Expert data analytics prove to be highly transformative when applied in context to corporate business strategies.
This webinar covers various approaches and strategies that will give you a detailed insight into planning and executing your Data Analytics projects.
Move from Business Intelligence to Advanced Analytics by Integrating IBM SPSS...Perficient, Inc.
Standard business intelligence reports and dashboards are effective tools to describe the state of your organization or department. However, there are many questions that these tools cannot address, such as:
Why is this happening?
How will my organization be impacted if these trends continue?
What will happen next?
How can we change the outcome of this situation?
Advanced analytics tools are necessary to accurately and quickly address these questions through statistical analysis, forecasting, predictive modeling and intelligent optimization. By integrating advanced analytics solutions with existing business intelligence platforms, your organization will be better positioned to extract actionable insight from your data to gain a true competitive advantage.
Learn how your organization can extend its business intelligence investments in IBM Cognos TM1 by integrating with IBM's leading advanced analytics platform, SPSS. We'll discuss the capabilities of TM1 and SPSS, integration methodologies and strategies, and demo an integrated analytics environment.
Data Integrity: From speed dating to lifelong partnershipPrecisely
Governance has little to do with governance…it’s about delivering and demonstrating value. It’s one thing for your colleagues to intellectually believe in the value of data, good data, and governed data, but it’s another thing entirely to have them emotionally engaged and excited to be involved. In this presentation from the CDO Sit-Down series, Shaun Connolly, Vice President of International Strategic Services, shares his thoughts and experience on approaches to win over reluctant leaders and business teams and describe the key components of successful programs.
An introduction to BRIDGEi2i - Analytics Solutions company focused on solving complex based problems based on data mining and advanced analytics on big data. Visit http://www.bridgei2i.com
How to build a data analytics strategy in a digital worldCaseWare IDEA
This presentation will take you through TSB Bank’s journey from first establishing the audit function through to developing a data analytics strategy as the organization gets ready to move to a new, state-of-the-art online banking platform.
SLIDESHARE: www.slideshare.net/CaseWare_Analytics
WEBSITE: www.casewareanalytics.com
BLOG: www.casewareanalytics.com/blog
TWITTER: www.twitter.com/CW_Analytic
Your Challenge
Companies understand the importance of business process improvement (BPI) and recognize the touted benefits: cost savings, waste elimination, and process efficiency.
With this said, 70% of companies that embark on process improvement initiatives fail.
The high probability of failure is attributed to a number of factors, including lack of continuous improvement and failing to define measurable outcomes.
Our Advice
Adopt a forward-facing outlook. Don’t focus solely on the current state, set improvement targets upfront to drive the initiative.
Break problems down into root-cause variables. Don’t look at the symptom, dive deeper and alleviate the root cause.
Empower business analysts. Create a practical process improvement methodology that your analysts can follow.
Impact and Result
Kick off process improvement by identifying the goals and defining the improvement targets.
Start by referring to the operating model and identifying level 1, 2, and 3 processes. Once the team understands the relationship between processes, they can begin to map a level 3 process using a standard mapping notation.
Use qualitative and quantitative techniques for analyzing the root cause rather than the symptoms.
Ensure the design is aligned with the initial improvement targets. Focus on value-added activities.
Consistently monitor the process and assess the root-cause variables to gauge the success of the process improvements.
Info-Tech Research Group & Boardroom Events Value Prop PresentationHilary Carney Badoian
As a participant of Midmarket CIO Forum, you are given the opportunity to benefit from the Info-Tech offering (membership, advisory services, diagnostics & benchmarking, tools, templates including policies and job descriptions, vendor contract review and negotiations, and alignment tools) while having the overlay of the peer to peer vetting and communications. See the overview here and set up a call to speak in detail: https://calendly.com/MeetHilary/IT
In the recent past, we have learnt that data is the lifeline of any business and it is really important to collect data, more and more of it. But no one is telling us what to do with large volumes of data.
Shailendra has successfully delivered over One Billion Dollars in incremental value and will spend 30 minutes in showcasing how many large organisations are using data to their advantage by creating value through generating incremental revenue and optimising costs using analytics techniques.
Key Takeaways:
(i) Demystify the myths of analytics
(ii) Walkthrough a step-by-step approach to delivering successful projects that created an incremental value of hundreds and millions of dollars.
(iii) Three use cases where large organisations are using analytics to their advantage by creating value by generating incremental revenue and optimising costs.
Strategic Consulting Partners in Life Science for a High Performing Paperless Lab
- Do you need to increase productivity and effectiveness of your lab operations?
- Do you want to reduce time to market and boost collaboration ?
- Are you concerned about data quality / data integrity issues?
- Do you need to replace your lab informatics systems and feel overwhelmed by the complexity of the market?
- Do you need to align consistent processes throughout the organisation?
With our success-proven seven-step program we have realized up to 30% efficiency improvements for major European Life Science companies lab operations.
We are lab-experienced chemists with a solid background in business administration and management, a passion for sustainable process improvements and in-depth knowledge of lab informatics. Originating from the renowned "Vialis paperless lab solutions" team, PEPR-Consulting continues its tradition of successful strategic management consulting for the life science industry.
Our strengths are the deep understanding of your lab processes, current GxP requirements and a broad and independent knowledge of lab informatics solutions available today and the trends shaping the future lab environment.
In this case study learn how BRIDGEi2i helped a Fortune 100 Technology company to develop an algorithm that simulates demand signals by associating a buffer inventory need for every SKU and to build a tracking mechanism that ensures optimality.
In this case study learn how BRIDGEi2i helped the world's largest Contract Manufacturer to quantify the impact of demand signal variation on capacity utilization and to build a predictive algorithm to counter demand & supply uncertainties and provision linear Capacity Utilization.
In this case study learn how BRIDGEi2i helped a Fortune 500 Technology company to develop a mobile-enabled dashboard to identify root cause to Throughput, Utilization and Yield metrics and delivered Real-time reporting using the Line Operations system
In this case study learn how BRIDGEi2i helped a Fortune 100 Technology company to develop an algorithm that identifies patterns in Direct Customer bookings
and to develop a unique forecasting model for just Direct customers.
In this case study learn how BRIDGEi2i helped the Software Division of a Fortune 100 Technology company to develop an algorithm to forecast revenue from SW at a product level and to understand revenue forecasts from licensing and delivery dimensions.
In this case study learn how BRIDGEi2i helped a Fortune 500 Consumer, Technology company to understand patterns in New Product Introduction and how data can be leveraged for the same
Digital has evolved into a major channel for organizations. From online selling to educational resources or engaging with customers, a online presence has become indispensable for organizations to compete in today's world.
BRIDGEi2i, with its Web Analytics Solution helps you manage your entire online presence across the entire analytics lifecycle.
From descriptive reporting of incoming traffic and your website quality to insights into visitor profiling and predicting visitor intent, BRIDGEi2i will partner with you to engage your visitors better.
Website path analyses, recommendation systems will help you sell and engage your customers and prospects in a personalized manner.
An overwhelming choice of applications, websites and digital platforms leaves our customers with multiple interaction channels and devices to connect with organizations. In a digitally connected economy, businesses need to represent a “single view” of the brand to the customer. The key here is to integrate customer information from multiple touch points and get a 360 degree view of the customer
This presentation talks about BRIDGEi2i’s Customer Experience Tracking Platform – ExTrack and how it could help businesses with near-real-time actionable recommendations for improving customer experience.
BRIDGEi2i has frameworks to establish Analytics CoE for Supply Chain functions within organizations. Demand planning solution of BRIDGEi2i aims at using advanced statistical forecasting coupled with real-time decision engines models for demand planning, inventory optimization.
Market Intelligence has been a central part to a company's strategy since a long time. However, it hasn't evolved fast enough to support today's dynamic environment.
BRIDGEi2i with its Contextual Market Intelligence solutions, provides actionable insights into your target market by marrying domain knowledge, technological expertize and enablement and Analytics capabilities.
The consumer has been the king for quite a while now. Why then are organizations struggling to engage the consumer, personalize its offering and maximize the value that they can realize.
BRIDGEi2i presents a comprehensive, end to end Consumer Analytics solution that helps you know your consumer better, predict purchasing decisions and personalize recommendations
The term "gamification" was coined in 2002 by Nick Pelling, a British-born computer programmer and inventor. As defined by Gartner “Gamification is the use of game design and game mechanics to engage a target audience to change behaviors, learn new skills or engage in innovation.” The target audience may be customers, employees or the general public, but first and foremost, they are people with needs and desires who will respond to stimuli.
This whitepaper highlights the application of gamification in various organizational areas.
With all the buzz going around about Big Data and Analytics, you might think Analytics is just an escoteric buzzword used only by CXOs to improve their revenues or manage their costs. THINK AGAIN!
Analytics is much more that. Imagine a day, any day. 24 hours. What do you think can Analytics accomplish in 24 hours? From a game of golf in the morning, dropping off children to school, a quick visit to the bank, planning the anniversary gift or thinking about retirement, each day could have myriad problems and decisions for each of us.
BRIDGEi2i tells you the story of how the strategic data analytics work it does for large, global companies, actually touches customers’ lives.
Improving customer experience, simplifying logistics, helping them meet their commitments - both personal and financial; it actually helps each of us in the smallest day-to-day decisions of our lives.
24 hours of our lives. All in a day’s work for BRIDGEi2i.
Author: Prithvijit Roy
In this case study learn how BRIDGEi2i helped a Global Logistic market leader in their process of building a Best in Class key account management organization.
This presentation was presented at #CustomerAnalytics Conference, Chicago 2014 by Maruti Peri, VP Sales.
BRIDGEi2i helps businesses extract each ounce of loyalty in today's “Age of the Customers” as customer loyalty keeps fighting an uphill battle with increased product choices and proliferation of prospective client information. To know more about BRIDGEi2i Customer Intelligence Solutions, visit http://www.bridgei2i.com/customer-intelligence.html
Show drafts
volume_up
Empowering the Data Analytics Ecosystem: A Laser Focus on Value
The data analytics ecosystem thrives when every component functions at its peak, unlocking the true potential of data. Here's a laser focus on key areas for an empowered ecosystem:
1. Democratize Access, Not Data:
Granular Access Controls: Provide users with self-service tools tailored to their specific needs, preventing data overload and misuse.
Data Catalogs: Implement robust data catalogs for easy discovery and understanding of available data sources.
2. Foster Collaboration with Clear Roles:
Data Mesh Architecture: Break down data silos by creating a distributed data ownership model with clear ownership and responsibilities.
Collaborative Workspaces: Utilize interactive platforms where data scientists, analysts, and domain experts can work seamlessly together.
3. Leverage Advanced Analytics Strategically:
AI-powered Automation: Automate repetitive tasks like data cleaning and feature engineering, freeing up data talent for higher-level analysis.
Right-Tool Selection: Strategically choose the most effective advanced analytics techniques (e.g., AI, ML) based on specific business problems.
4. Prioritize Data Quality with Automation:
Automated Data Validation: Implement automated data quality checks to identify and rectify errors at the source, minimizing downstream issues.
Data Lineage Tracking: Track the flow of data throughout the ecosystem, ensuring transparency and facilitating root cause analysis for errors.
5. Cultivate a Data-Driven Mindset:
Metrics-Driven Performance Management: Align KPIs and performance metrics with data-driven insights to ensure actionable decision making.
Data Storytelling Workshops: Equip stakeholders with the skills to translate complex data findings into compelling narratives that drive action.
Benefits of a Precise Ecosystem:
Sharpened Focus: Precise access and clear roles ensure everyone works with the most relevant data, maximizing efficiency.
Actionable Insights: Strategic analytics and automated quality checks lead to more reliable and actionable data insights.
Continuous Improvement: Data-driven performance management fosters a culture of learning and continuous improvement.
Sustainable Growth: Empowered by data, organizations can make informed decisions to drive sustainable growth and innovation.
By focusing on these precise actions, organizations can create an empowered data analytics ecosystem that delivers real value by driving data-driven decisions and maximizing the return on their data investment.
StarCompliance is a leading firm specializing in the recovery of stolen cryptocurrency. Our comprehensive services are designed to assist individuals and organizations in navigating the complex process of fraud reporting, investigation, and fund recovery. We combine cutting-edge technology with expert legal support to provide a robust solution for victims of crypto theft.
Our Services Include:
Reporting to Tracking Authorities:
We immediately notify all relevant centralized exchanges (CEX), decentralized exchanges (DEX), and wallet providers about the stolen cryptocurrency. This ensures that the stolen assets are flagged as scam transactions, making it impossible for the thief to use them.
Assistance with Filing Police Reports:
We guide you through the process of filing a valid police report. Our support team provides detailed instructions on which police department to contact and helps you complete the necessary paperwork within the critical 72-hour window.
Launching the Refund Process:
Our team of experienced lawyers can initiate lawsuits on your behalf and represent you in various jurisdictions around the world. They work diligently to recover your stolen funds and ensure that justice is served.
At StarCompliance, we understand the urgency and stress involved in dealing with cryptocurrency theft. Our dedicated team works quickly and efficiently to provide you with the support and expertise needed to recover your assets. Trust us to be your partner in navigating the complexities of the crypto world and safeguarding your investments.
Explore our comprehensive data analysis project presentation on predicting product ad campaign performance. Learn how data-driven insights can optimize your marketing strategies and enhance campaign effectiveness. Perfect for professionals and students looking to understand the power of data analysis in advertising. for more details visit: https://bostoninstituteofanalytics.org/data-science-and-artificial-intelligence/
Adjusting primitives for graph : SHORT REPORT / NOTESSubhajit Sahu
Graph algorithms, like PageRank Compressed Sparse Row (CSR) is an adjacency-list based graph representation that is
Multiply with different modes (map)
1. Performance of sequential execution based vs OpenMP based vector multiply.
2. Comparing various launch configs for CUDA based vector multiply.
Sum with different storage types (reduce)
1. Performance of vector element sum using float vs bfloat16 as the storage type.
Sum with different modes (reduce)
1. Performance of sequential execution based vs OpenMP based vector element sum.
2. Performance of memcpy vs in-place based CUDA based vector element sum.
3. Comparing various launch configs for CUDA based vector element sum (memcpy).
4. Comparing various launch configs for CUDA based vector element sum (in-place).
Sum with in-place strategies of CUDA mode (reduce)
1. Comparing various launch configs for CUDA based vector element sum (in-place).
Techniques to optimize the pagerank algorithm usually fall in two categories. One is to try reducing the work per iteration, and the other is to try reducing the number of iterations. These goals are often at odds with one another. Skipping computation on vertices which have already converged has the potential to save iteration time. Skipping in-identical vertices, with the same in-links, helps reduce duplicate computations and thus could help reduce iteration time. Road networks often have chains which can be short-circuited before pagerank computation to improve performance. Final ranks of chain nodes can be easily calculated. This could reduce both the iteration time, and the number of iterations. If a graph has no dangling nodes, pagerank of each strongly connected component can be computed in topological order. This could help reduce the iteration time, no. of iterations, and also enable multi-iteration concurrency in pagerank computation. The combination of all of the above methods is the STICD algorithm. [sticd] For dynamic graphs, unchanged components whose ranks are unaffected can be skipped altogether.
A quick Introduction to Employee Engagement Analytics Suite – EmPOWER
1. @ 2014 BRIDGEi2i Analytics Solutions Pvt. Ltd. All rights reserved
An Employee Engagement Suite
2. BRIDGEi2i – Bridging INFORMATION, INSIGHT and IMPACT
2
Information Big Data
Management
Reporting,
Research &
Visualization
Insight Behavioral
Modeling &
Personalization
Resource
Planning &
Optimization
Impact Decision
Engine
Analytics
Operationalization
Partnering with enterprises globally to monetize their data assets
Transform and visualize big data into
meaningful business metrics
Identify underlying patterns, understand
behavior and predict outcome
Institutionalize data driven decisions to
realize sustainable business value
3. Our Journey So Far
3
Our Journey Team
• One of the fastest growing analytics
solution provider with marquee global
clients across industries
• 80+ member team with delivery
operations in Bangalore with sales office in
USA
• Investing in developing algorithms &
technology solutions to accelerate path to
impact – Big Data & innovation Lab
• Established scalable processes for talent
management, consulting rigour, quality
management, information security,
knowledge management & productivity
management
Enabling clients
to compete &
win based on
analytics
• Leadership experienced in building two
of the largest Analytics Centres of
Expertize for – GE & HP
• Team of data scientists, analysts &
programmers with advanced degrees
in Quantitative & Sciences, IT &
Management
• Team brings strong combination of
consulting, domain, technology &
analytics expertize.
• Guided by a team of 4 advisors in USA
who have the reputation of bringing
analytics led transformation in their
respective F100 enterprises
Working with 10+ Fortune 500 firms across verticals globally
Consumer
Goods
Retail &
Distribution
Financial
Services
Insurance Technology Education
Recognitions
11 innovative Big Data start-ups in 2013
Recognized three years in a row - leading Big
Data Analytics & Products companies
10 Most promising Big Data companies in 2013
20 Most promising Business Intelligence
Solution providers in 2014
Top Fin-tech innovations
in Finovate Asia 2013
4. 4
Current Employee Engagement Surveys provide
you with
Reports on Engagement distribution
Annual/Bi-annual employee feedback
Access to Employee Comments
Do they leave with you more questions…
1. How can the survey data be used to drive
actionable and predictive insights?
2. How can insights be personalized for
different employee segments such as (Age,
Gender, Qualification, Designation etc.)
• What are Gen Ys thinking about their
Job?
• What is the level of job satisfaction of
high potential employees?
3. How can I understand the movement from
last survey through ongoing understanding
of employee behavior?
Gaps in Current Employee Engagement Solutions
5. Key Features of EmPOWER
5
Tailor-Made Insights Attribute Identification Tracking Visualization
Understanding Employee Behavior
at a granular segment level to drive
more actionable insights
Benefits:
• Accurate actionable
recommendations at individual
level tied to improving
Engagement
• Clear understanding of
Performance by measuring
against suitable benchmarks
Mining of Employee comments
to understand pain points and
identify key drivers for
improvement
Benefits:
• Know about opportunities
for improving Employee
Engagement (by Employee
Groups, managers and key
business Units)
• Improve understanding of
team performance
Benefits:
• Know if you are in the right
direction in Employee
Engagement improvement
efforts. – Track progress
• Understand the changing
dynamics of employee
needs
Continuous touch point with
the Employees facilitating
ongoing tracking of Employee
Engagement levels
Rich Visualizations with
appropriate levels of granularity
to meet various stake holder
needs (CXO’s, BU Heads,
Managers etc.)
Benefits:
• Interactive dashboards
making information
consumption easier
• Ability to Export reports in
PDF, PPT , excel for further
analysis
6. EmPOWER – In a Nutshell
6
Design
Create custom questionnaire form
available question pool to meet
business and Industry requirements
Execute
Leverage Digital Survey Execution
platforms to distribute Survey
questionnaire to Employee base
Collect Data
Auto load Survey data from Survey
Execution platforms with built-in
API’s and ETL Processes
Analyze
Analyze Survey data to and give
insights about Performance ,
Strength and Improvement areas
Report
Create Report Templates,
Benchmarks and automate batch
processes
Distribute
Automated Secured Distribution of
Digital reports with user based
access control
Continuous Tracking
Track Engagement levels through a
series of short dipstick surveys
Grievance Portal
An online Portal for capturing &
Analyzing Employee Grievances /
Recommendations
7. Why use BRIDGEi2i EmPOWER?
7
Rich Insights Quick Turnaround Time
Technology Infrastructure with
automated workflows reduces
time to delivery
The Best in class Employee
engagement solution at
affordable Price
Affordability Data Security
Strict adherence to Data
privacy
High end analytics facilitating
accurate individual
recommendations
Implement
recommendations and track
response to your
Engagement improvement
initiatives
Get results delivered within
as less as 2 weeks from the
date of Survey Analysis
We work as your extended
partner and provide
analytics based insights at
1/5th of the competition
price
User Based access to view
reports
8. One Time Survey Execution – Illustrative Process & Timelines
8
•Manager Reports
•Segment Reports
DESIGN EXECUTE ANALYZE
Finalize Research Objectives
& Questionnaire Design
Roll out Web Survey
& Collect Responses
Analyse Responses,
Prepare Overall Report
Segment Level and
Manager level Reports
•Alignment on research
objectives
•Final questionnaire,
approved for coding
•Survey goes live
•Data collection
complete
•Share summary reports
for overall organization
•Insights & Actionable
Recommendations
Phase RECOMMEND
WK 0 WK 1 WK 3 WK 5 WK 6
SURVEY GO
LIVE
OVERALL REPORT SEGMENT REPORTSQUESTIONNAIRE SIGN OFF
ADVANCED ANALYTICS
PLATFORM- EmPower
Timeline
Objective
Outcome/
Deliverables
INSIGHTS & ACTIONABLE
RECOMMENDATIONS
RESEARCH CUSTOMIZED TO
UNIQUE NEEDS
SURVEY
CLOSURE
Level of Customization
Least Customization Most Customization
6-8 WK Questionnaire Customization
Report Template modification to
accommodate new dimensions
8-10WK Adding New Benchmarks
Adding Report filters
9. Employee Engagement analysis for global BPO
Data Approach Outcome
• Understanding satisfaction and engagement levels of the overall as well as specific segments of employees of a large BPO.
• Providing specific, actionable recommendations at a granular detail in order to make meaningful interventions and ensure
sustainable improvement in satisfaction, engagement and morale
Objective
Design & Execution Analysis & Dissemination
Recommendations &
Implementation
Survey Response Data
Employee Data
• In-depth focus group
discussions to
understand market
satisfaction drivers.
• Development of a
comprehensive/compact
questionnaire
• Analysis of drivers of
engagement across various
employee segments.
• Text mining to understand
qualitative comments
• Dissemination and hand-
holding to help client
stakeholders understand
findings.
• Proprietary Empower tool
allowing 2200 managers and
BU leaders to view scorecard
along key business
dimensions. Insights,
recommendations at a
granular level to ensure
sustainable improvement.
• Recommendation to
executive leadership
Uncovering underlying
issues at a granular
level along with
specific and targeted
recommendations
ensuring sustainable
advantage
Key drivers of Engagement Employee Suggestions by key topics / themes Granular Analysis