Downloaded 433 times
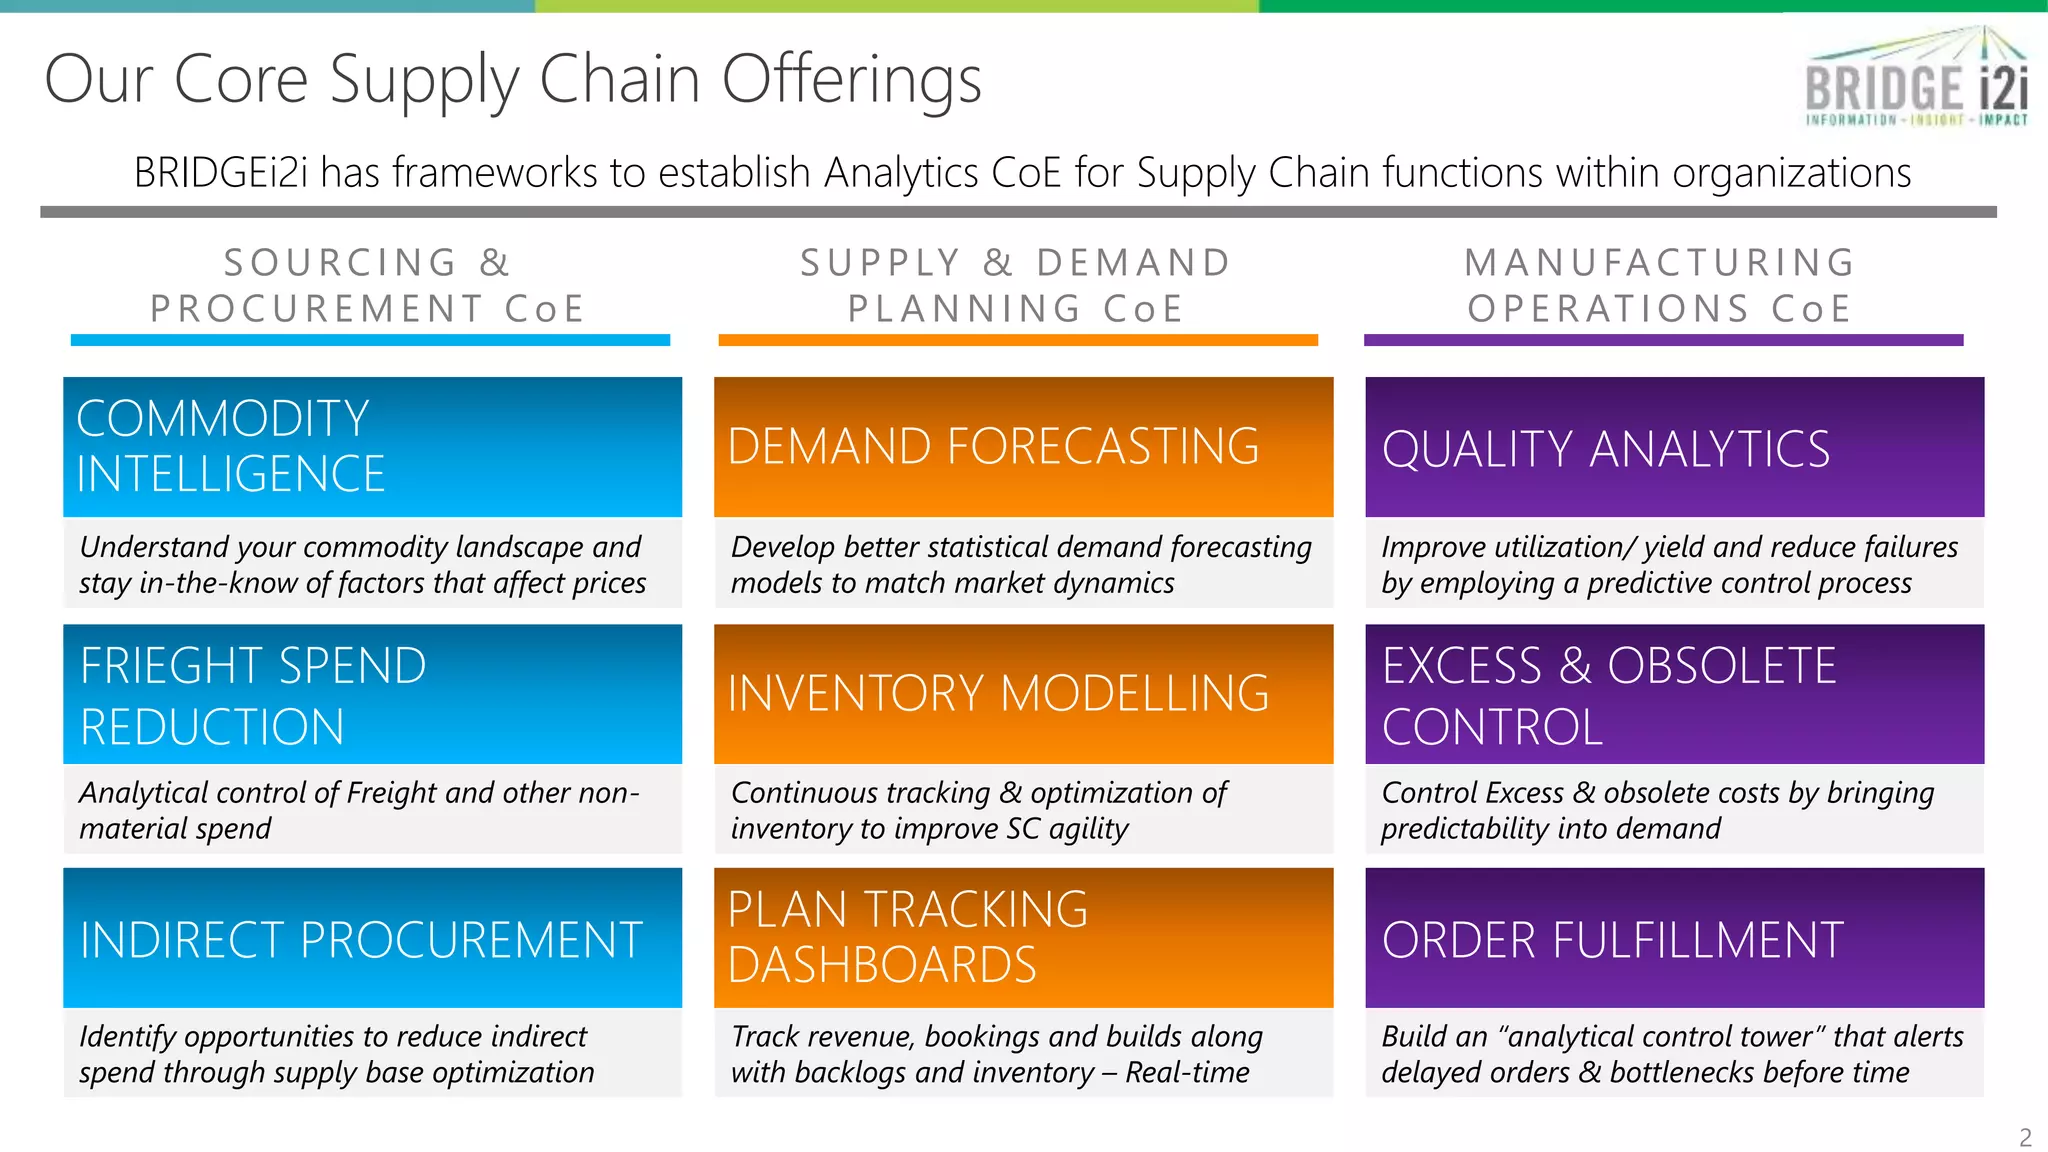
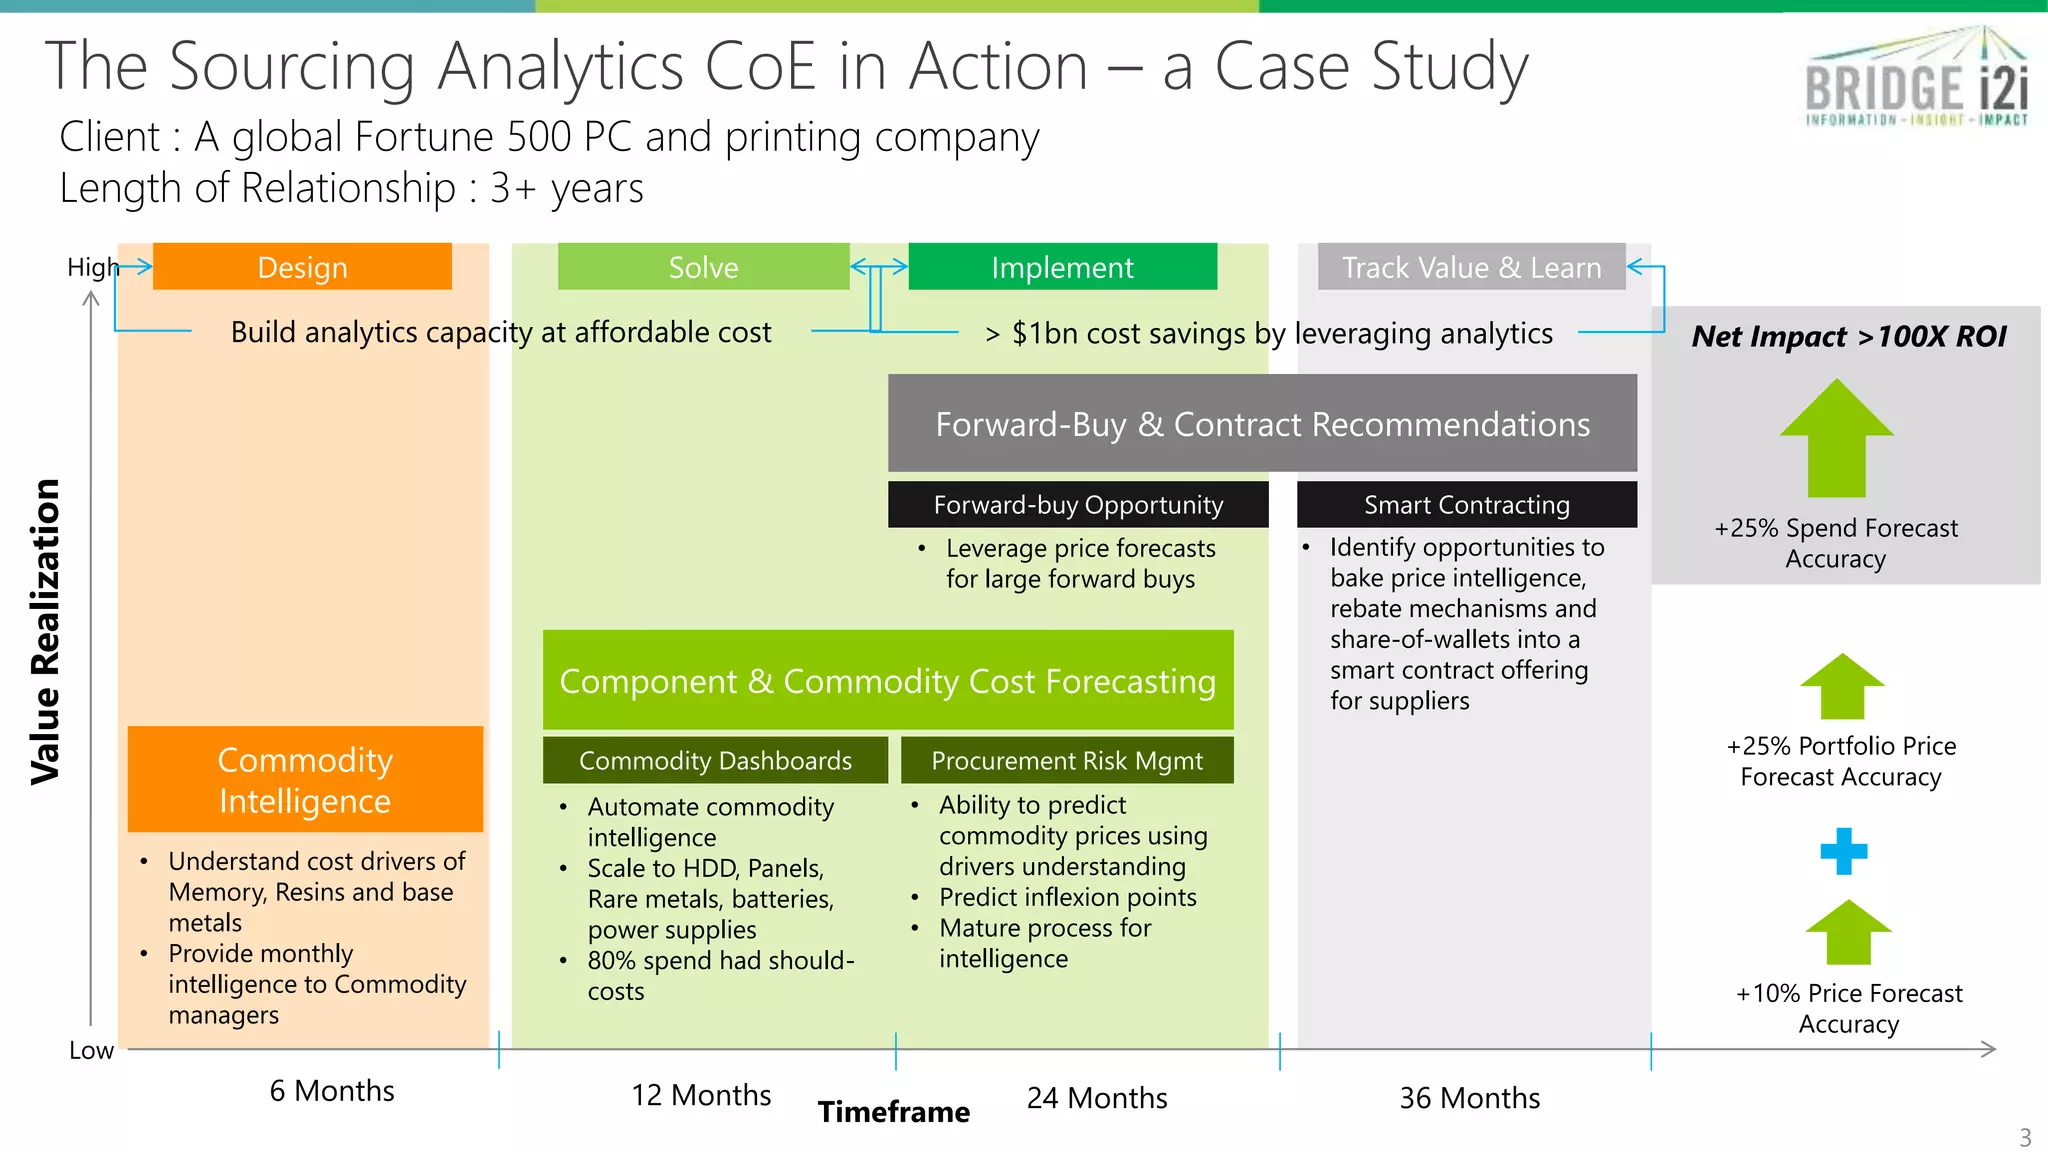
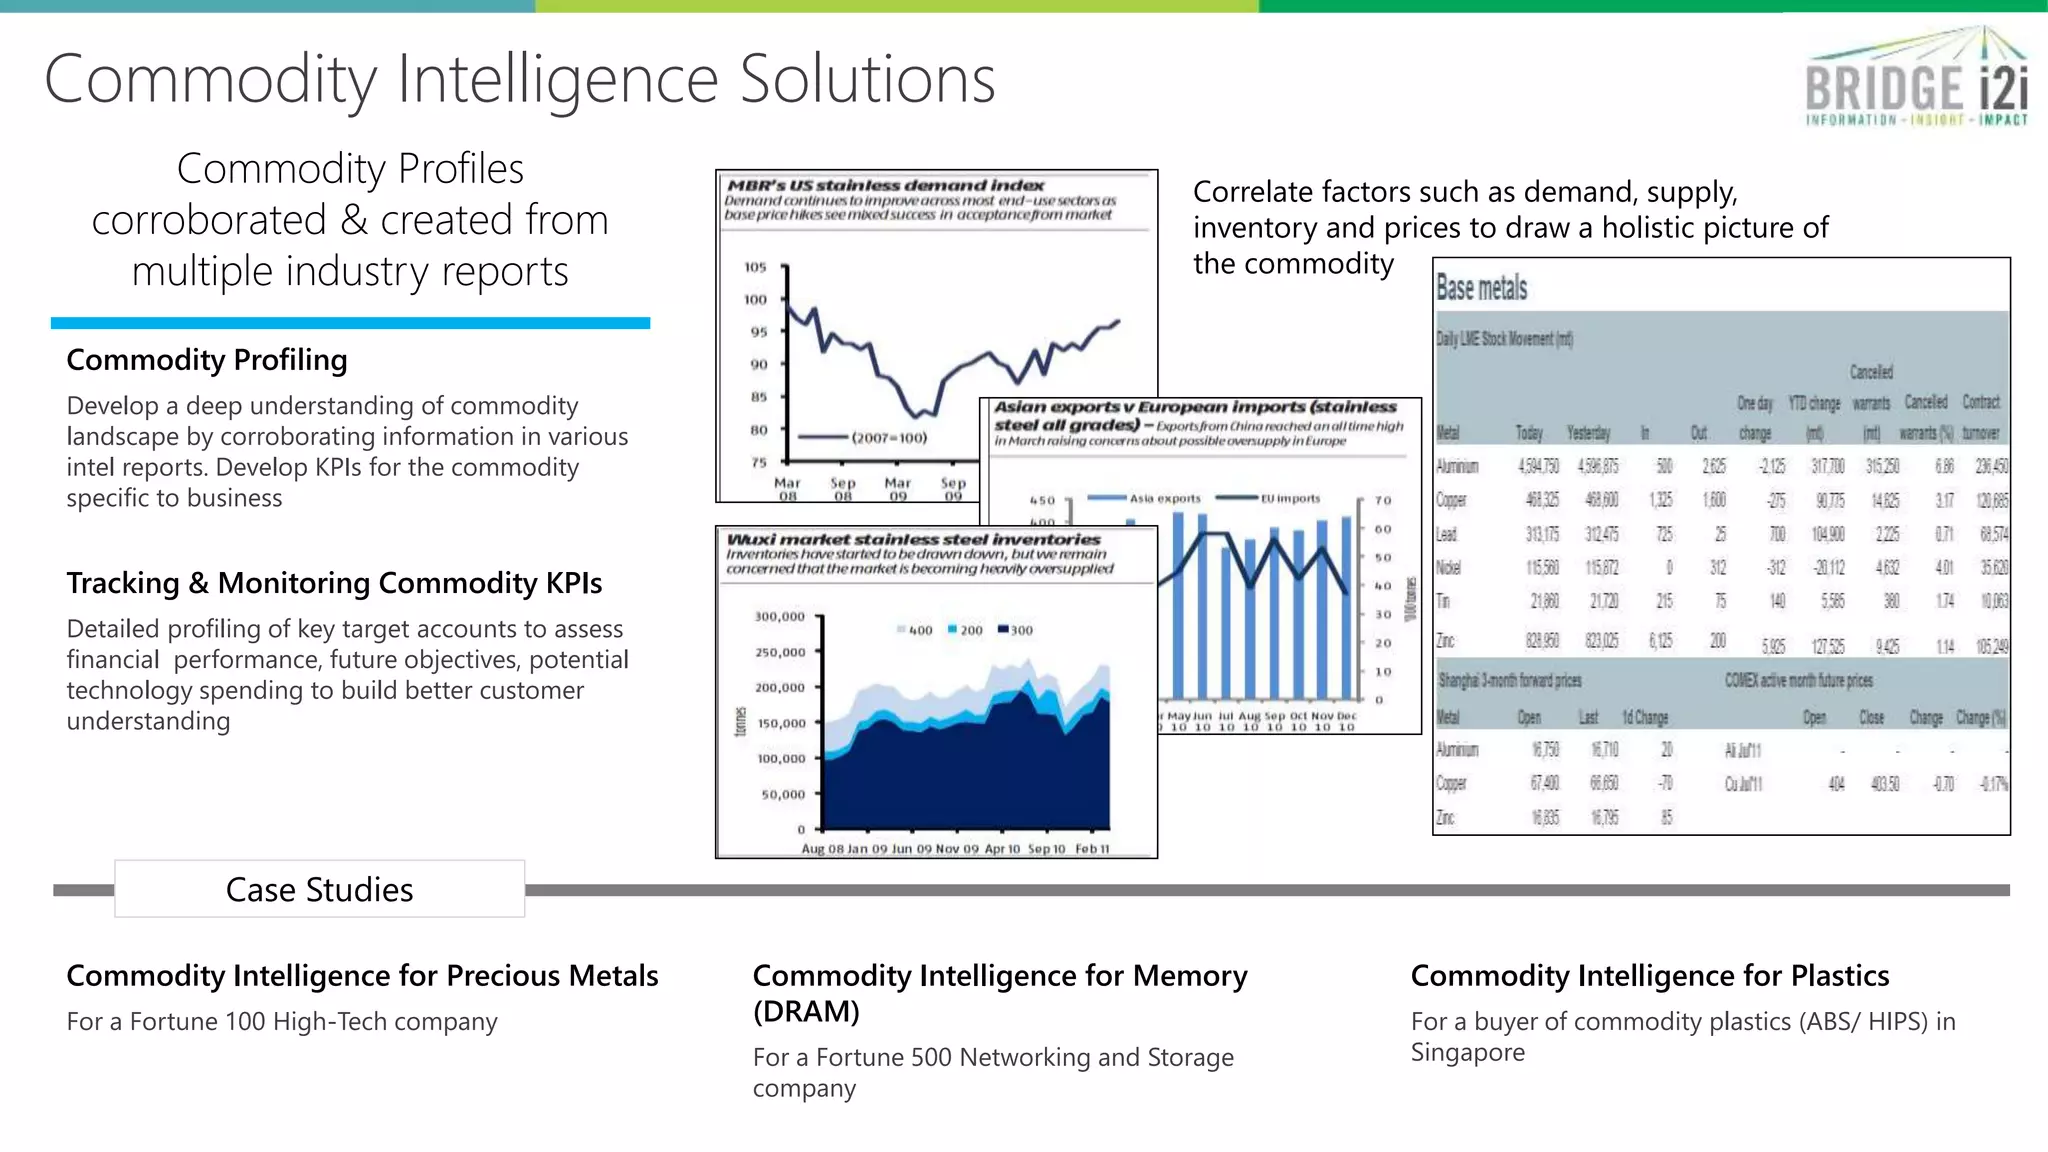
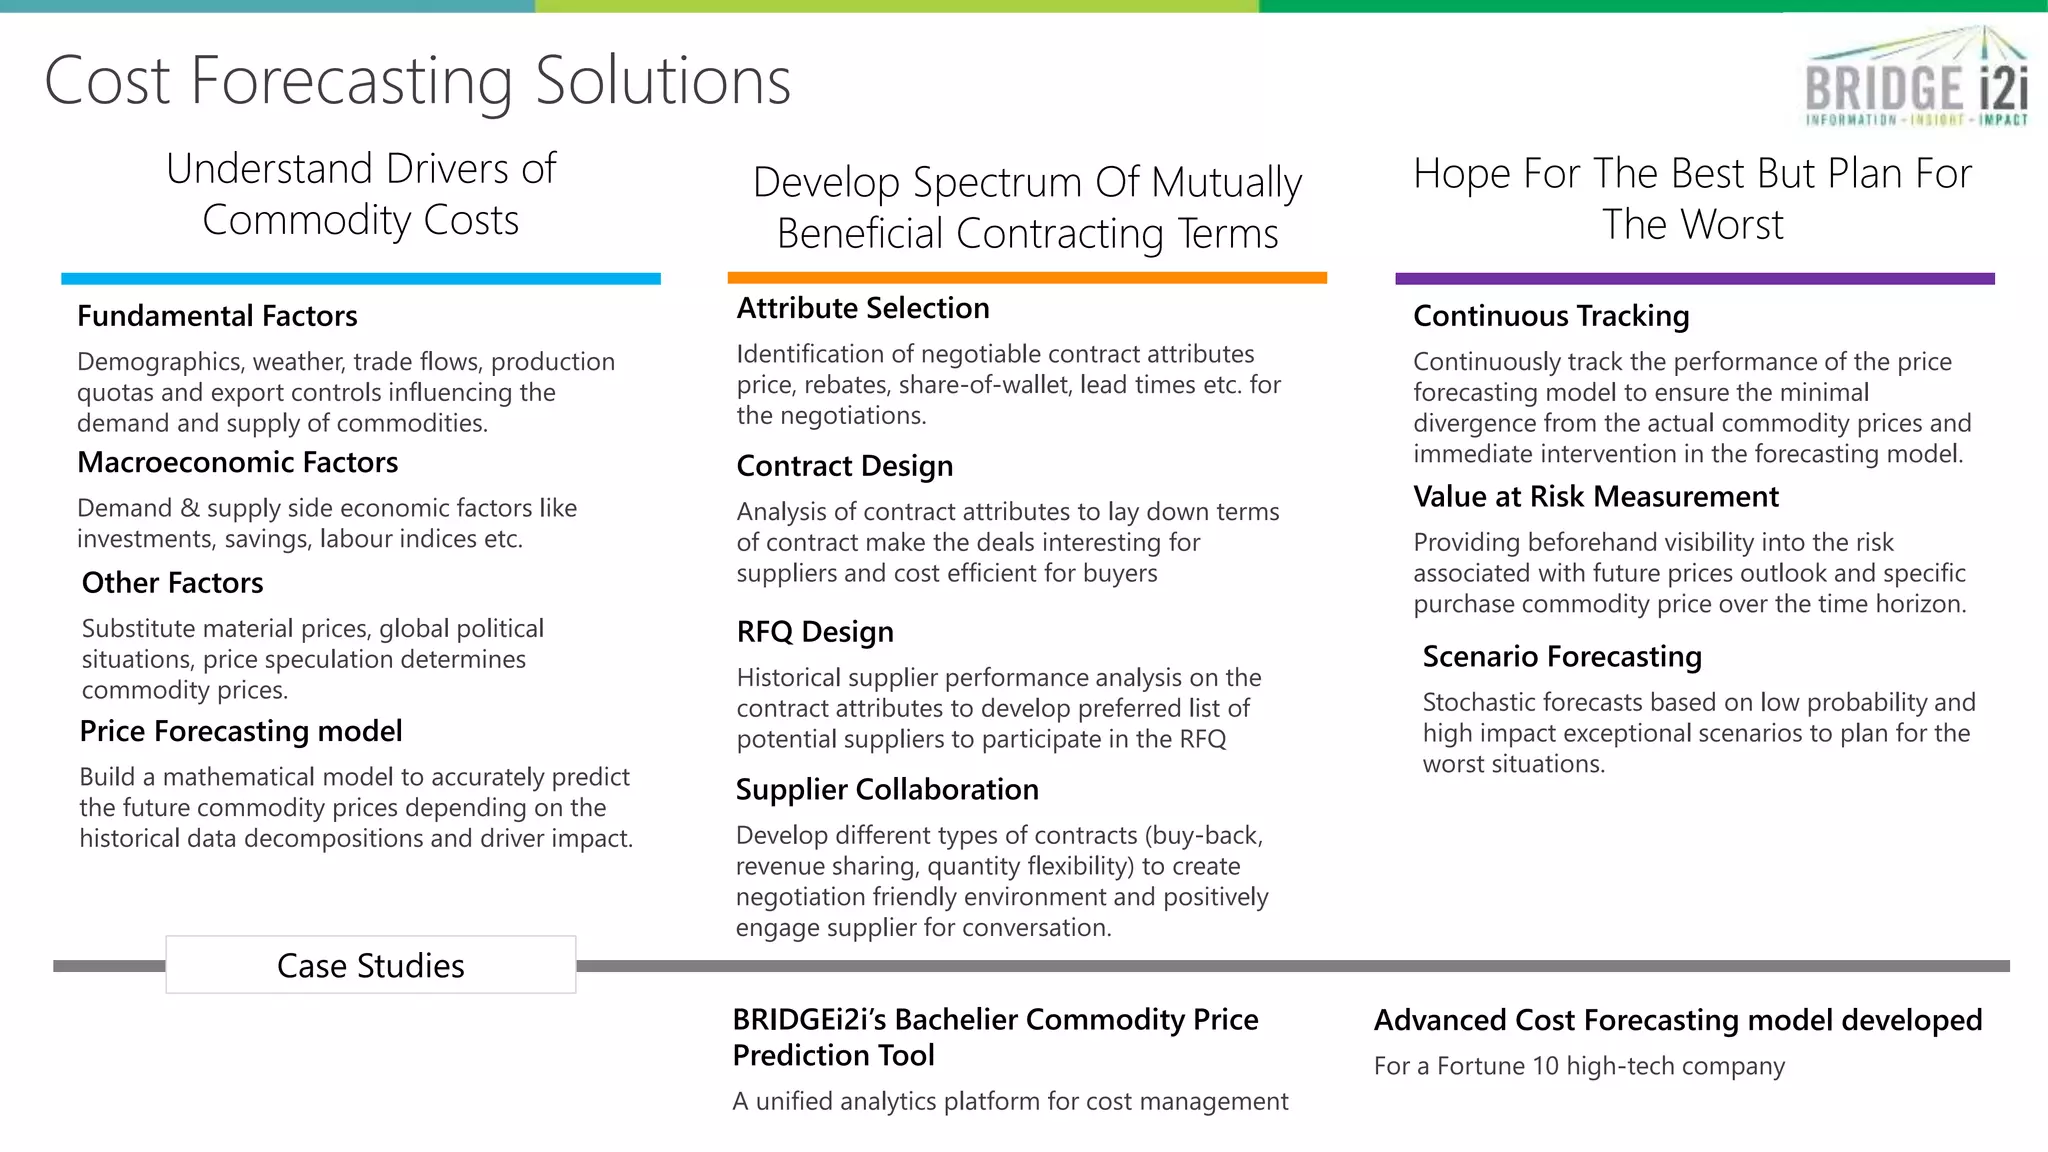
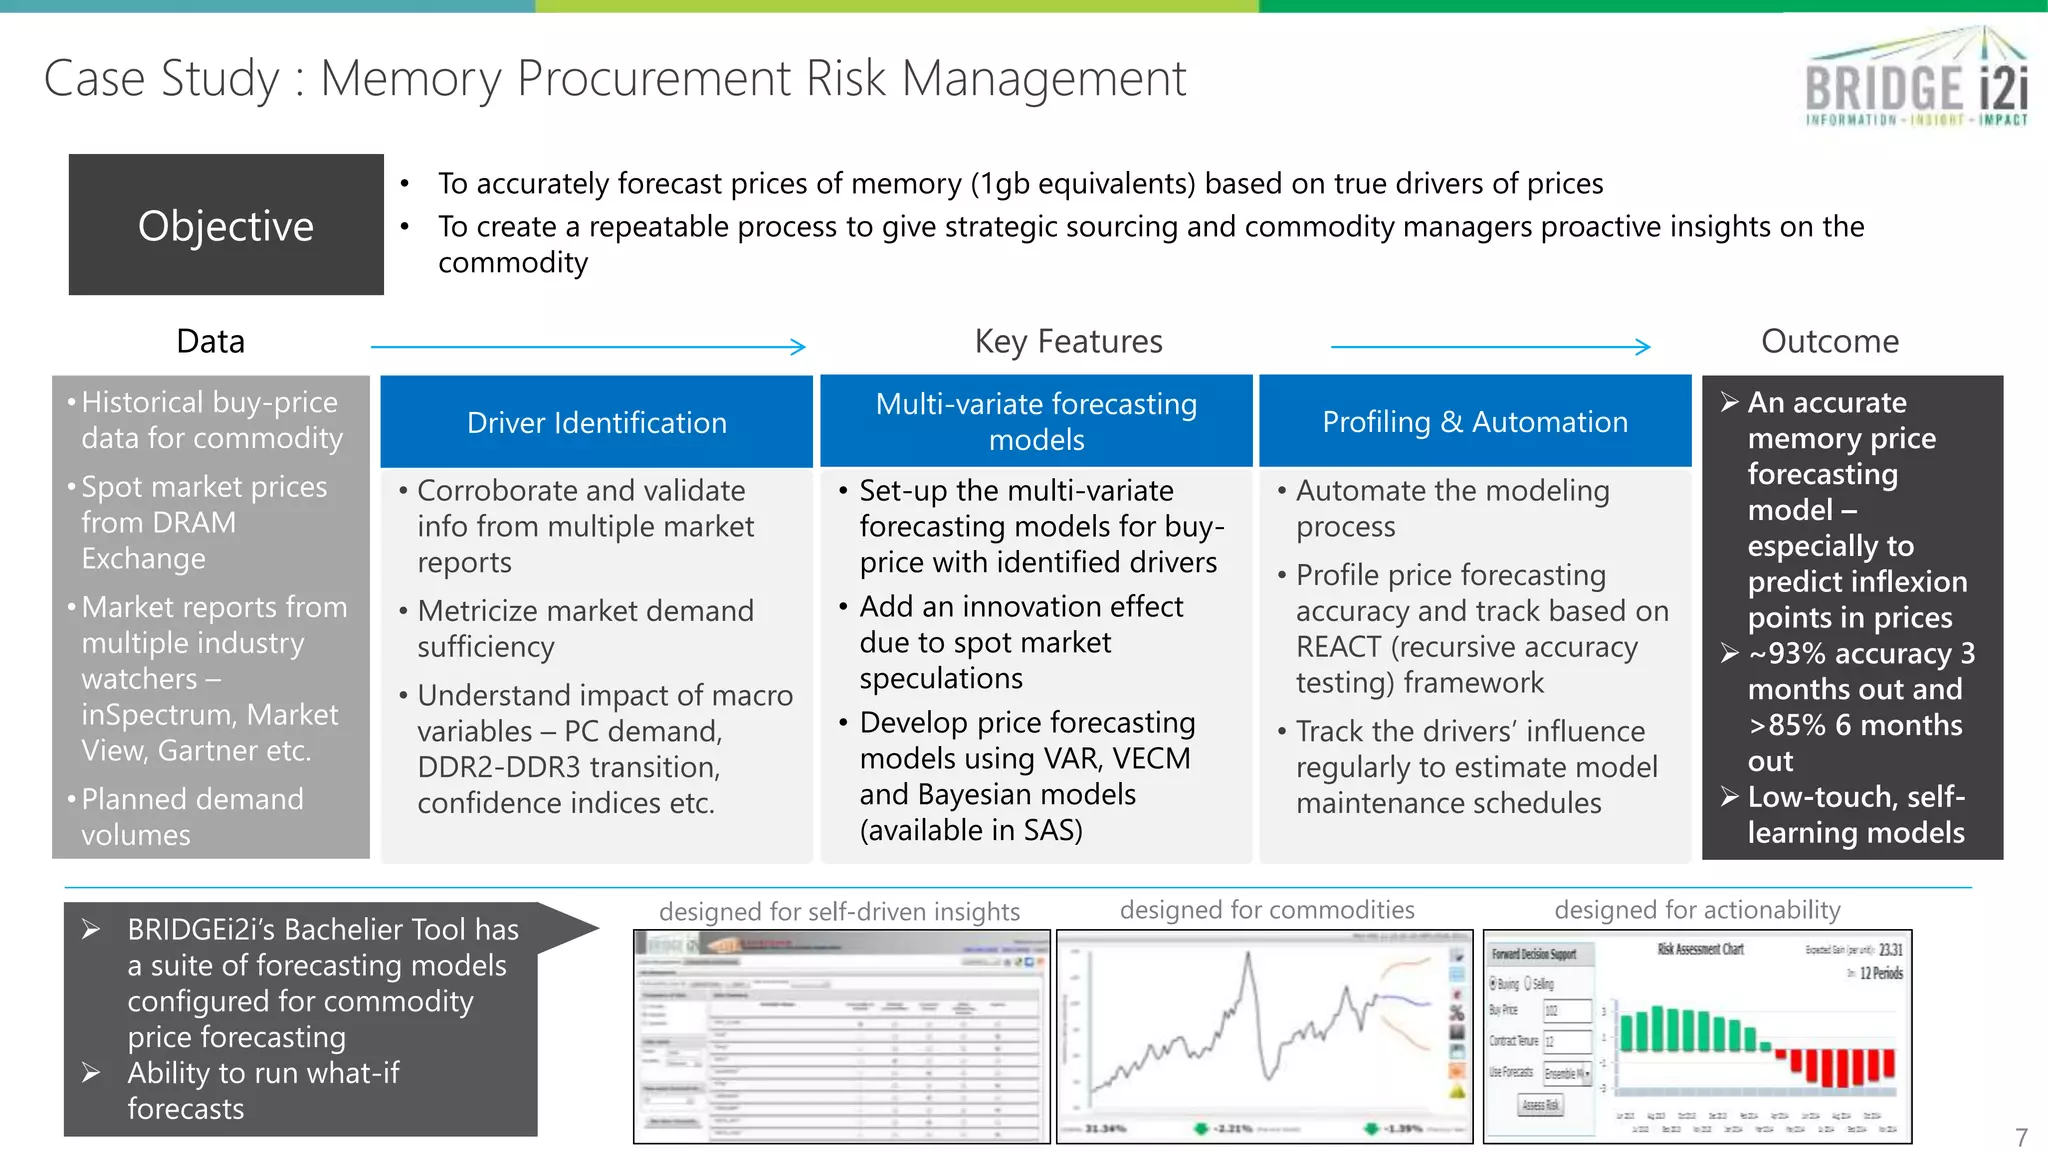
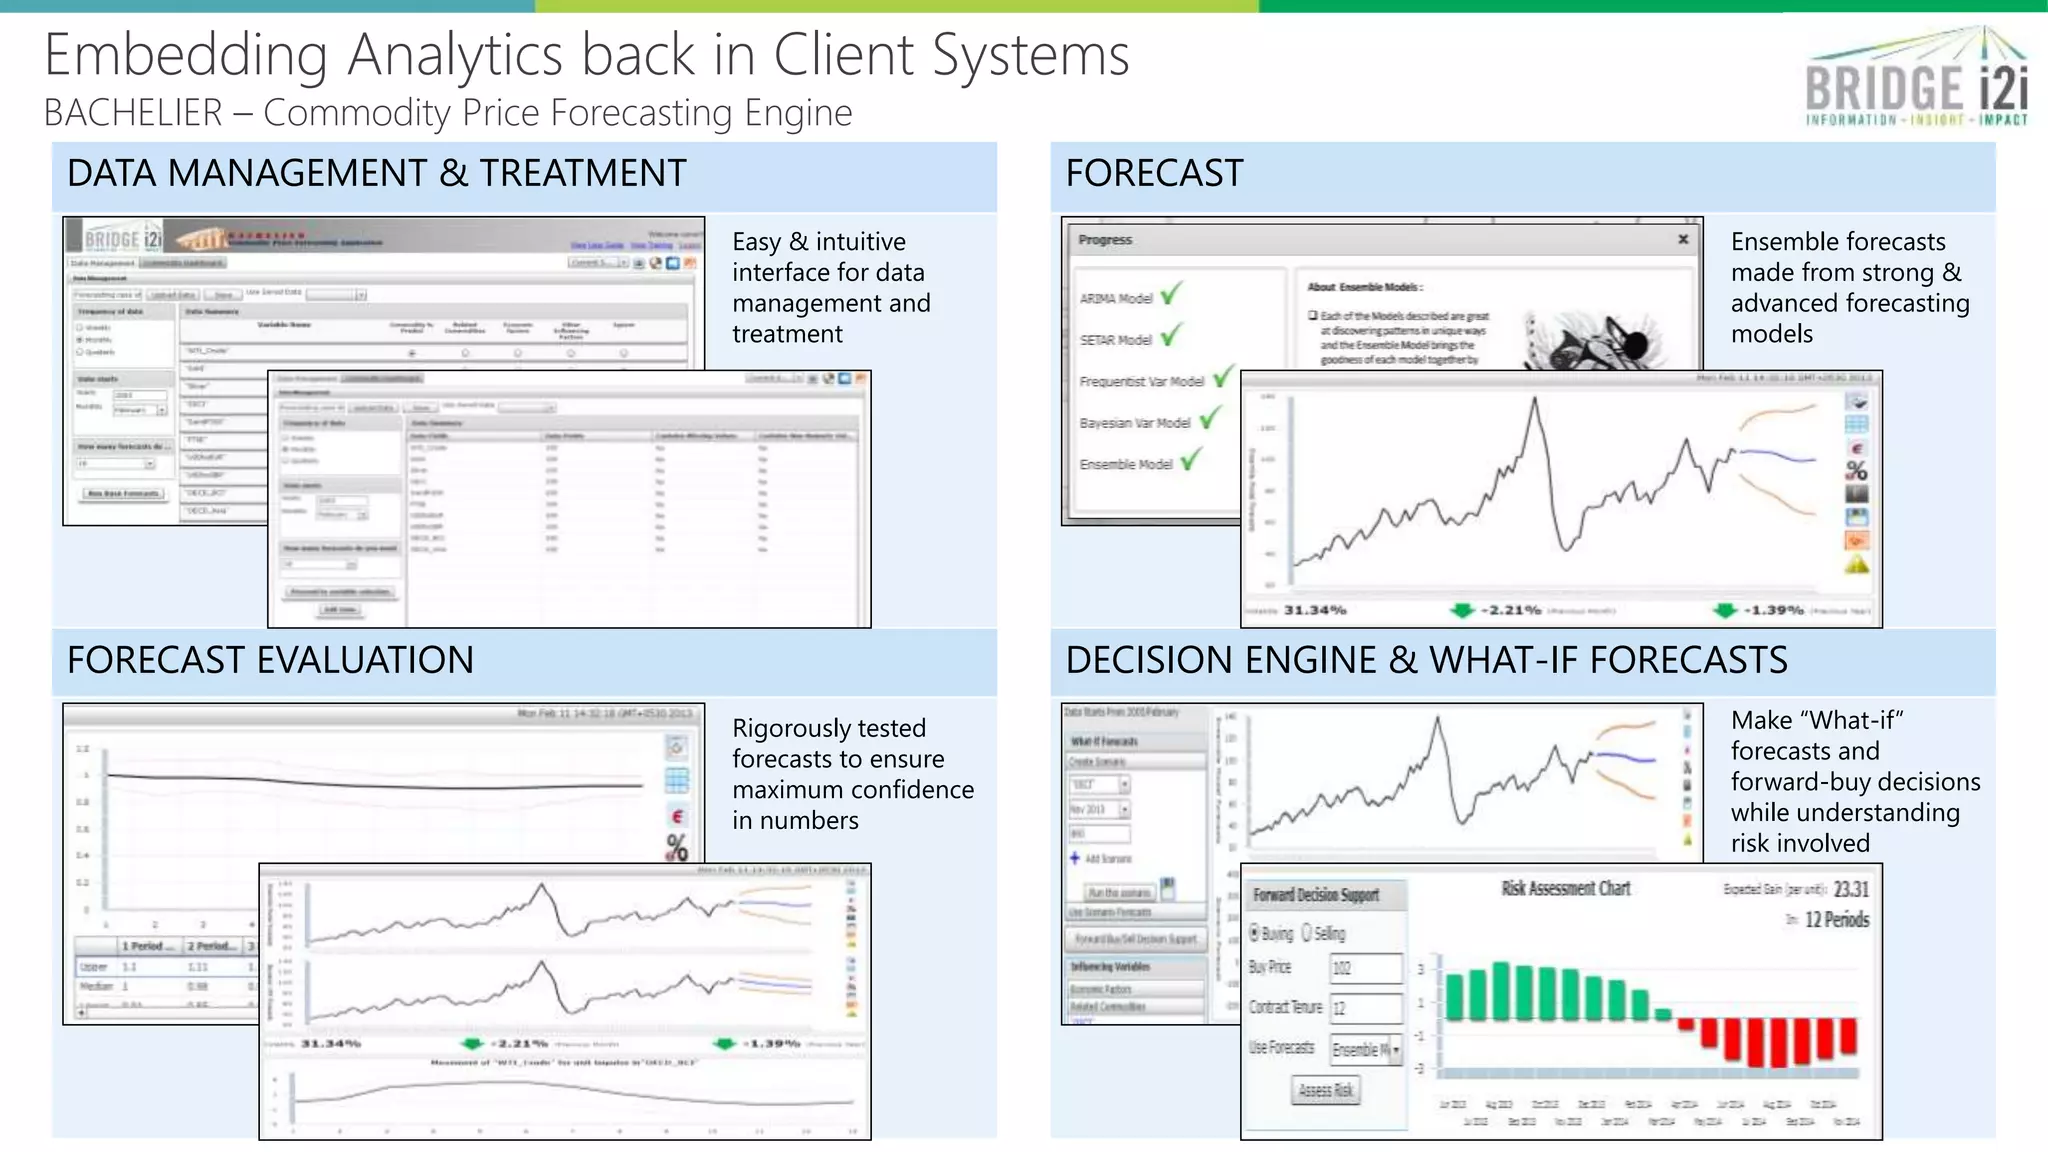
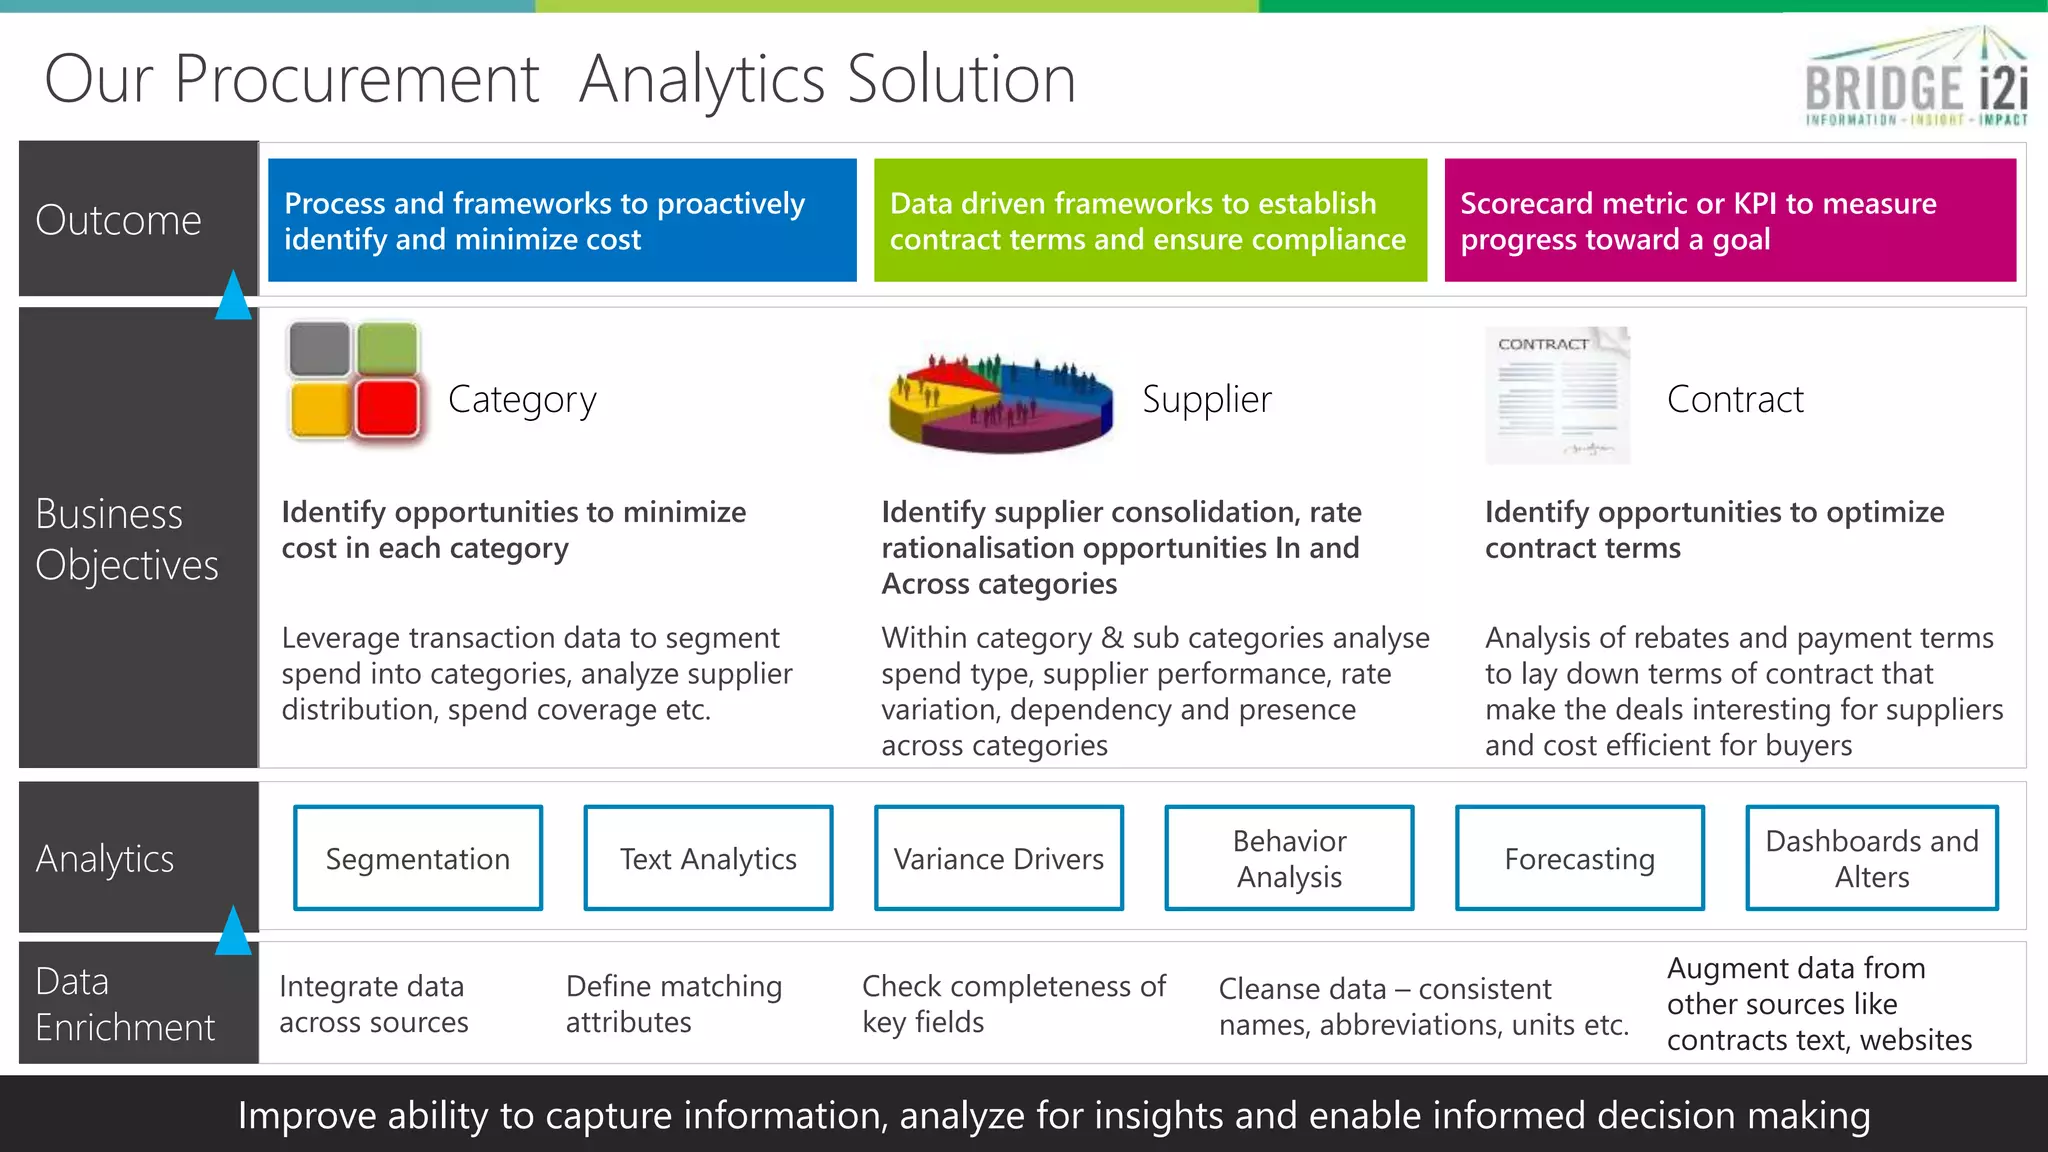
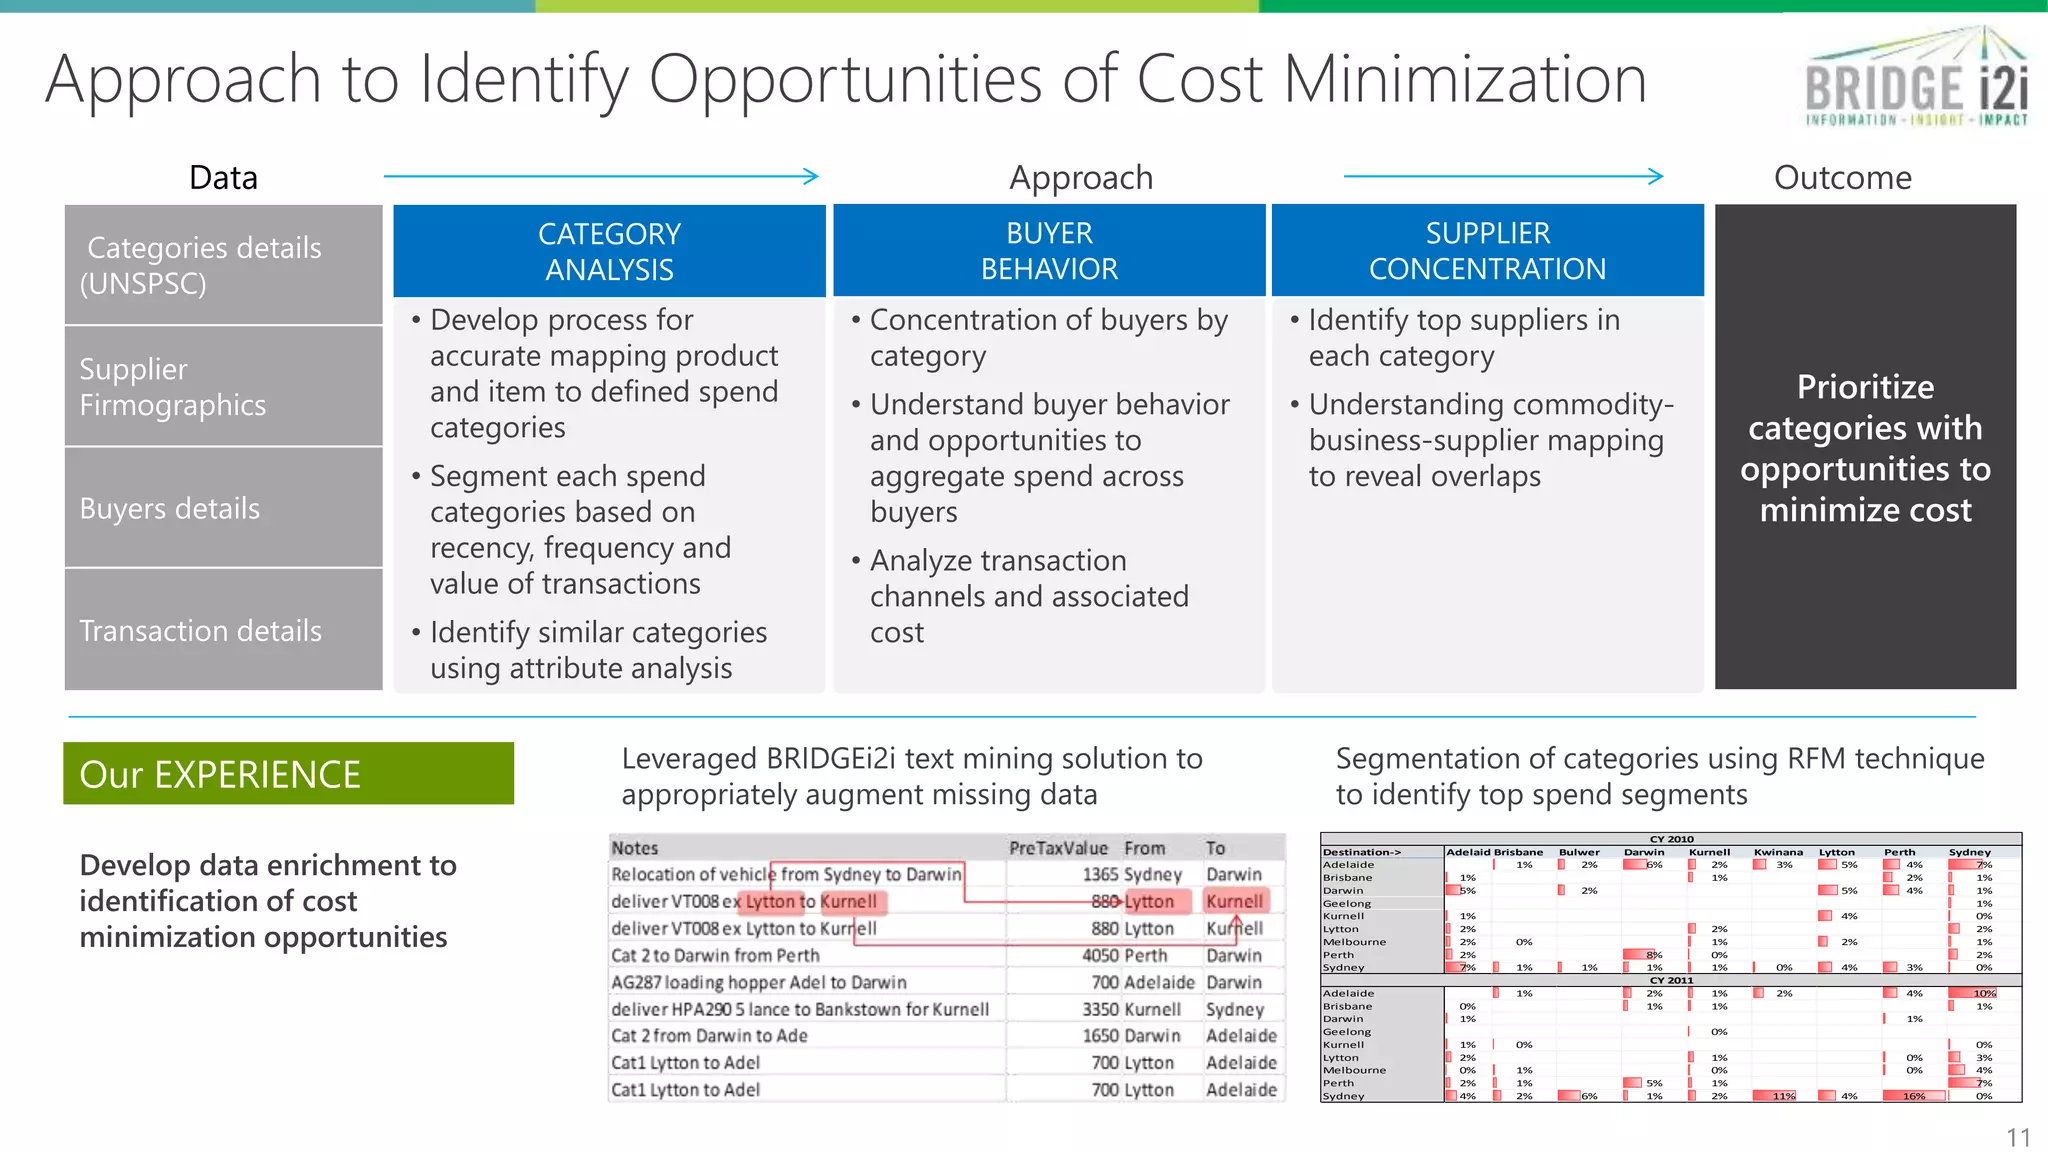
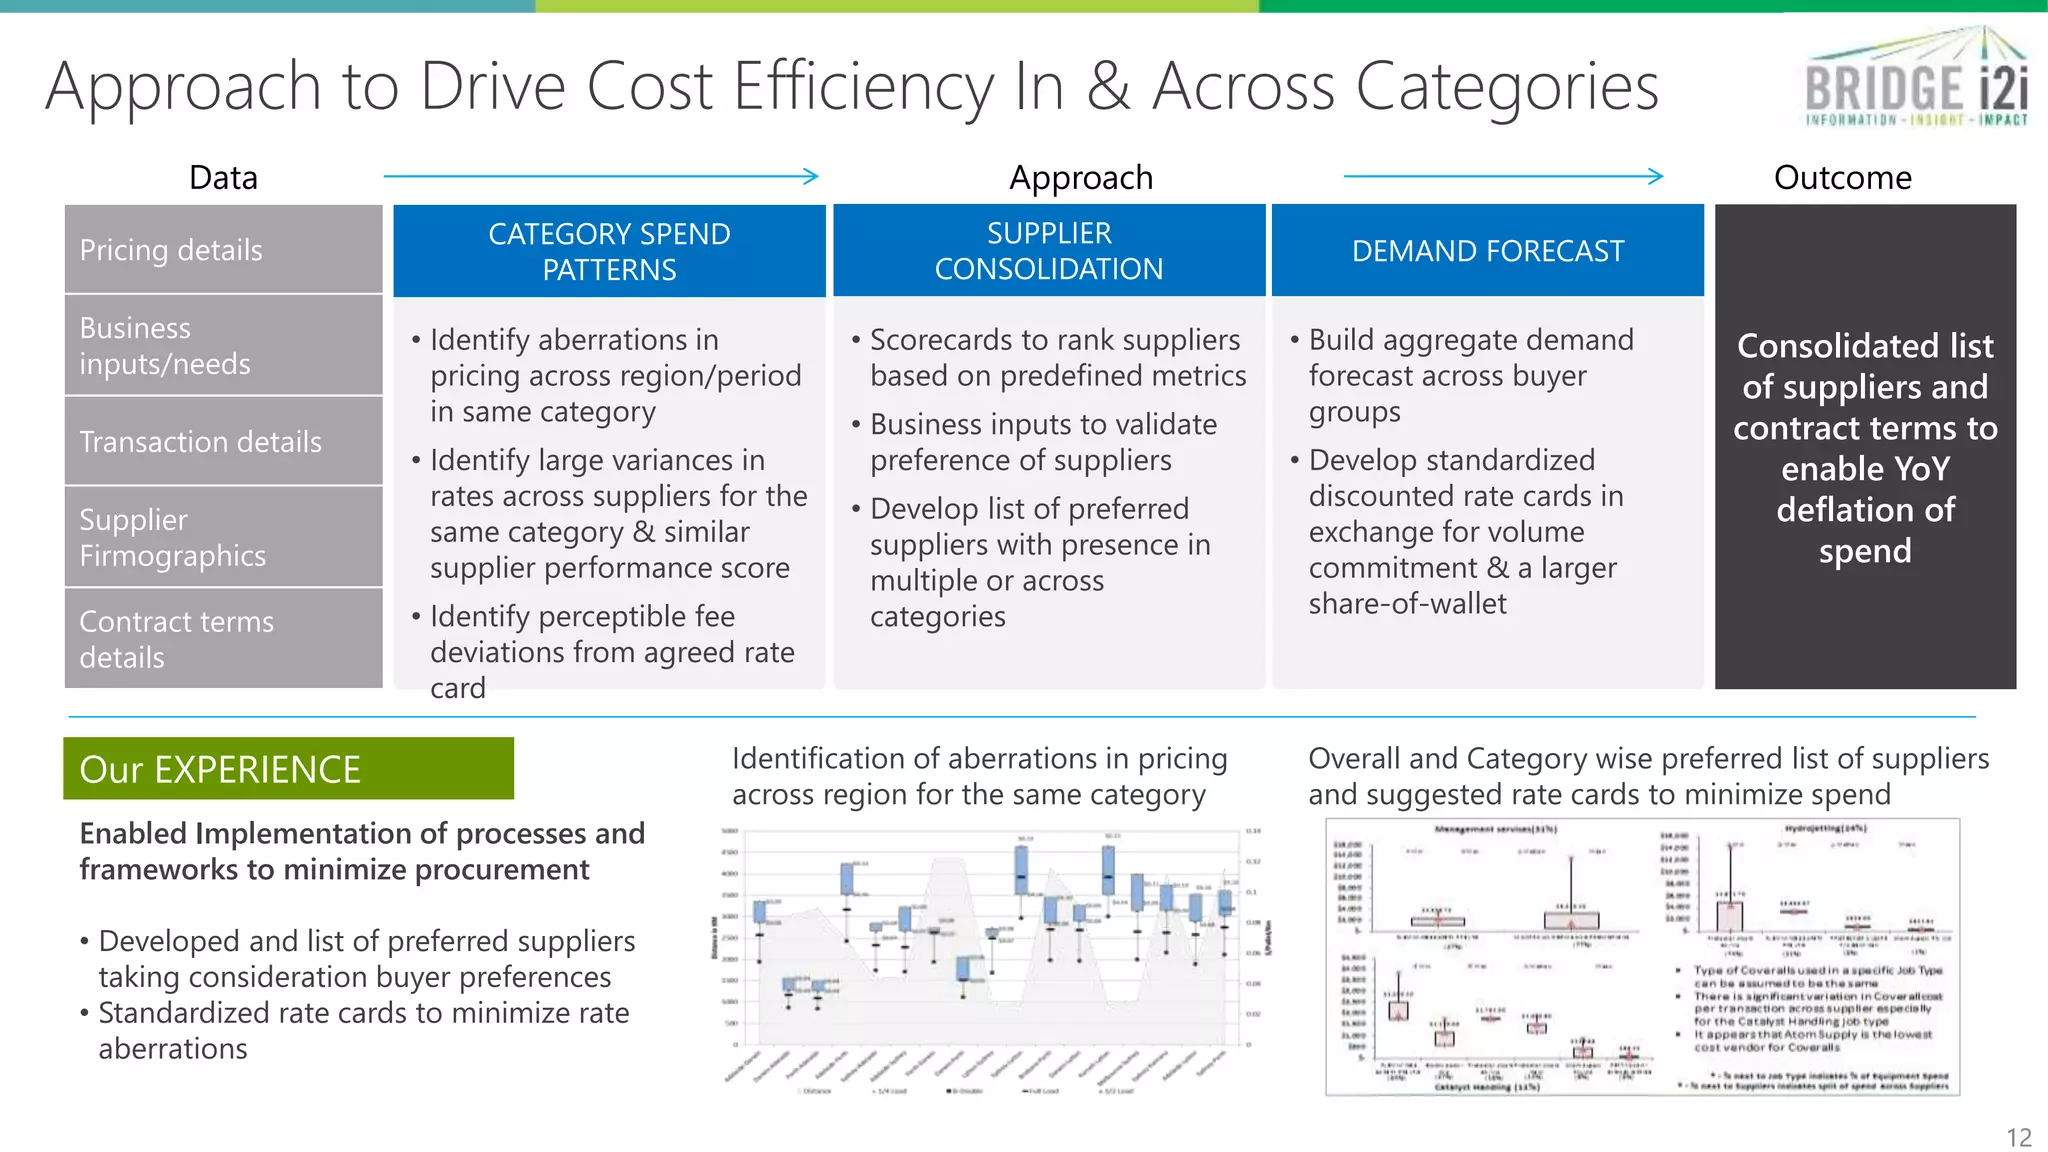
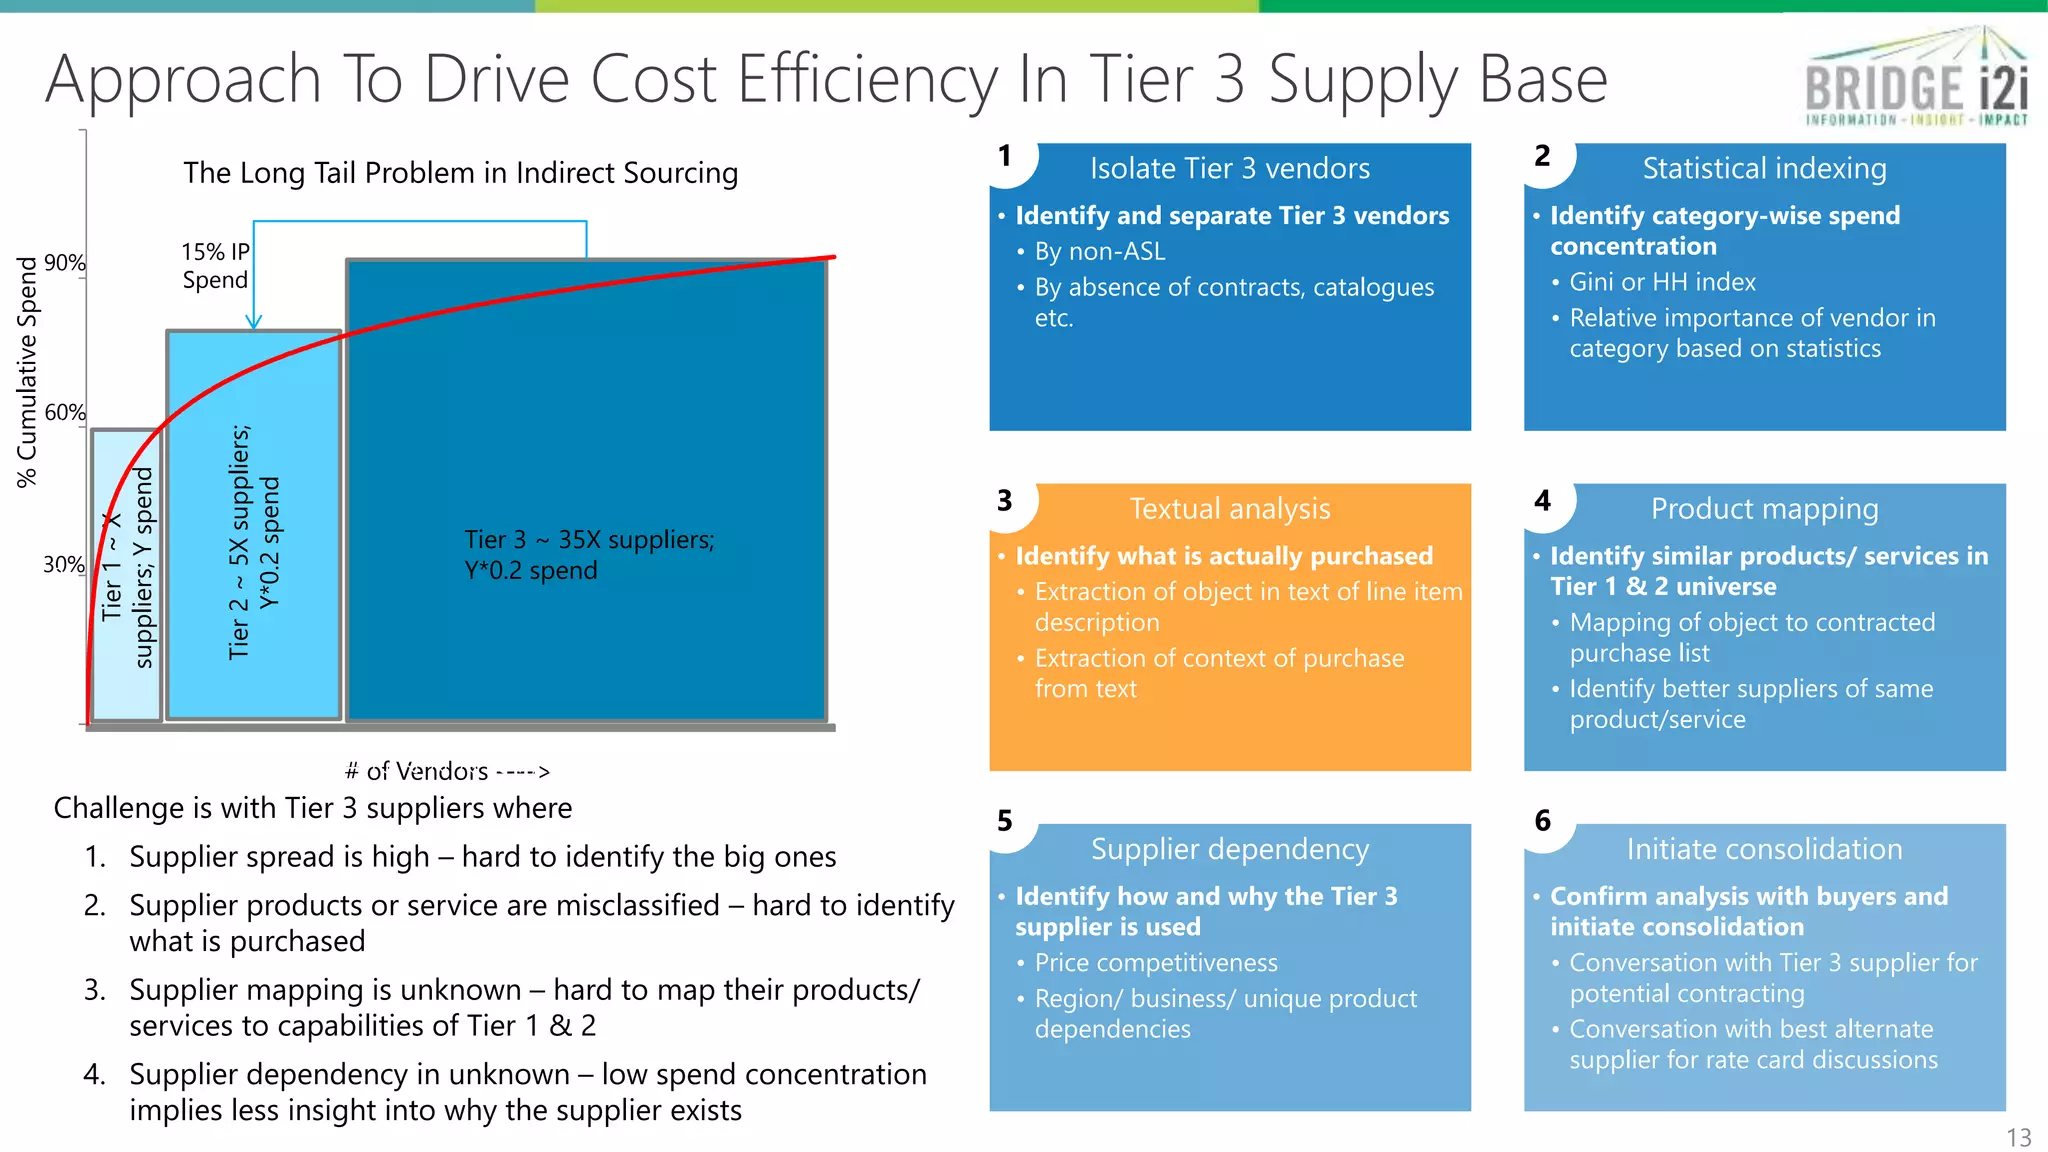


Bridgei2i Analytics offers comprehensive sourcing and procurement analytics solutions, including commodity intelligence, demand forecasting, and inventory optimization to enhance supply chain efficiency. They utilize advanced analytics frameworks to establish centers of expertise within organizations, providing actionable insights to drive cost savings and improve procurement strategies. Case studies illustrate successful implementations that led to significant ROI through predictive modeling and effective supplier management.


![[DSC Europe 25] Jakub Stech - AI for Public Good: How Data and AI Can Transfo...](https://cdn.slidesharecdn.com/ss_thumbnails/ayuupcru6ggr9f7vbp0q-1-251215095918-7b7334a3-thumbnail.jpg?width=640&height=640&fit=bounds)

![[DSC Europe 25] Debmalya Biswas - Agentification: the art of transforming man...](https://cdn.slidesharecdn.com/ss_thumbnails/r5azlggvtqiaiiusrqdr-4-251212103249-5a12c89b-thumbnail.jpg?width=640&height=640&fit=bounds)
![[DSC Europe 25] Nikolay Burlutskiy - Best Practices for Building Enterprise M...](https://cdn.slidesharecdn.com/ss_thumbnails/uirvaiuvq8y1w8hzd9tx-7-251212103249-2619edb4-thumbnail.jpg?width=640&height=640&fit=bounds)
![[DSC Europe 25] Ivan Petrovic - Is it really that expensive to build an AI sy...](https://cdn.slidesharecdn.com/ss_thumbnails/ybqhdwvusbg7jms3doxh-9-251216105605-7aab5a10-thumbnail.jpg?width=640&height=640&fit=bounds)

![[DSC Europe 25] Behzad Hosseini - AI Agents in the Wild: Deploying Models tha...](https://cdn.slidesharecdn.com/ss_thumbnails/3qtejajvsjqrzwfept2c-10-251212103250-7f2b1068-thumbnail.jpg?width=640&height=640&fit=bounds)

![[DSC Europe 25] Danica Soc - The Science Behind Marketing: Experimentation me...](https://cdn.slidesharecdn.com/ss_thumbnails/c0nofsggs9gw5ucmallr-3-251216103155-56bd64d1-thumbnail.jpg?width=640&height=640&fit=bounds)


![[DSC Europe 25] Francisco Prado Moreno - Model Validation in the Age of AI: T...](https://cdn.slidesharecdn.com/ss_thumbnails/2igqvkir1yd2yzlhoylg-3-251215095918-6676c4e6-thumbnail.jpg?width=640&height=640&fit=bounds)
![[DSC Europe 25] Marko Djordjevic - AI can help Agriculture.pptx](https://cdn.slidesharecdn.com/ss_thumbnails/c0huq0ztiubmgccem2hc-marko-djordjevic-ai-can-help-agriculture-251218125253-7606f036-thumbnail.jpg?width=640&height=640&fit=bounds)
![[DSC Europe 25] Kaja Kandare - LLM as a judge.pptx](https://cdn.slidesharecdn.com/ss_thumbnails/arxyccaxsdsd1ba99wjw-7-251212104007-2b4e3f64-thumbnail.jpg?width=640&height=640&fit=bounds)


