Downloaded 111 times


The document discusses the importance of talent analytics in optimizing recruiting processes, emphasizing the need for predictive analytics and data integrity. It highlights challenges such as relying on outdated metrics and the lack of standardized data collection methods, along with strategies for improving recruitment efficiency and quality through data-driven decision-making. The document also explores various performance metrics and their implications for hiring practices, suggesting that effective storytelling with data can significantly influence talent acquisition success.
The presentation introduces Talent Analytics, emphasizing the importance of data in recruitment.
An overview of current state metrics, future predictions, storytelling with data, and the importance of data integrity.
A quote highlighting the essential role of data in decision-making, illustrating the necessity of insights.
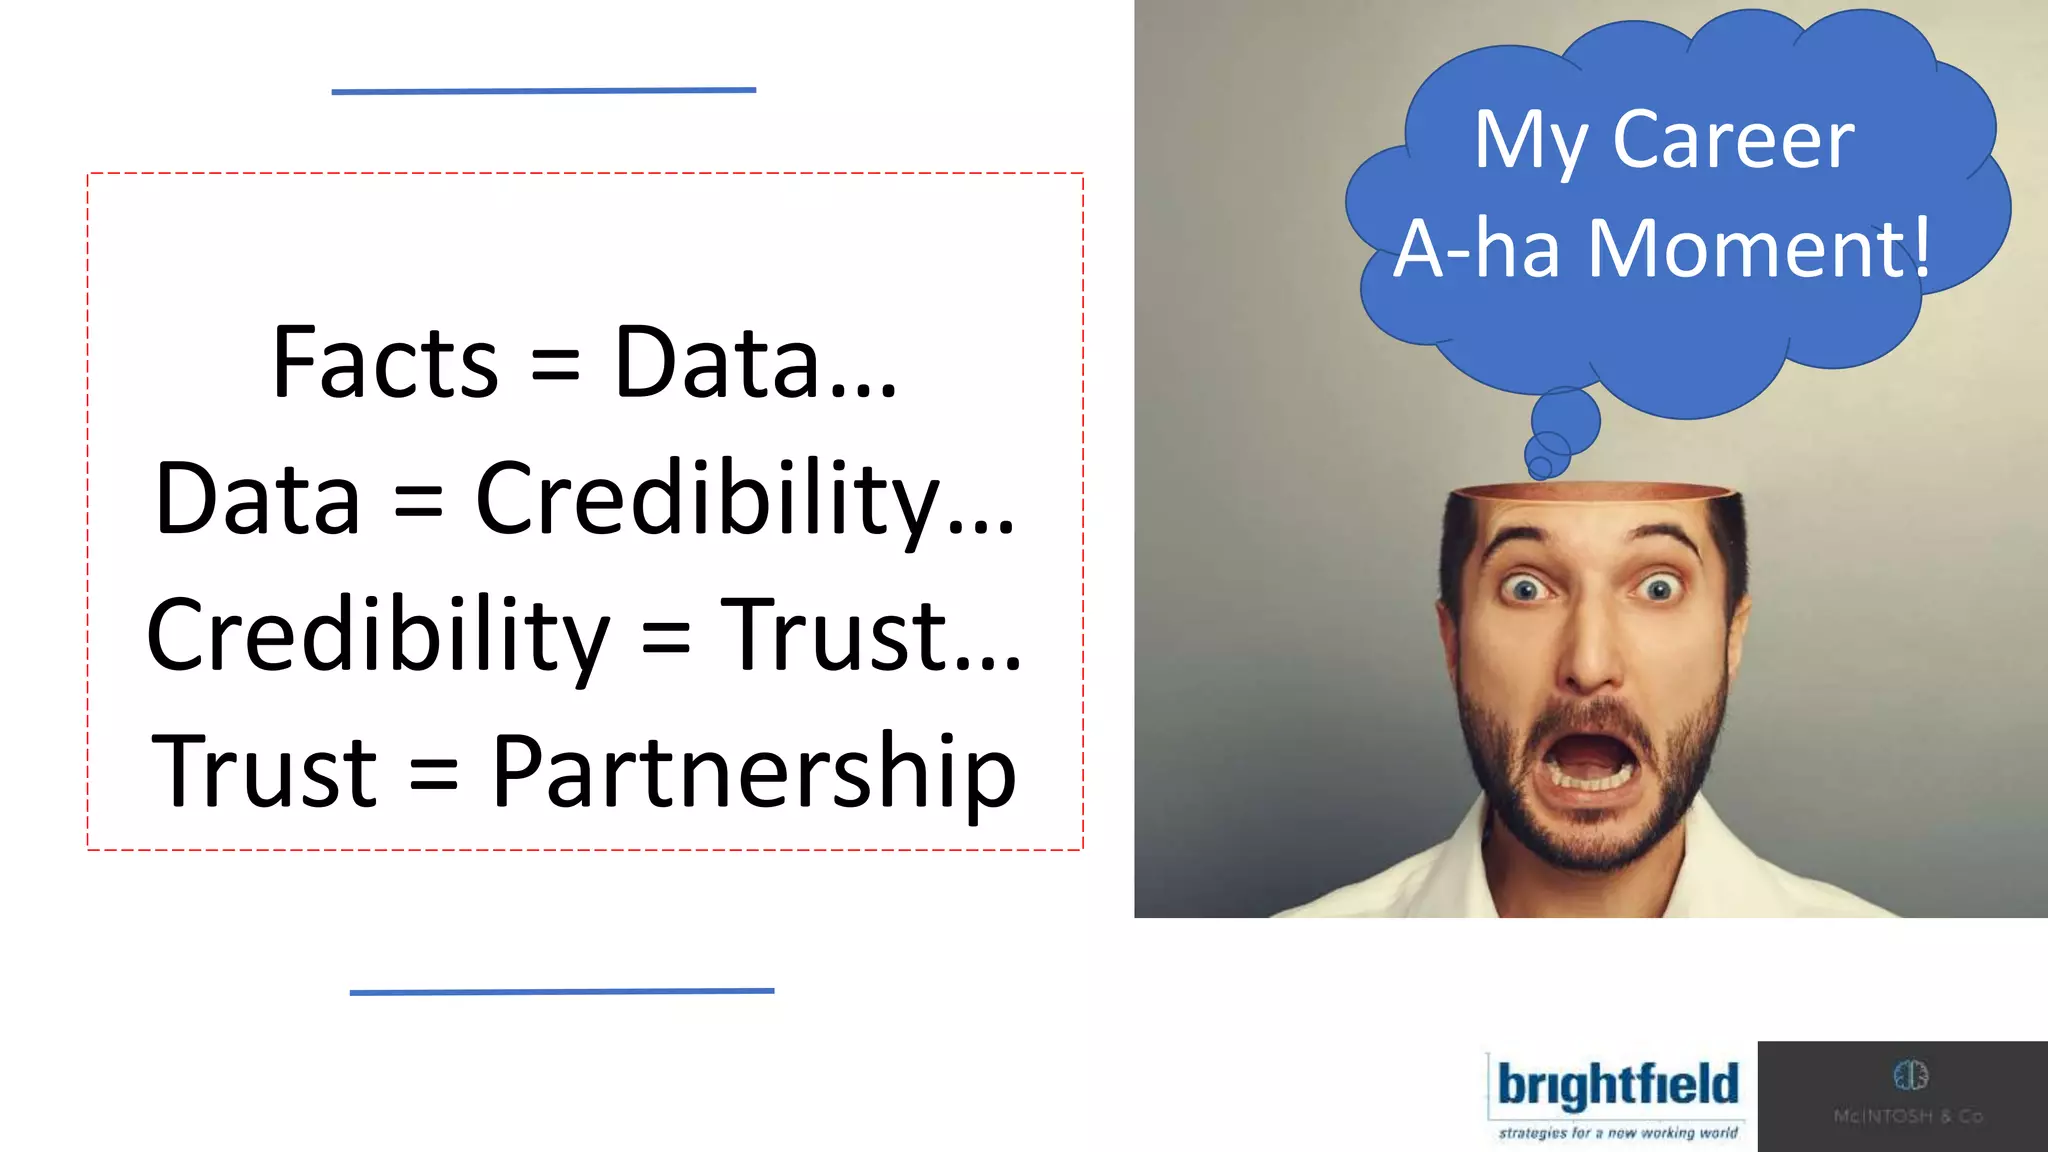
Personal anecdotes regarding the journey to understanding the value of data, establishing trust through credibility.
Discussion on the limitations of current recruiting metrics, focusing on historical rather than predictive approaches.
Survey results reflecting organizational engagement with data analytics, including adoption rates and existing solutions.
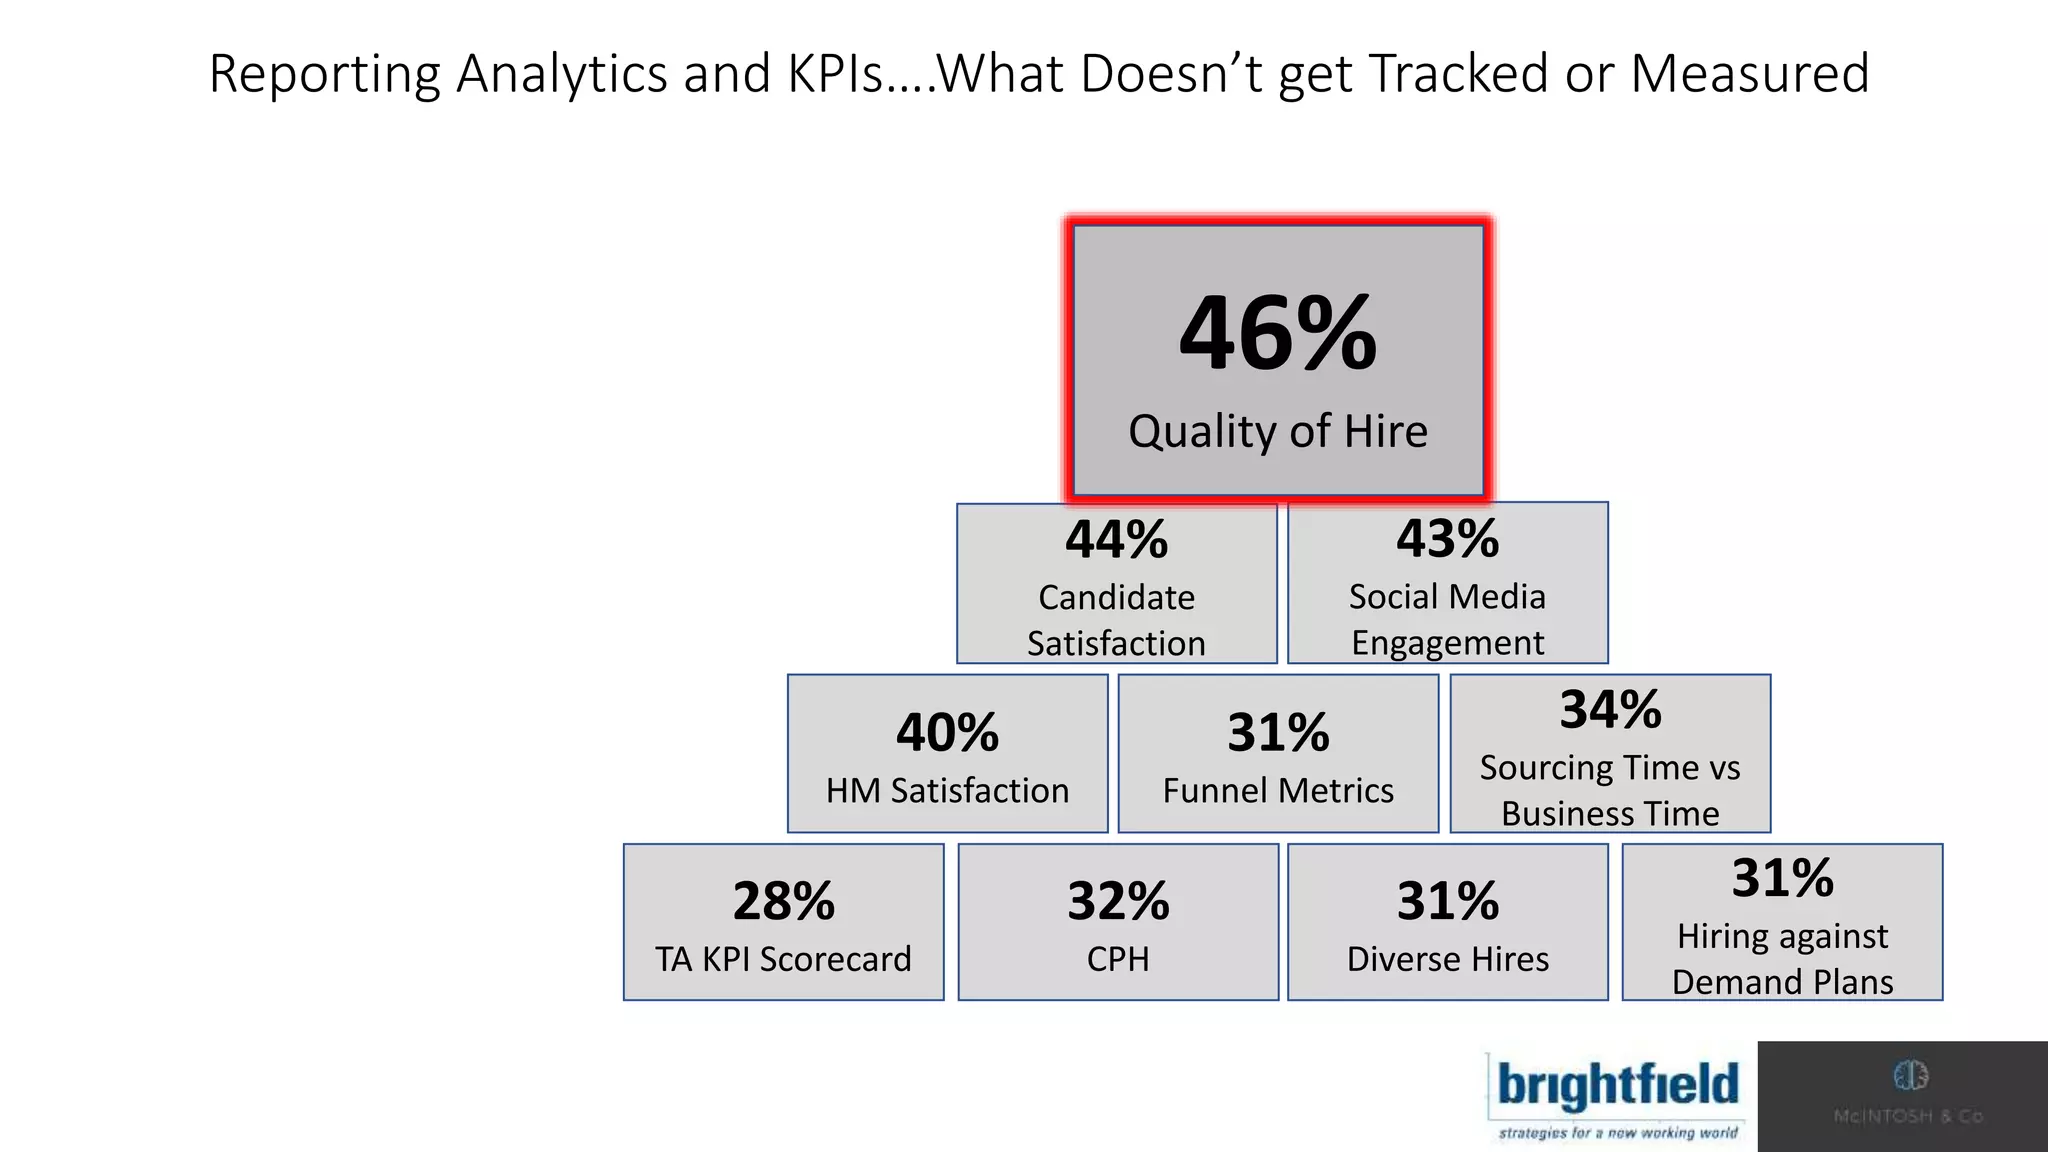
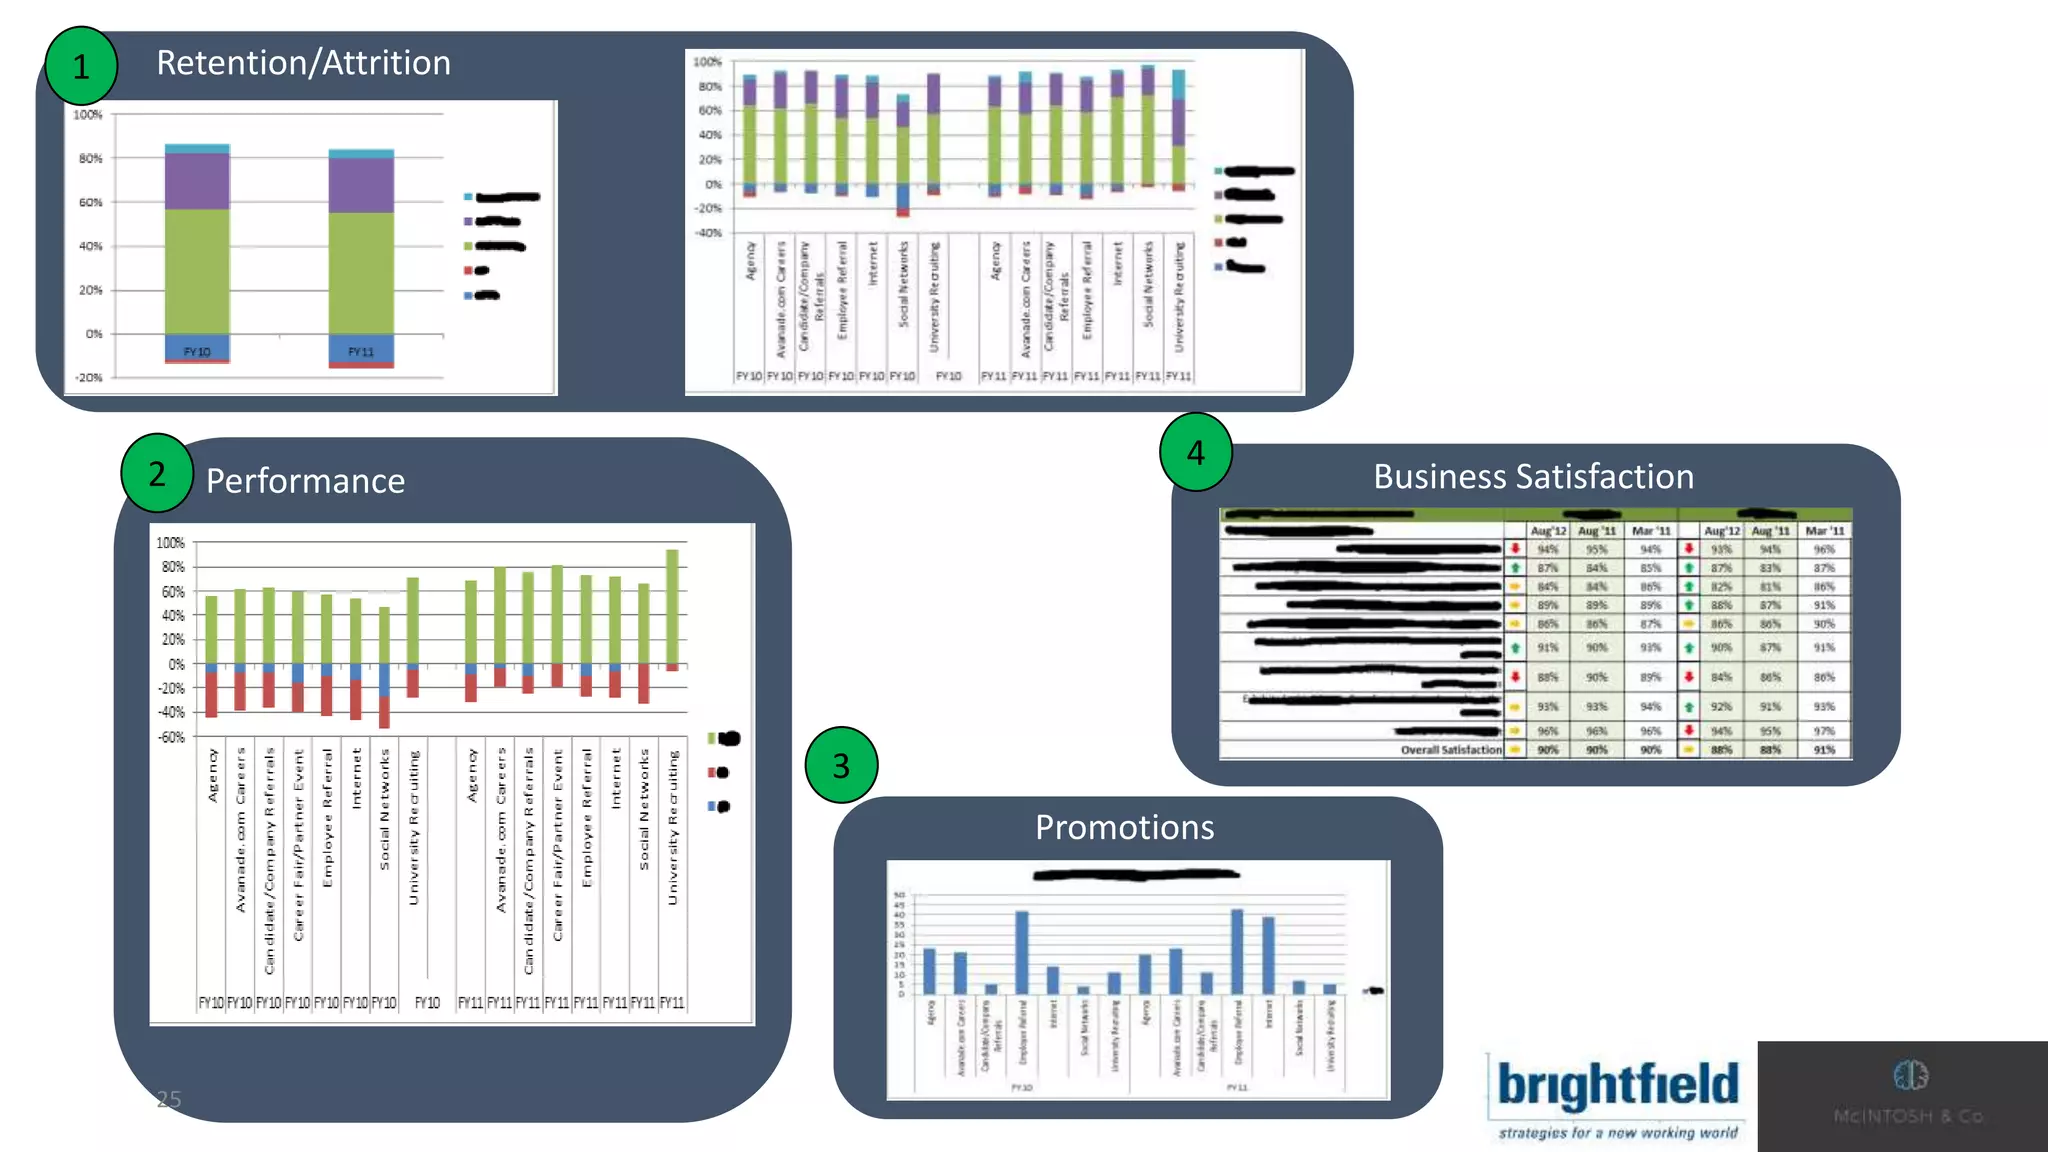
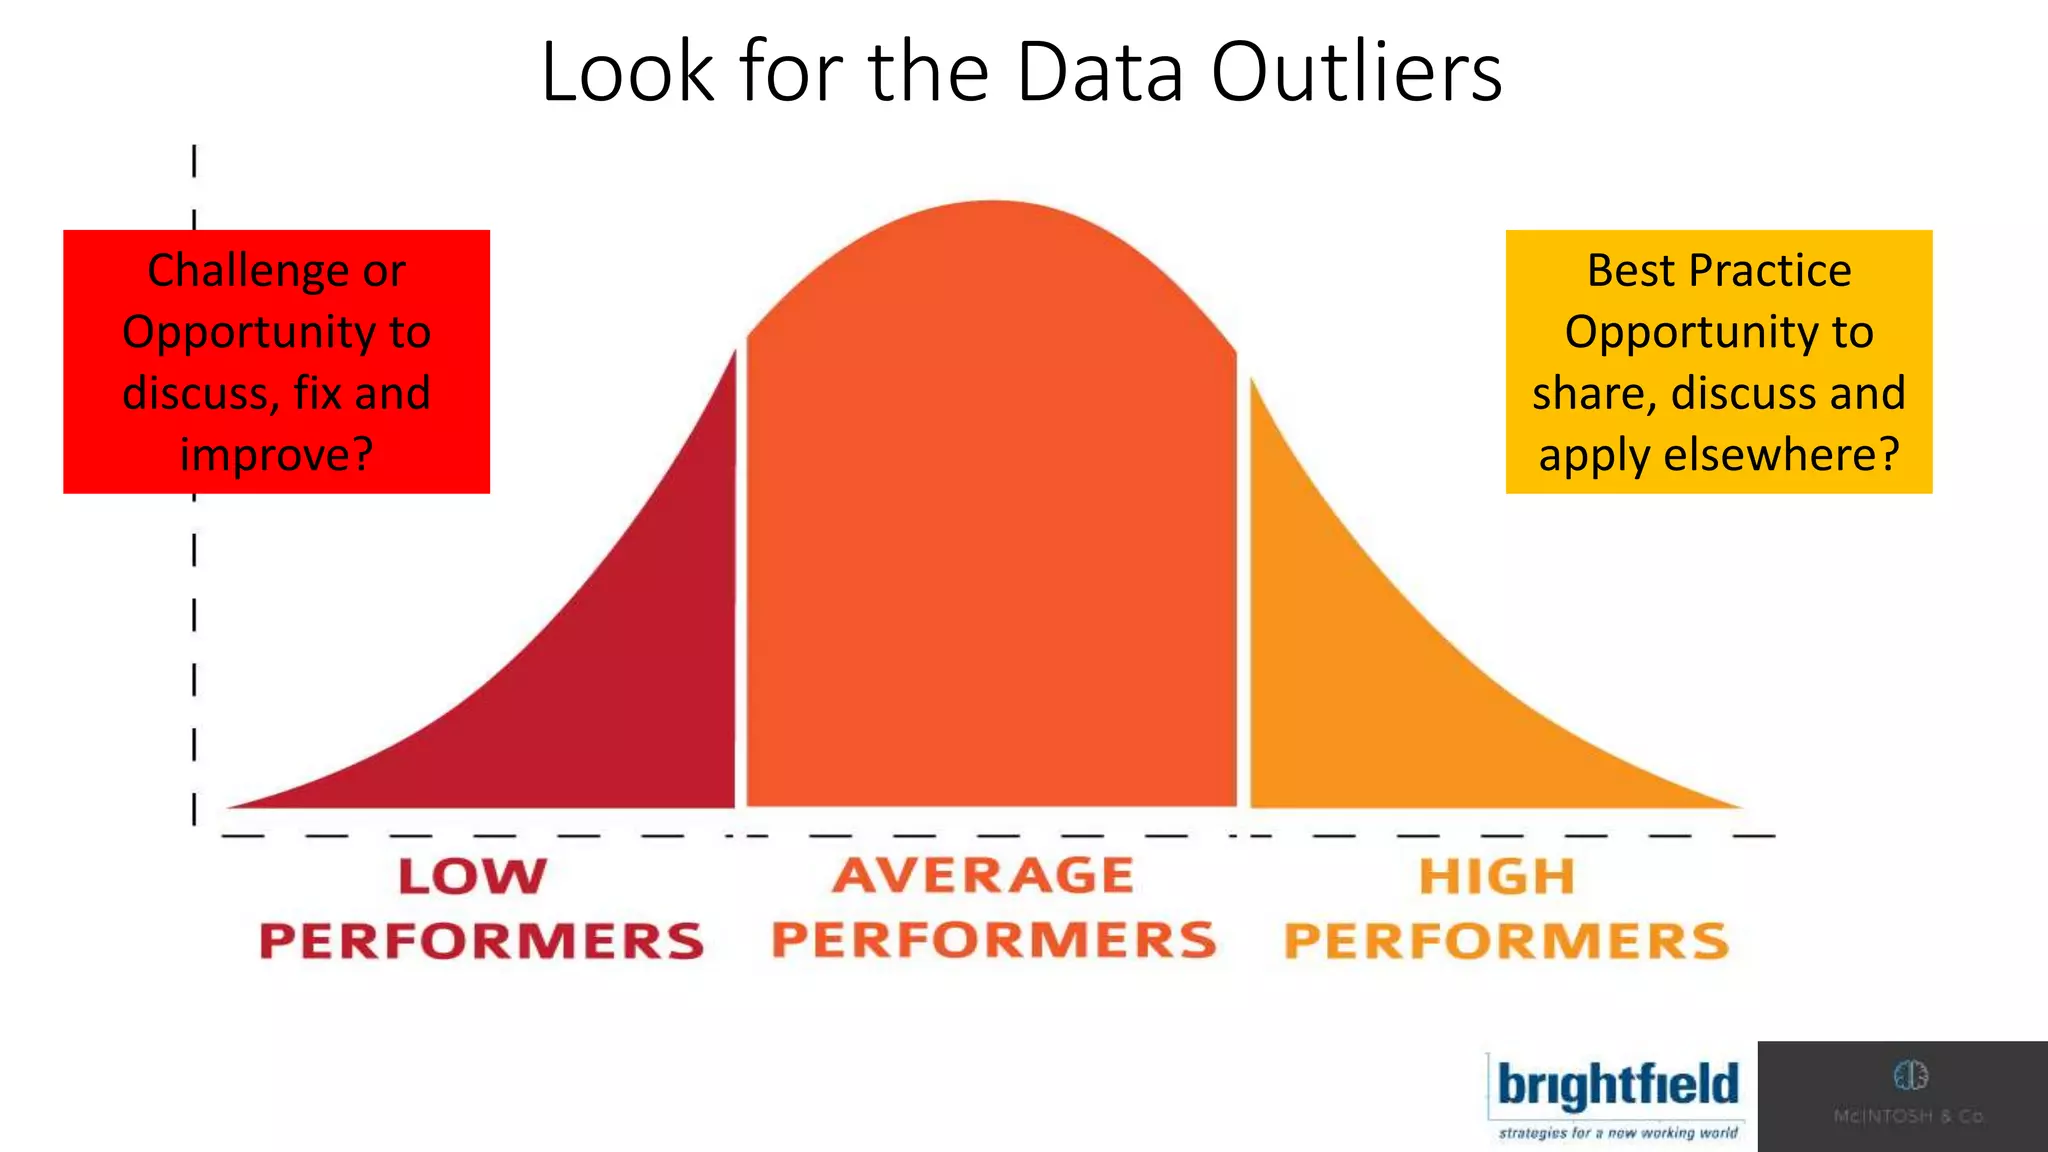
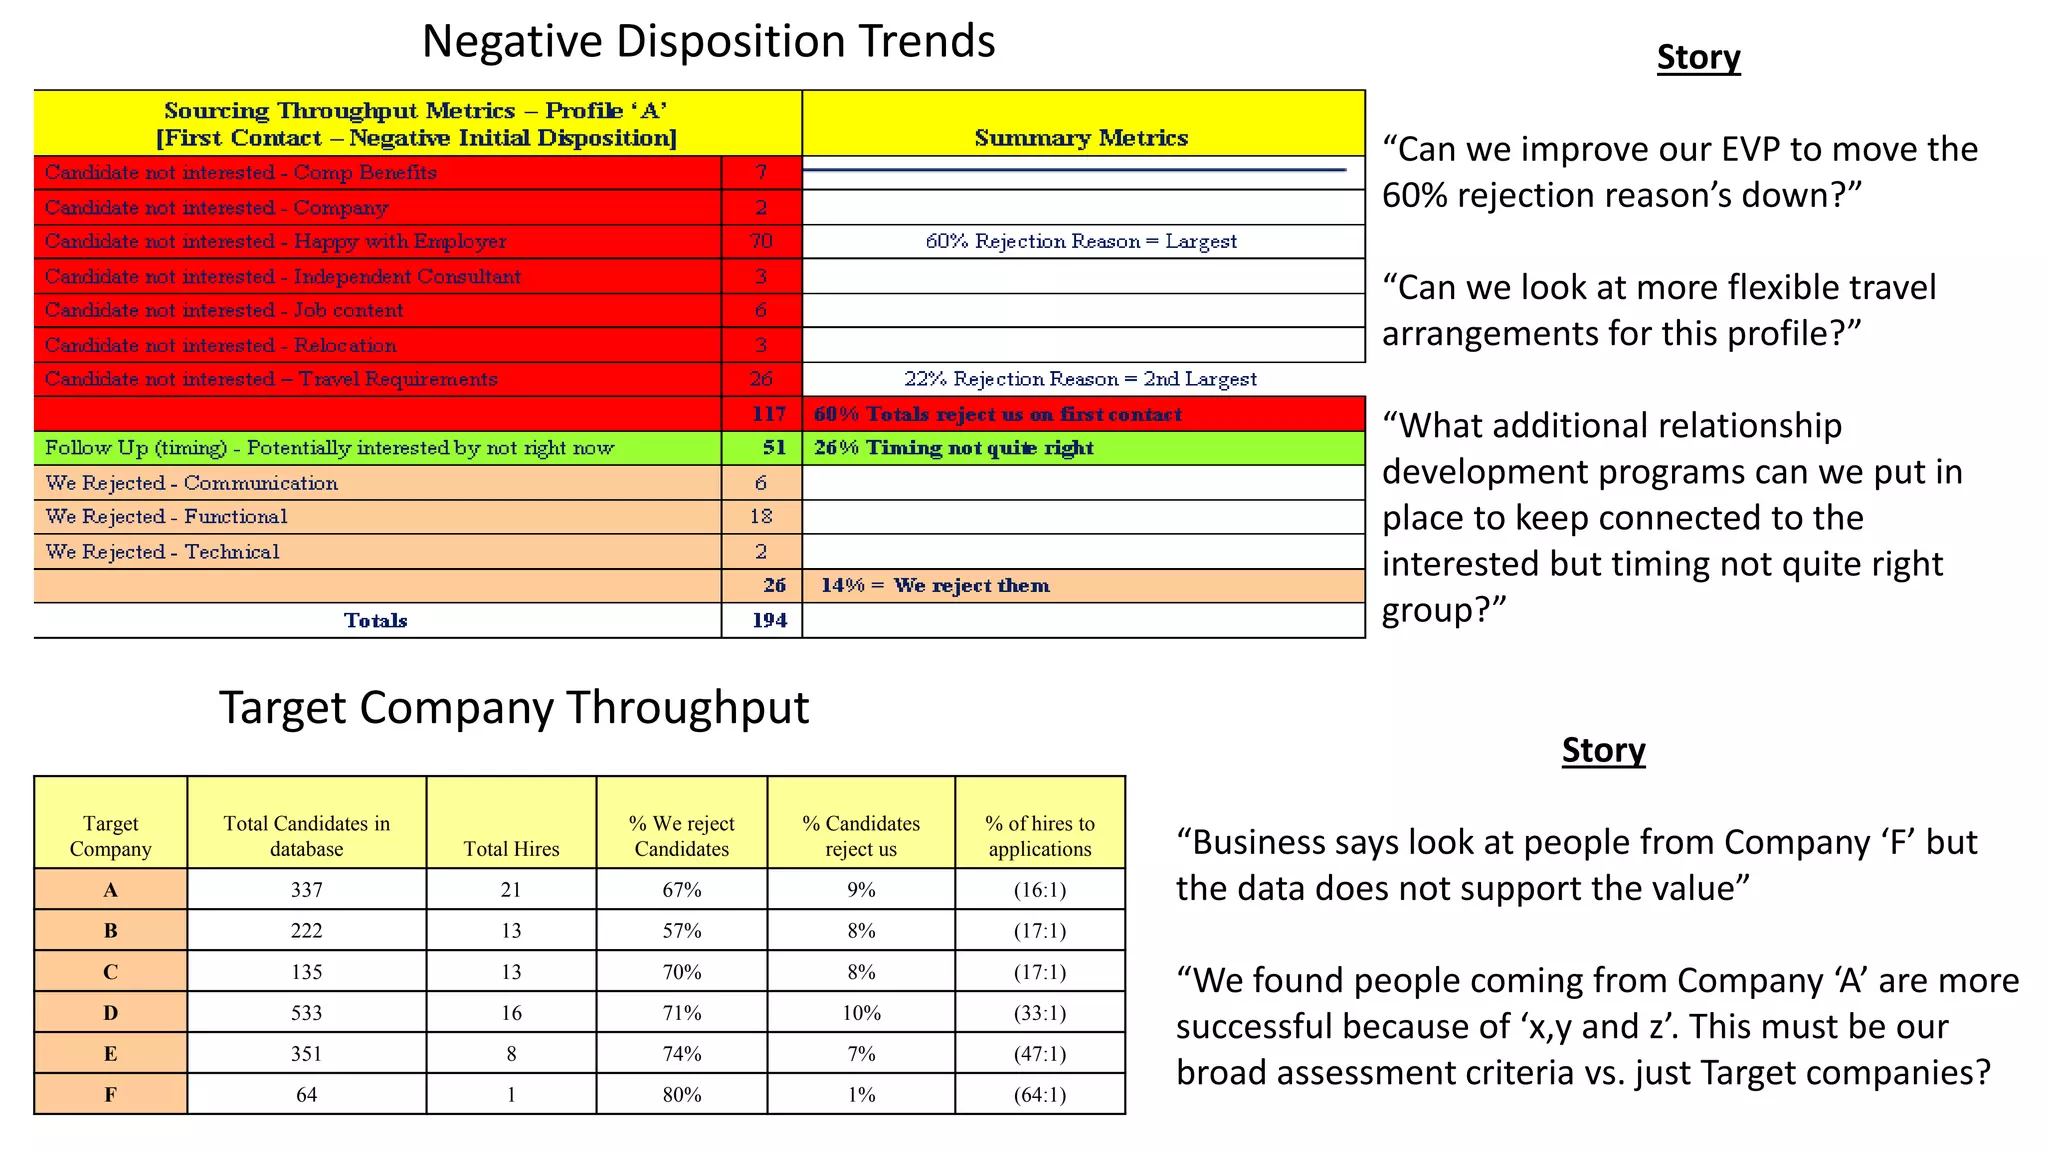
Issues with unmeasured metrics around various recruitment aspects, revealing critical KPIs that are often overlooked.
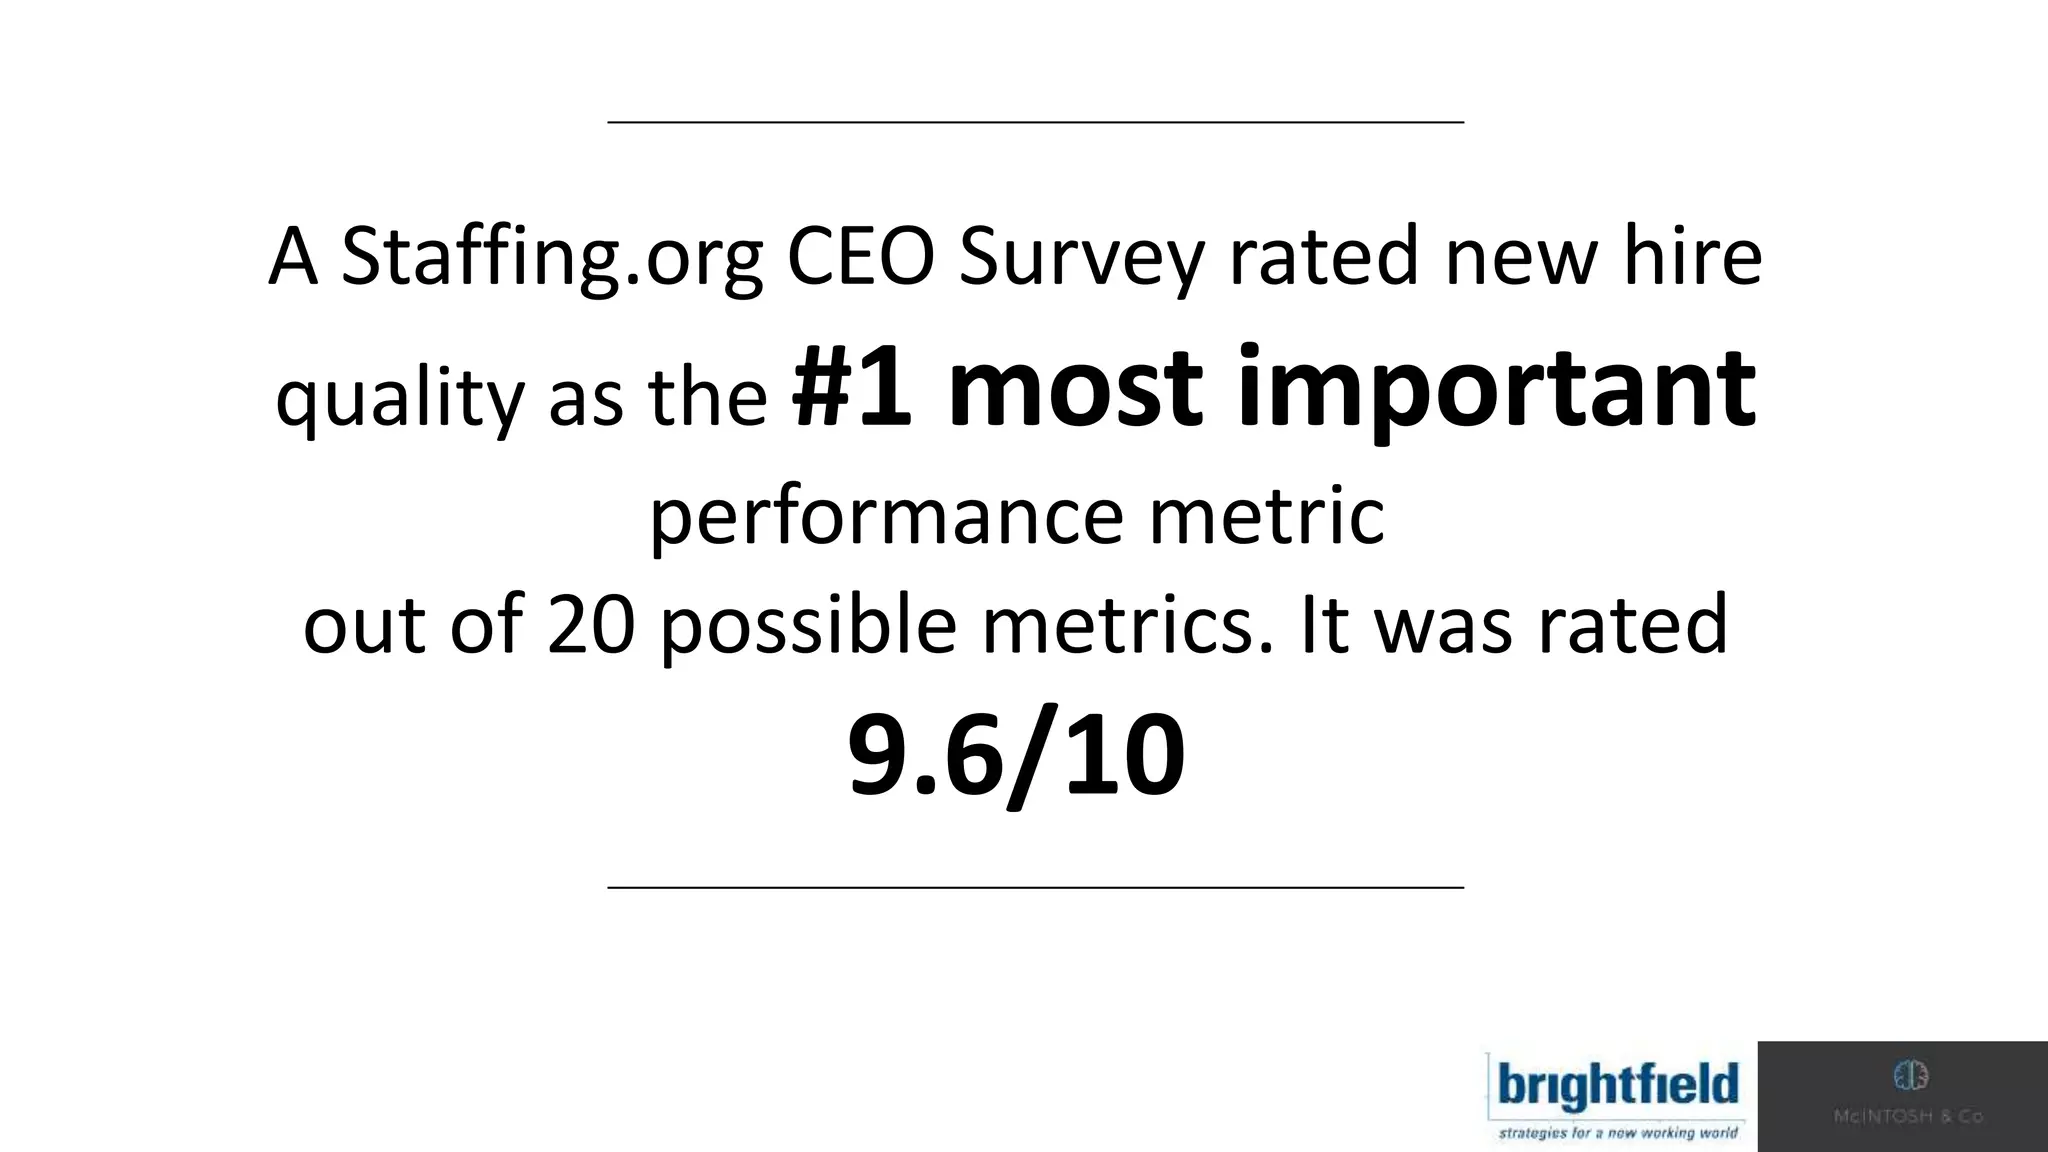
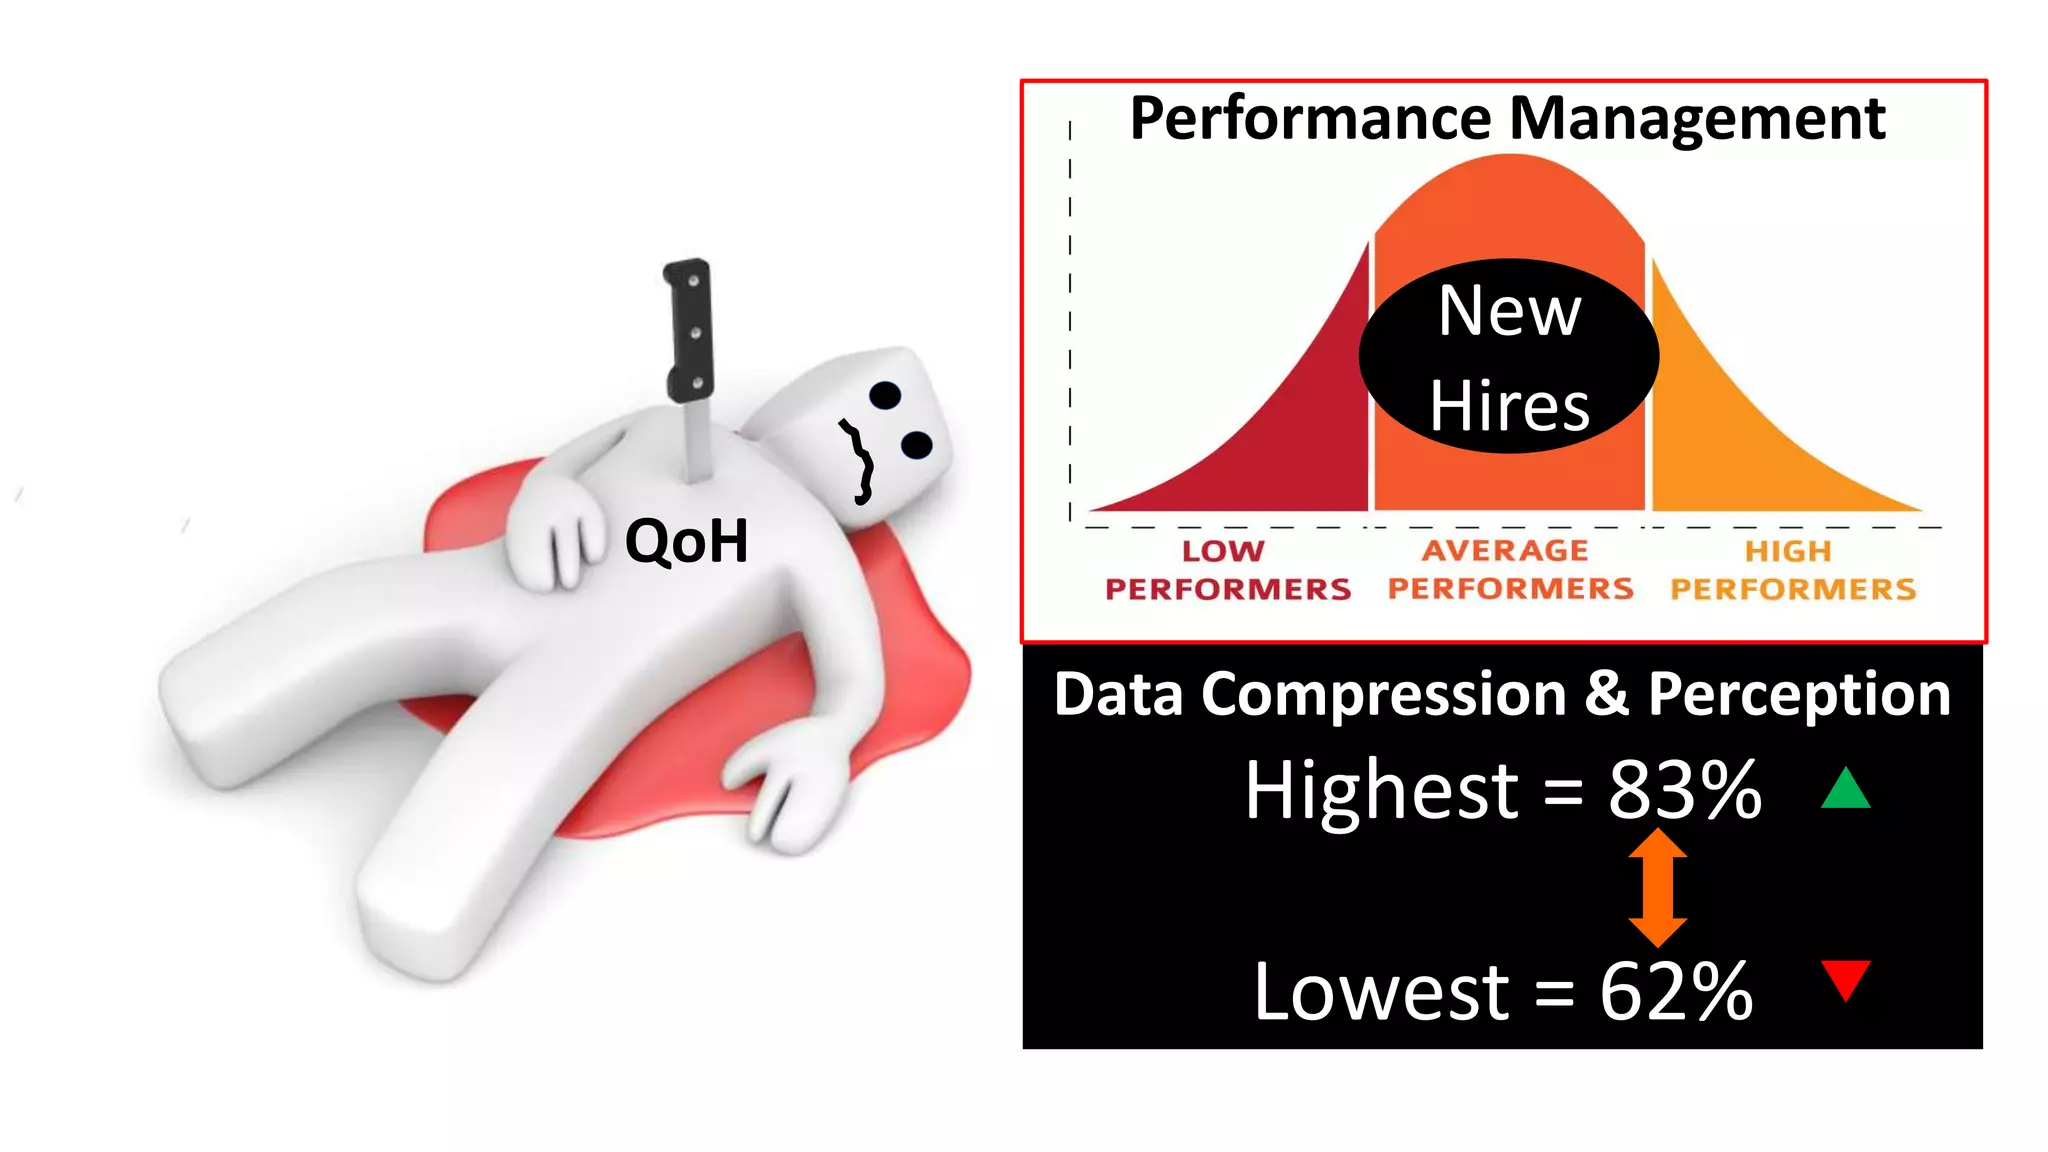
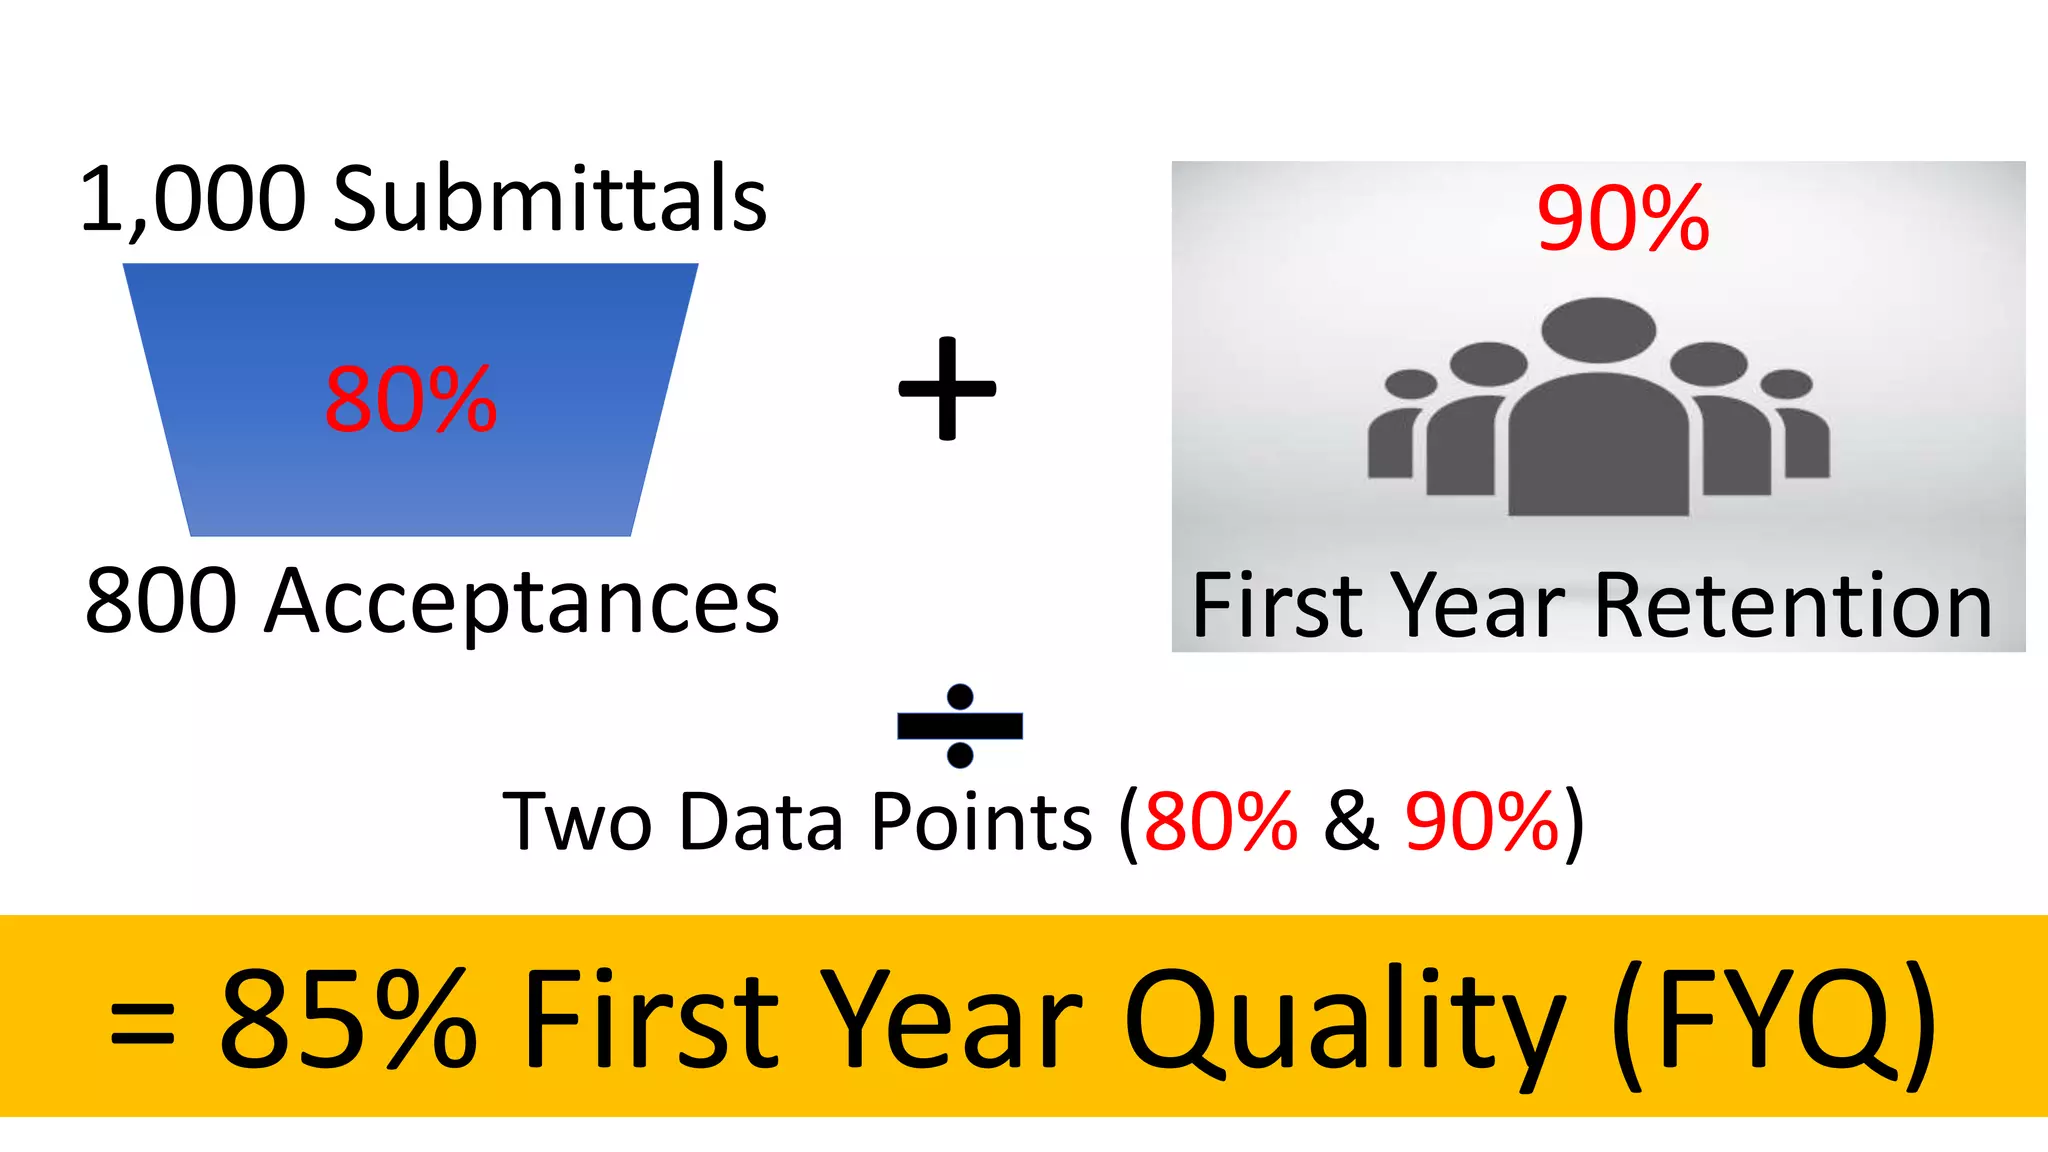
Quality of Hire metrics calculation and comparison, demonstrating its significance in performance measurement.
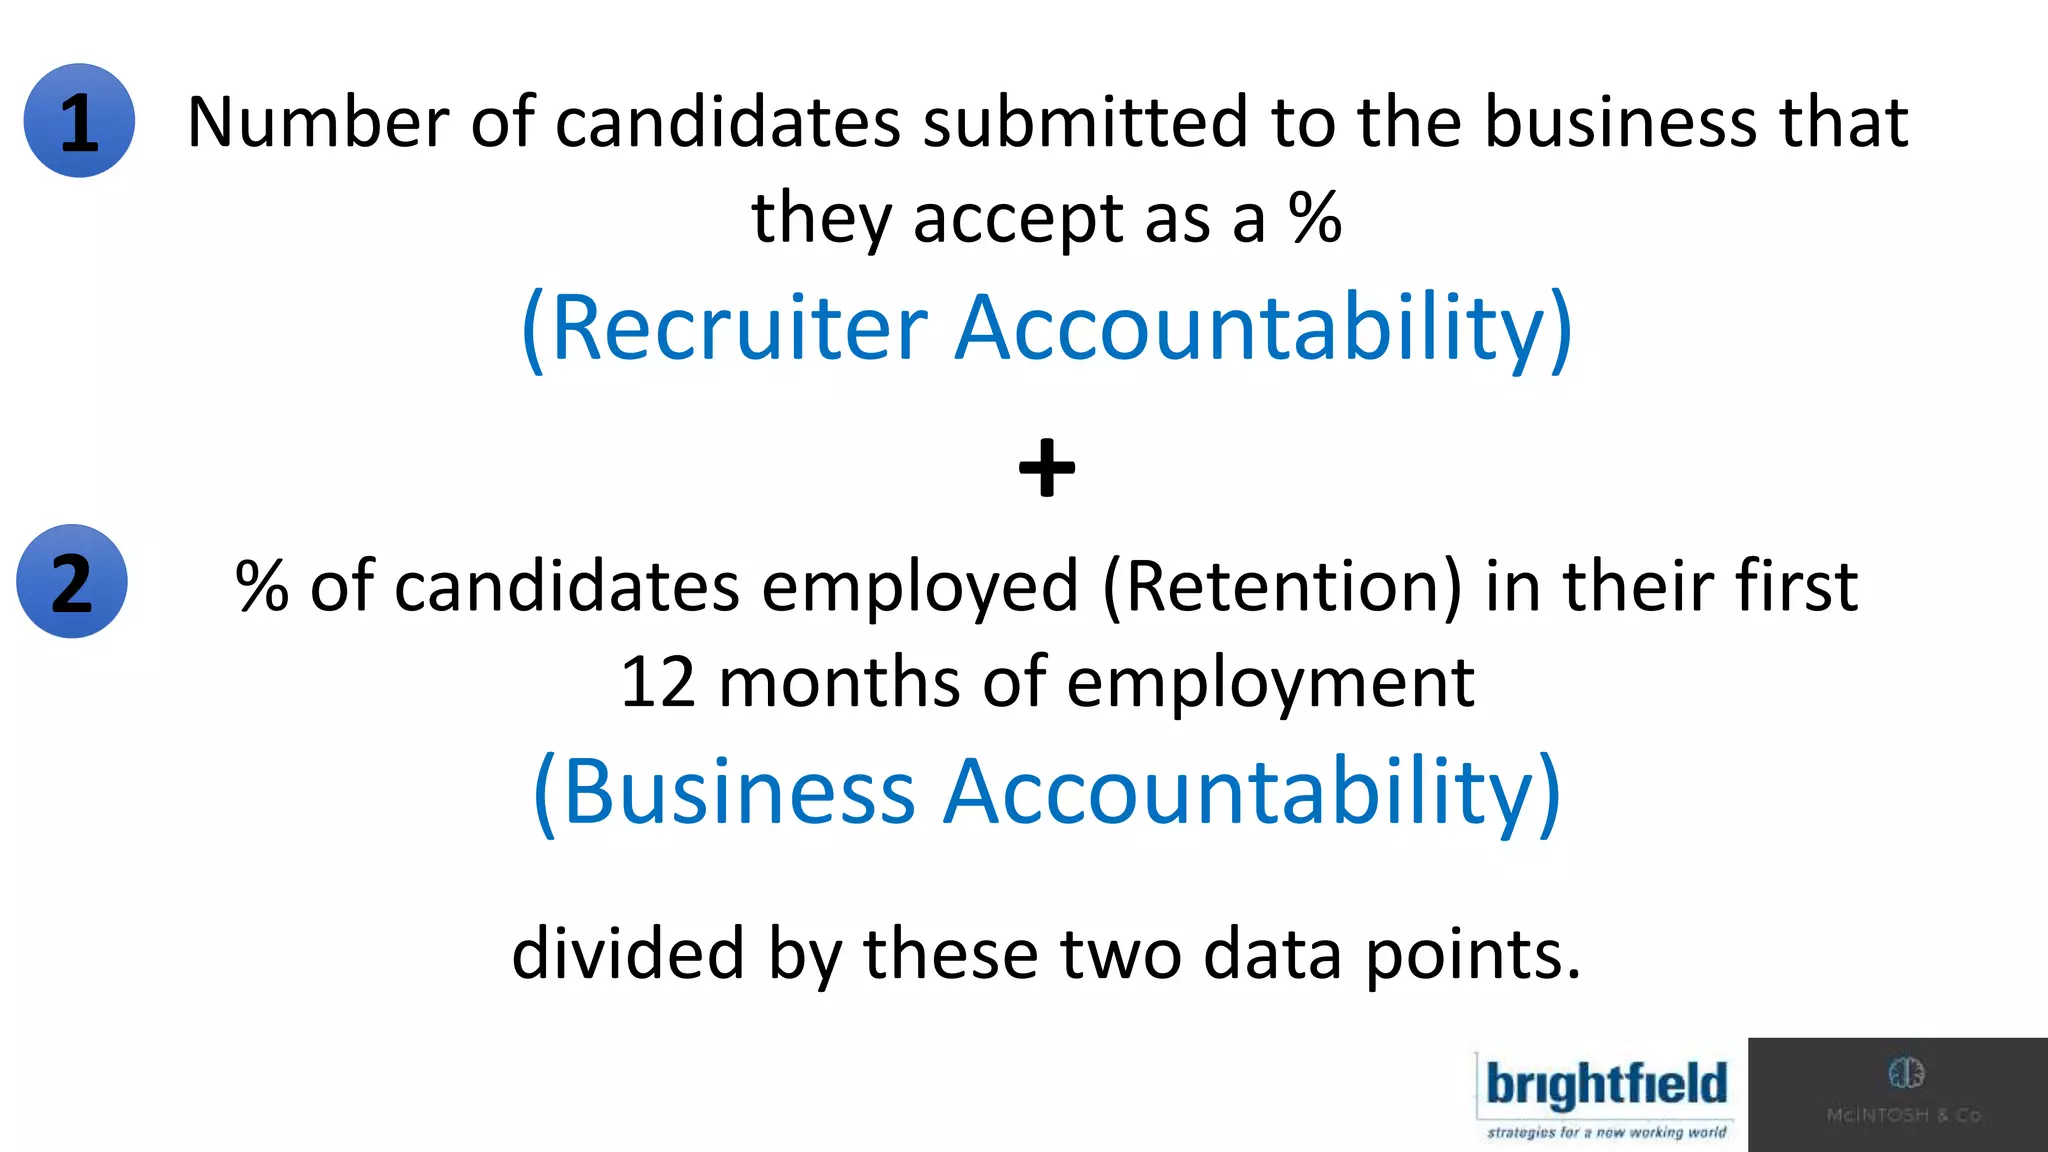
Discussion around accountability metrics for recruiters and business, focusing on quality measures.
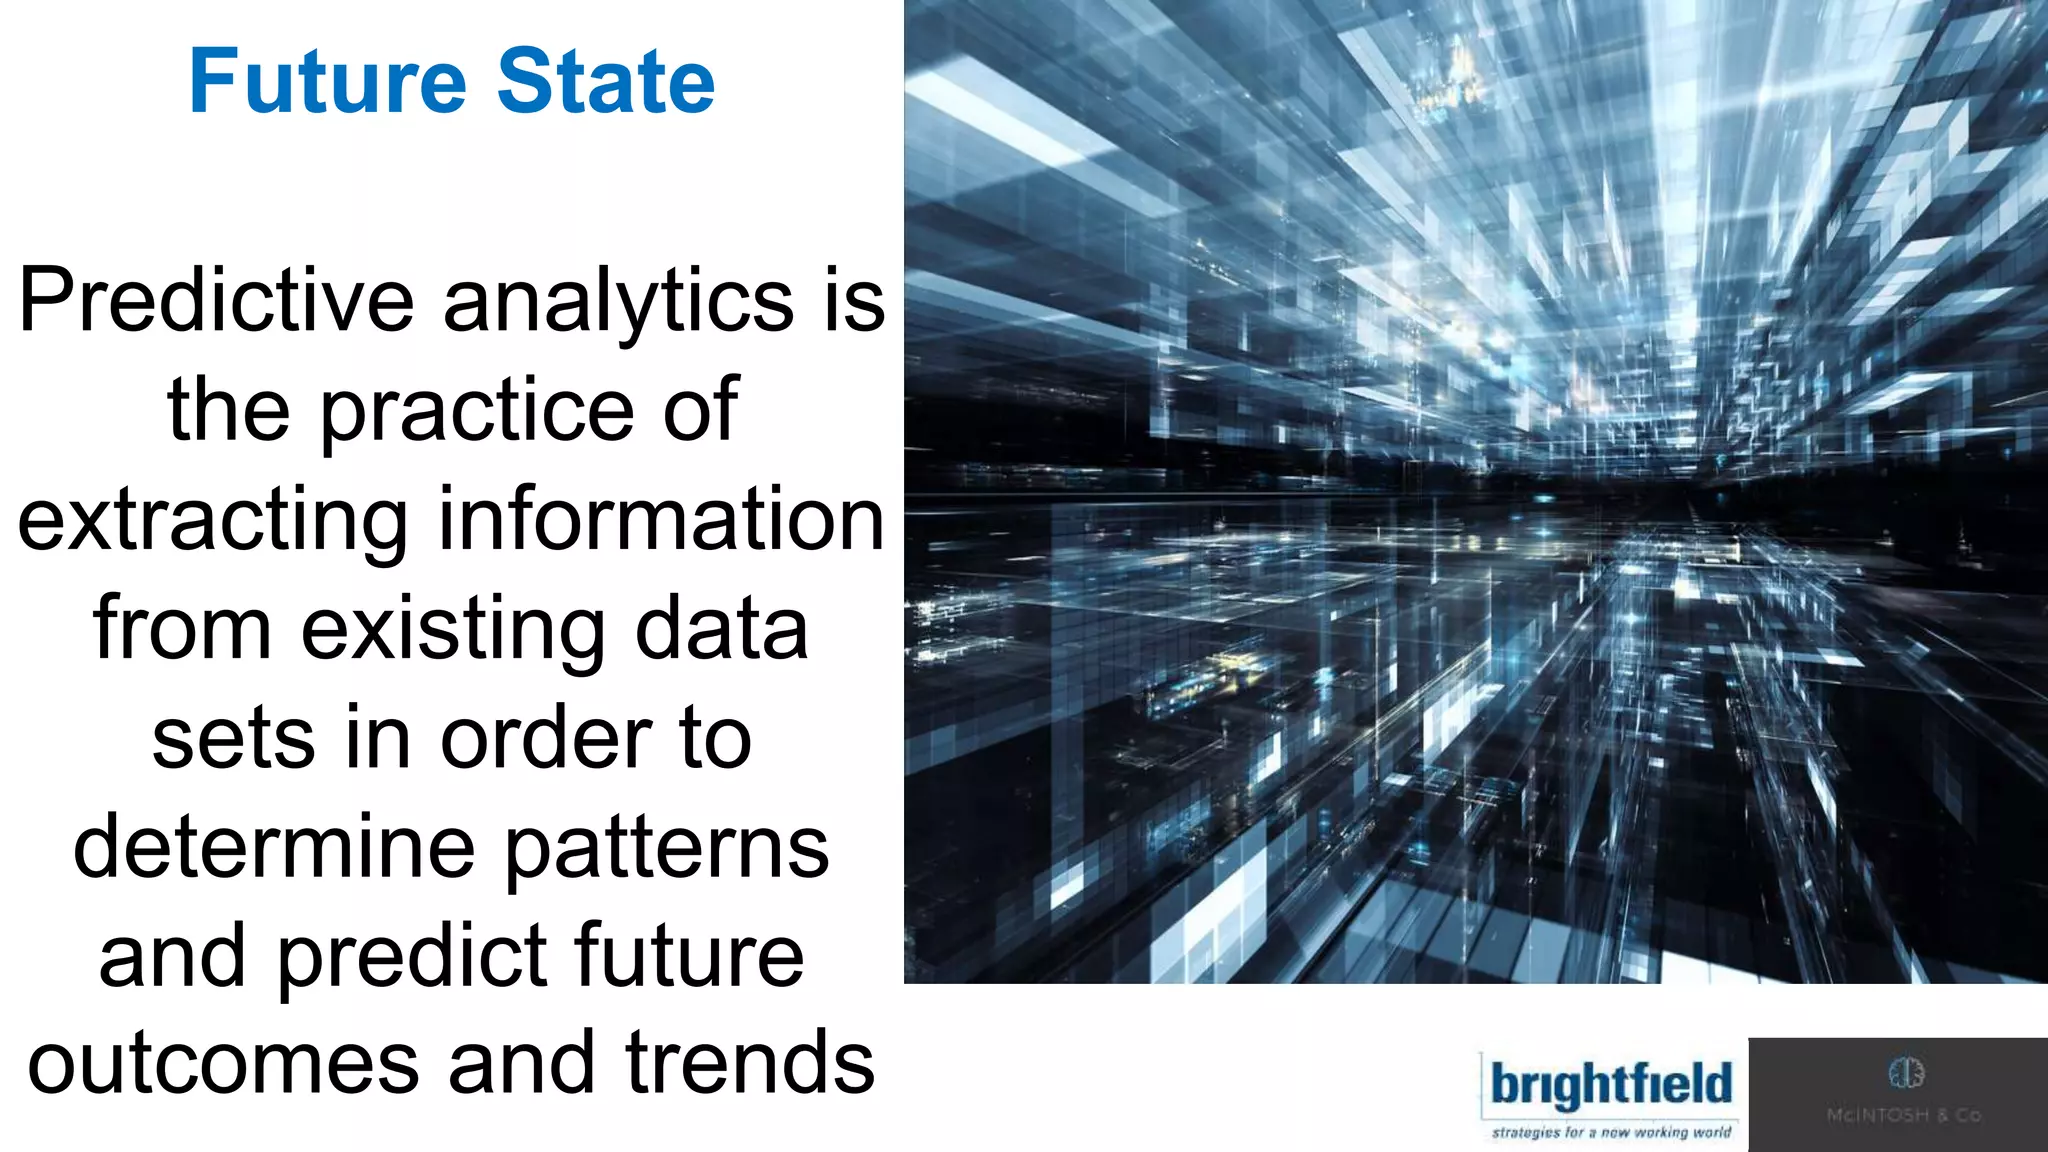
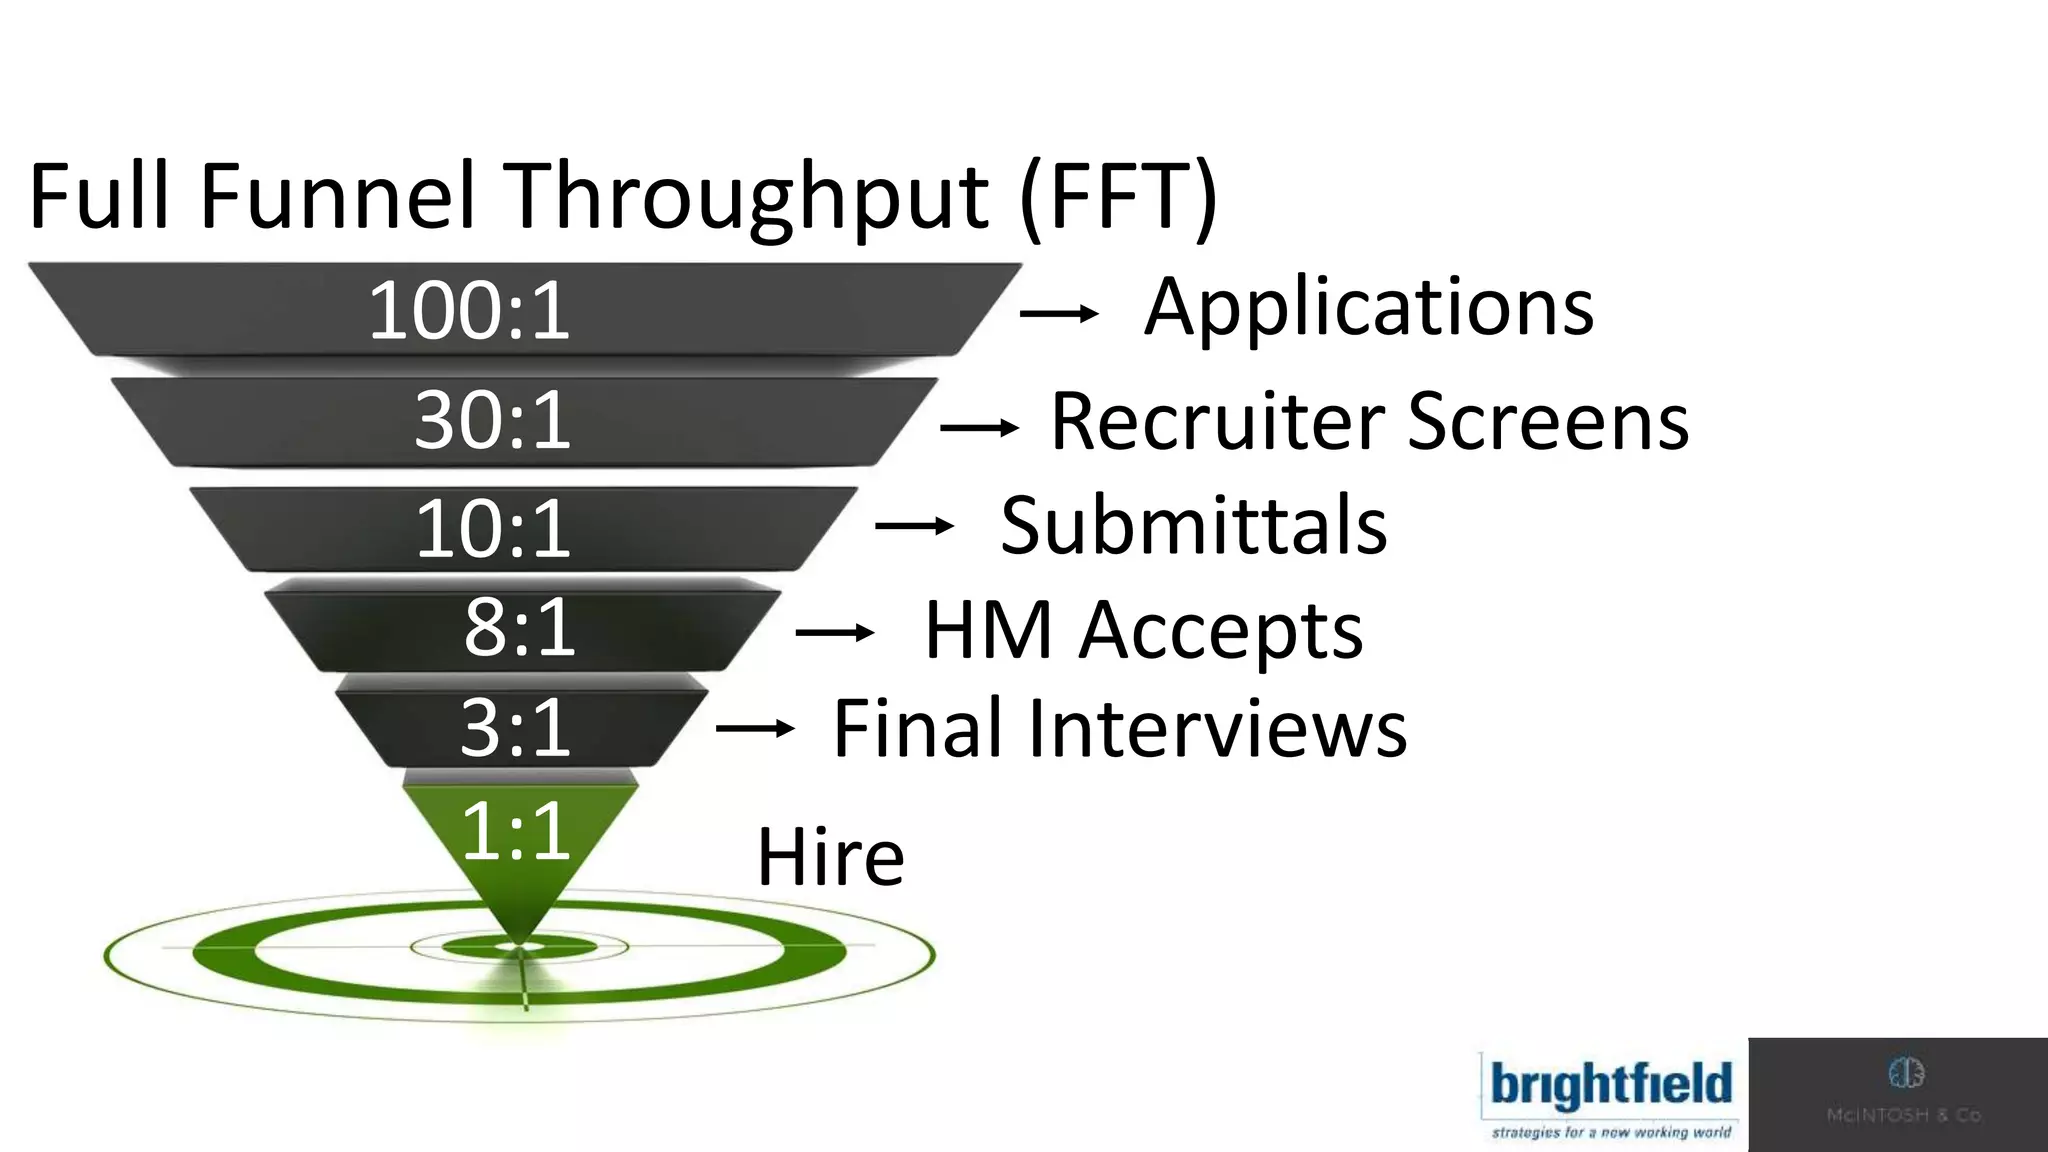
The transition to predictive analytics, identifying bottlenecks in recruitment processes and metrics.
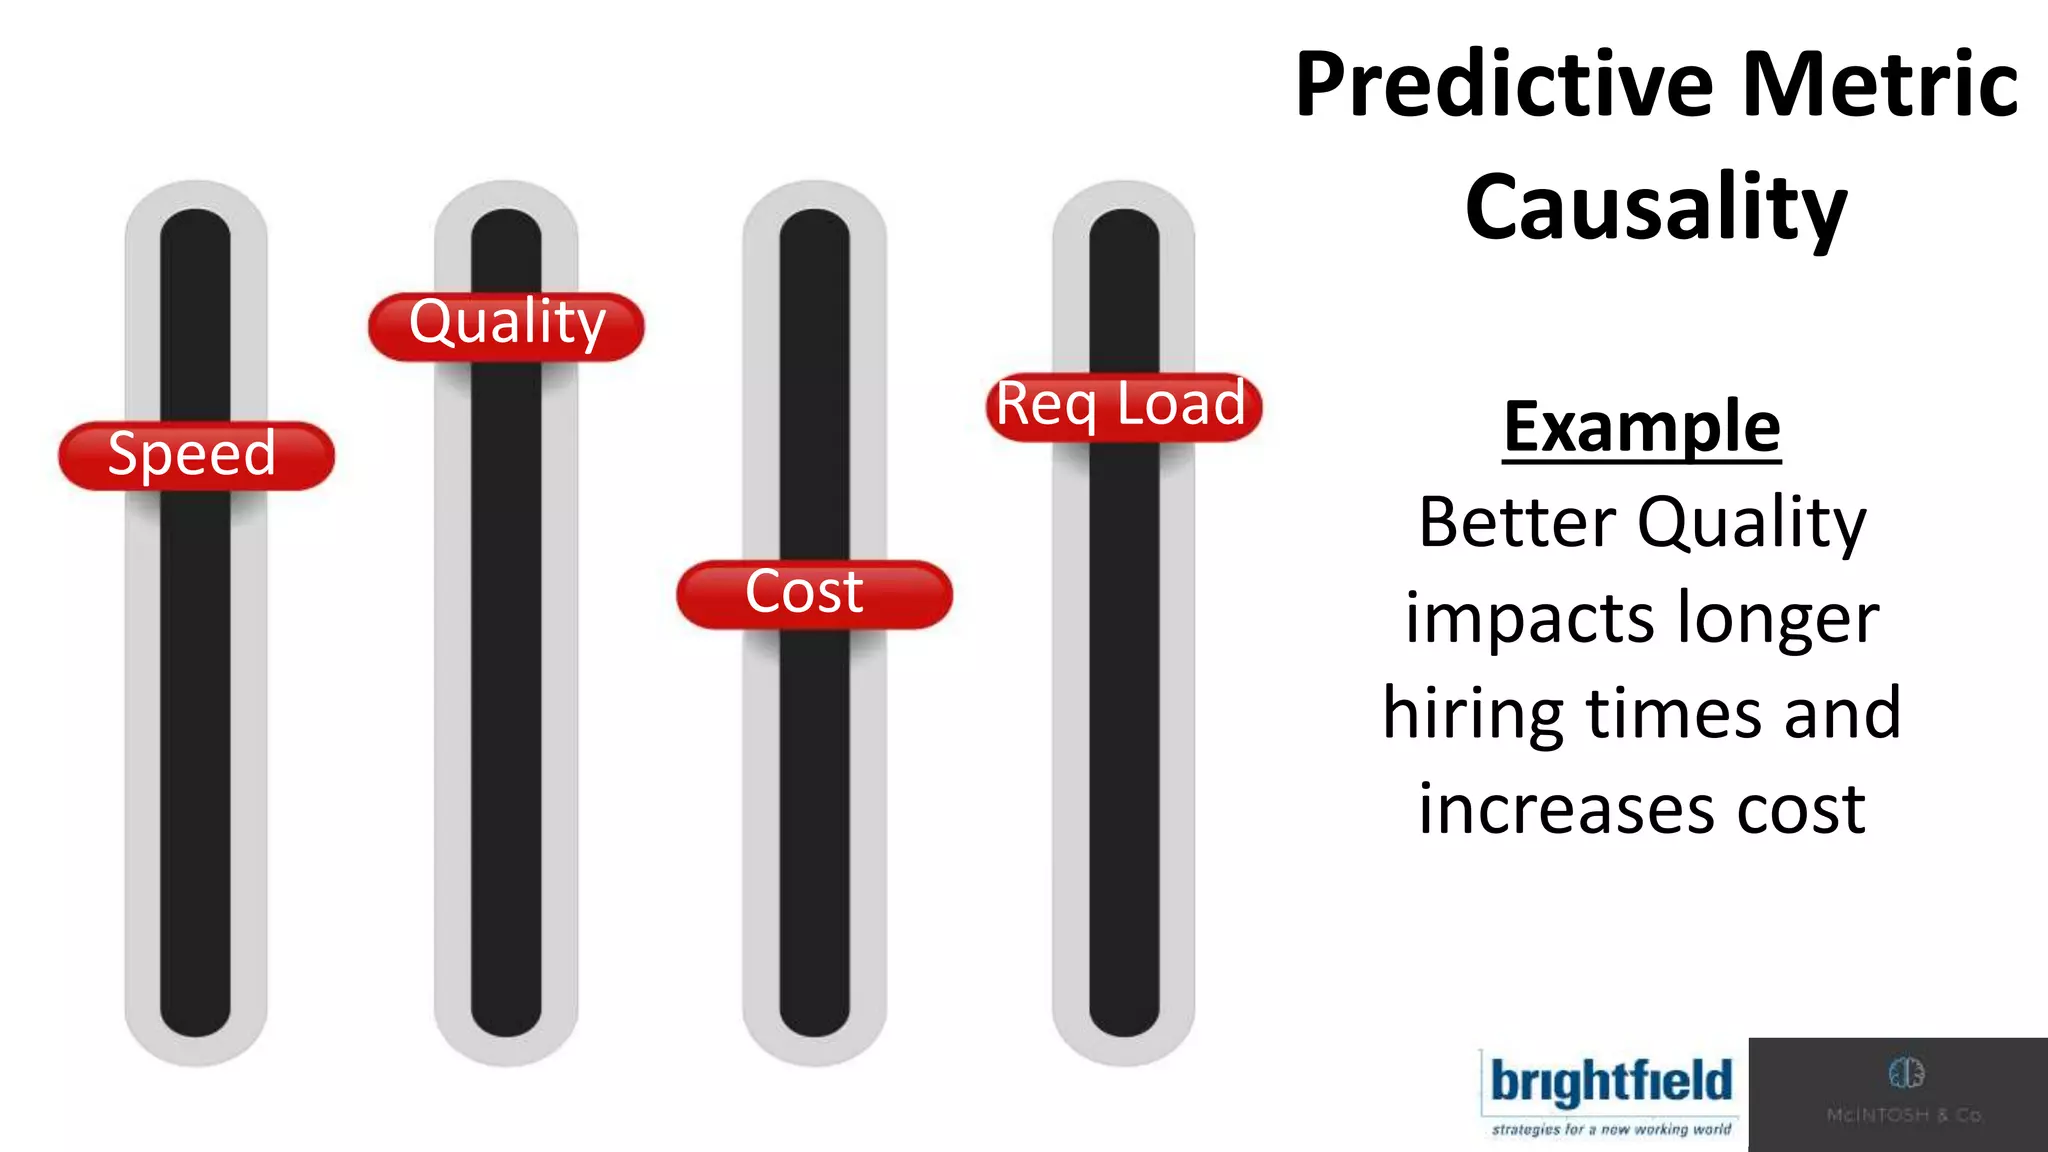
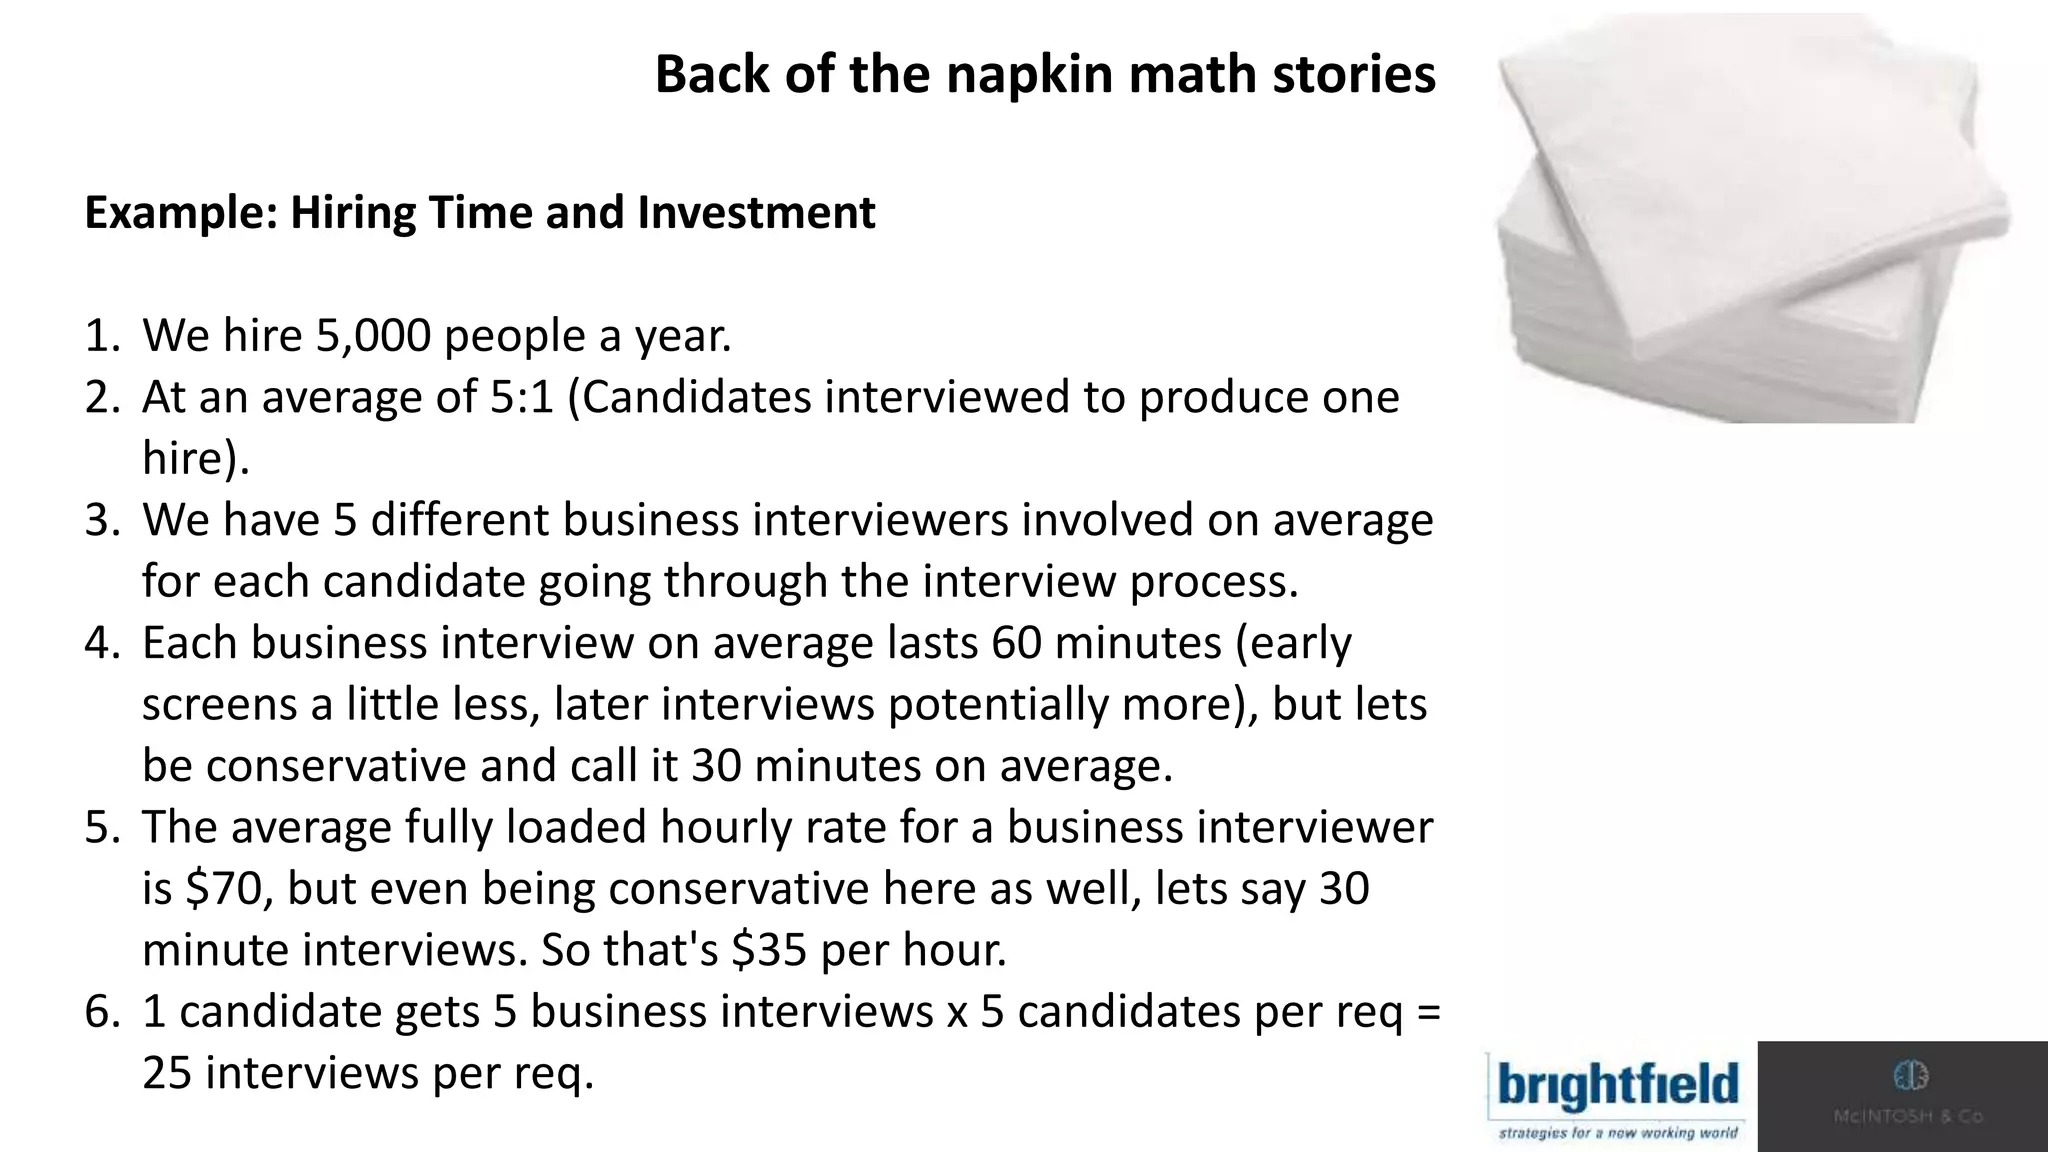
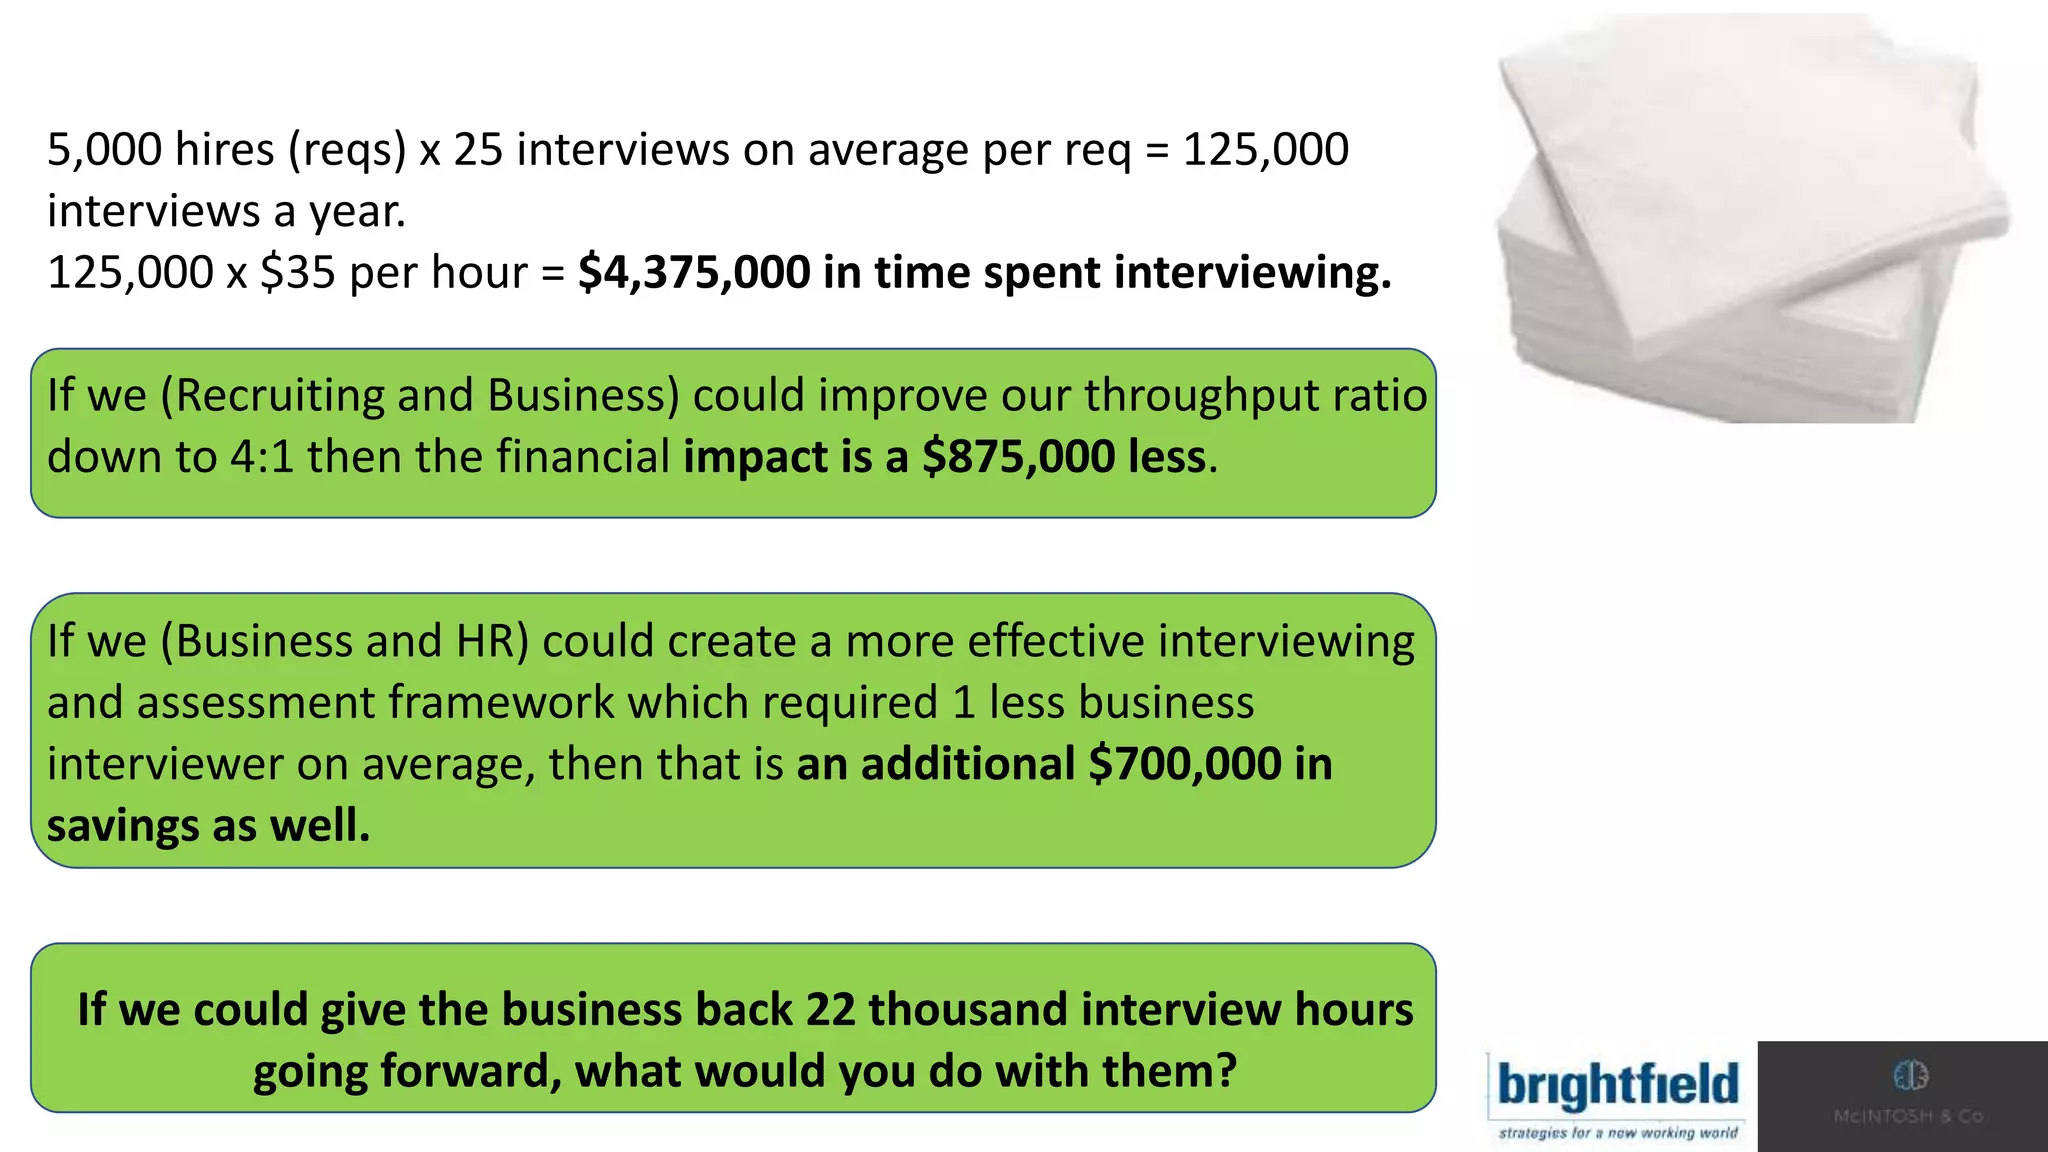
Explores how quality impacts other metrics such as hiring speed and costs in recruiting.
Engagement dialogue about the interest in predictive metrics within Talent Acquisition.
Importance of storytelling in data with goal alignment to revenue, and engaging metrics for stakeholders.
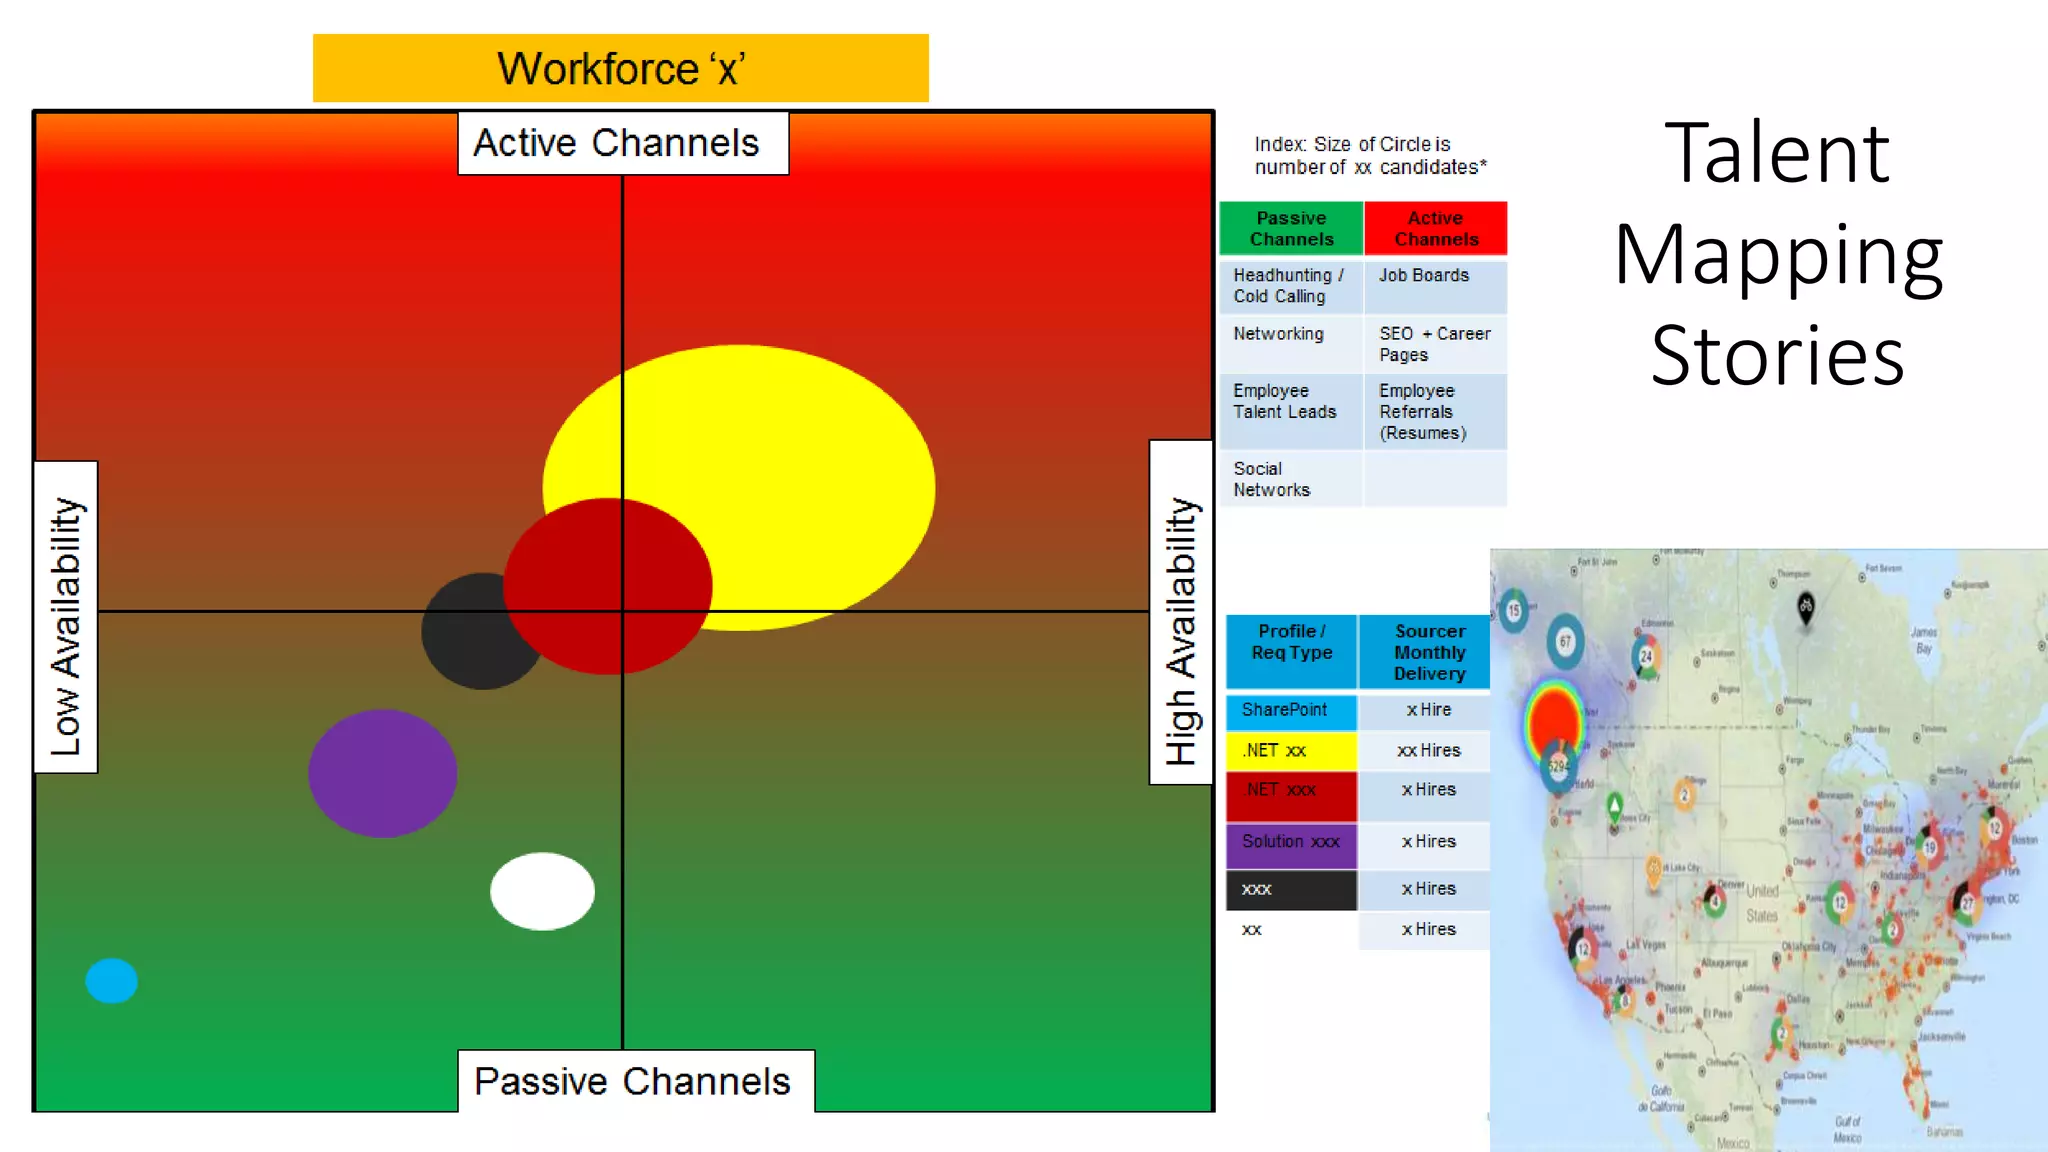
Prospective approaches to leveraging big data and talent mapping strategies for future recruitment.
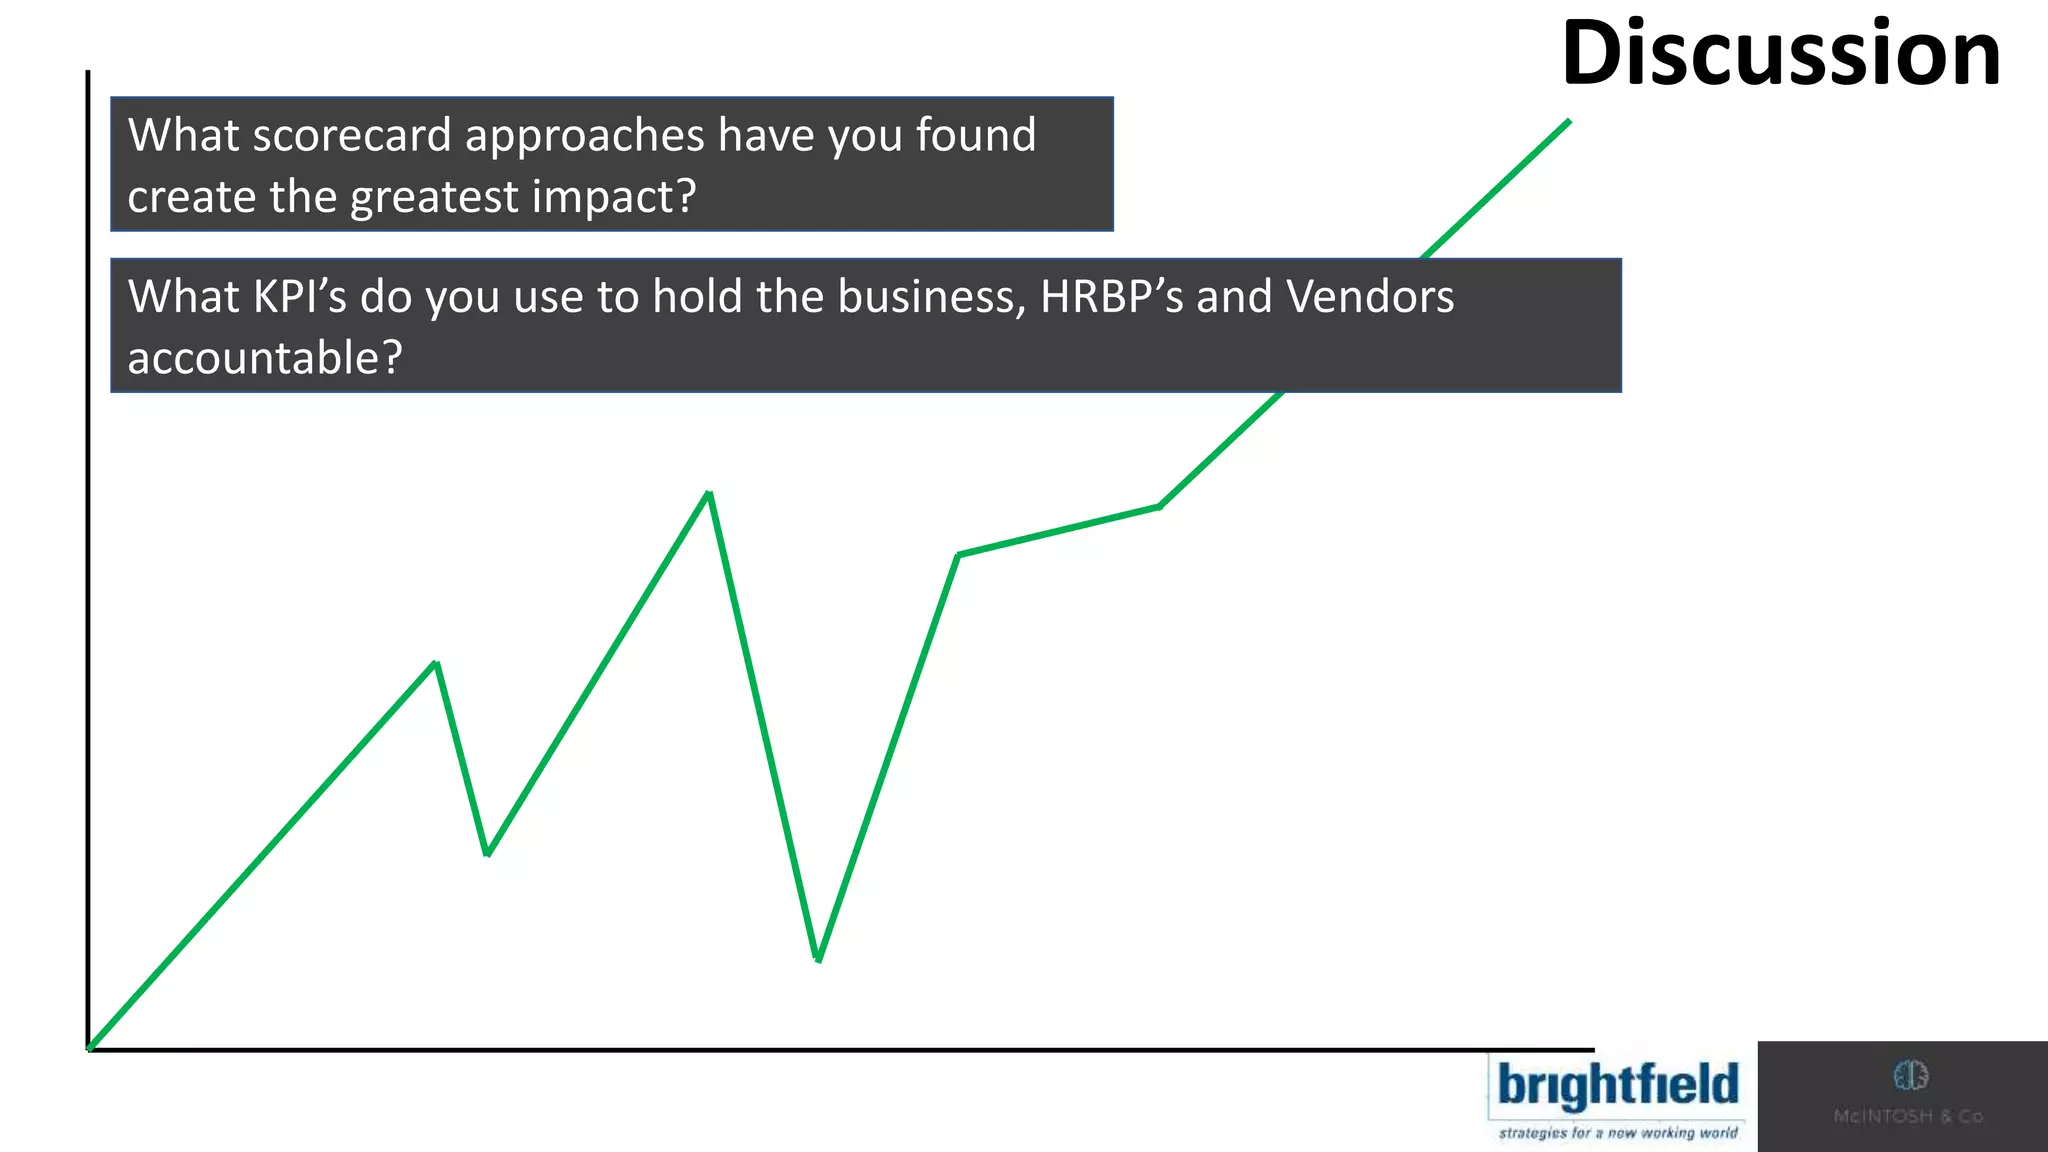
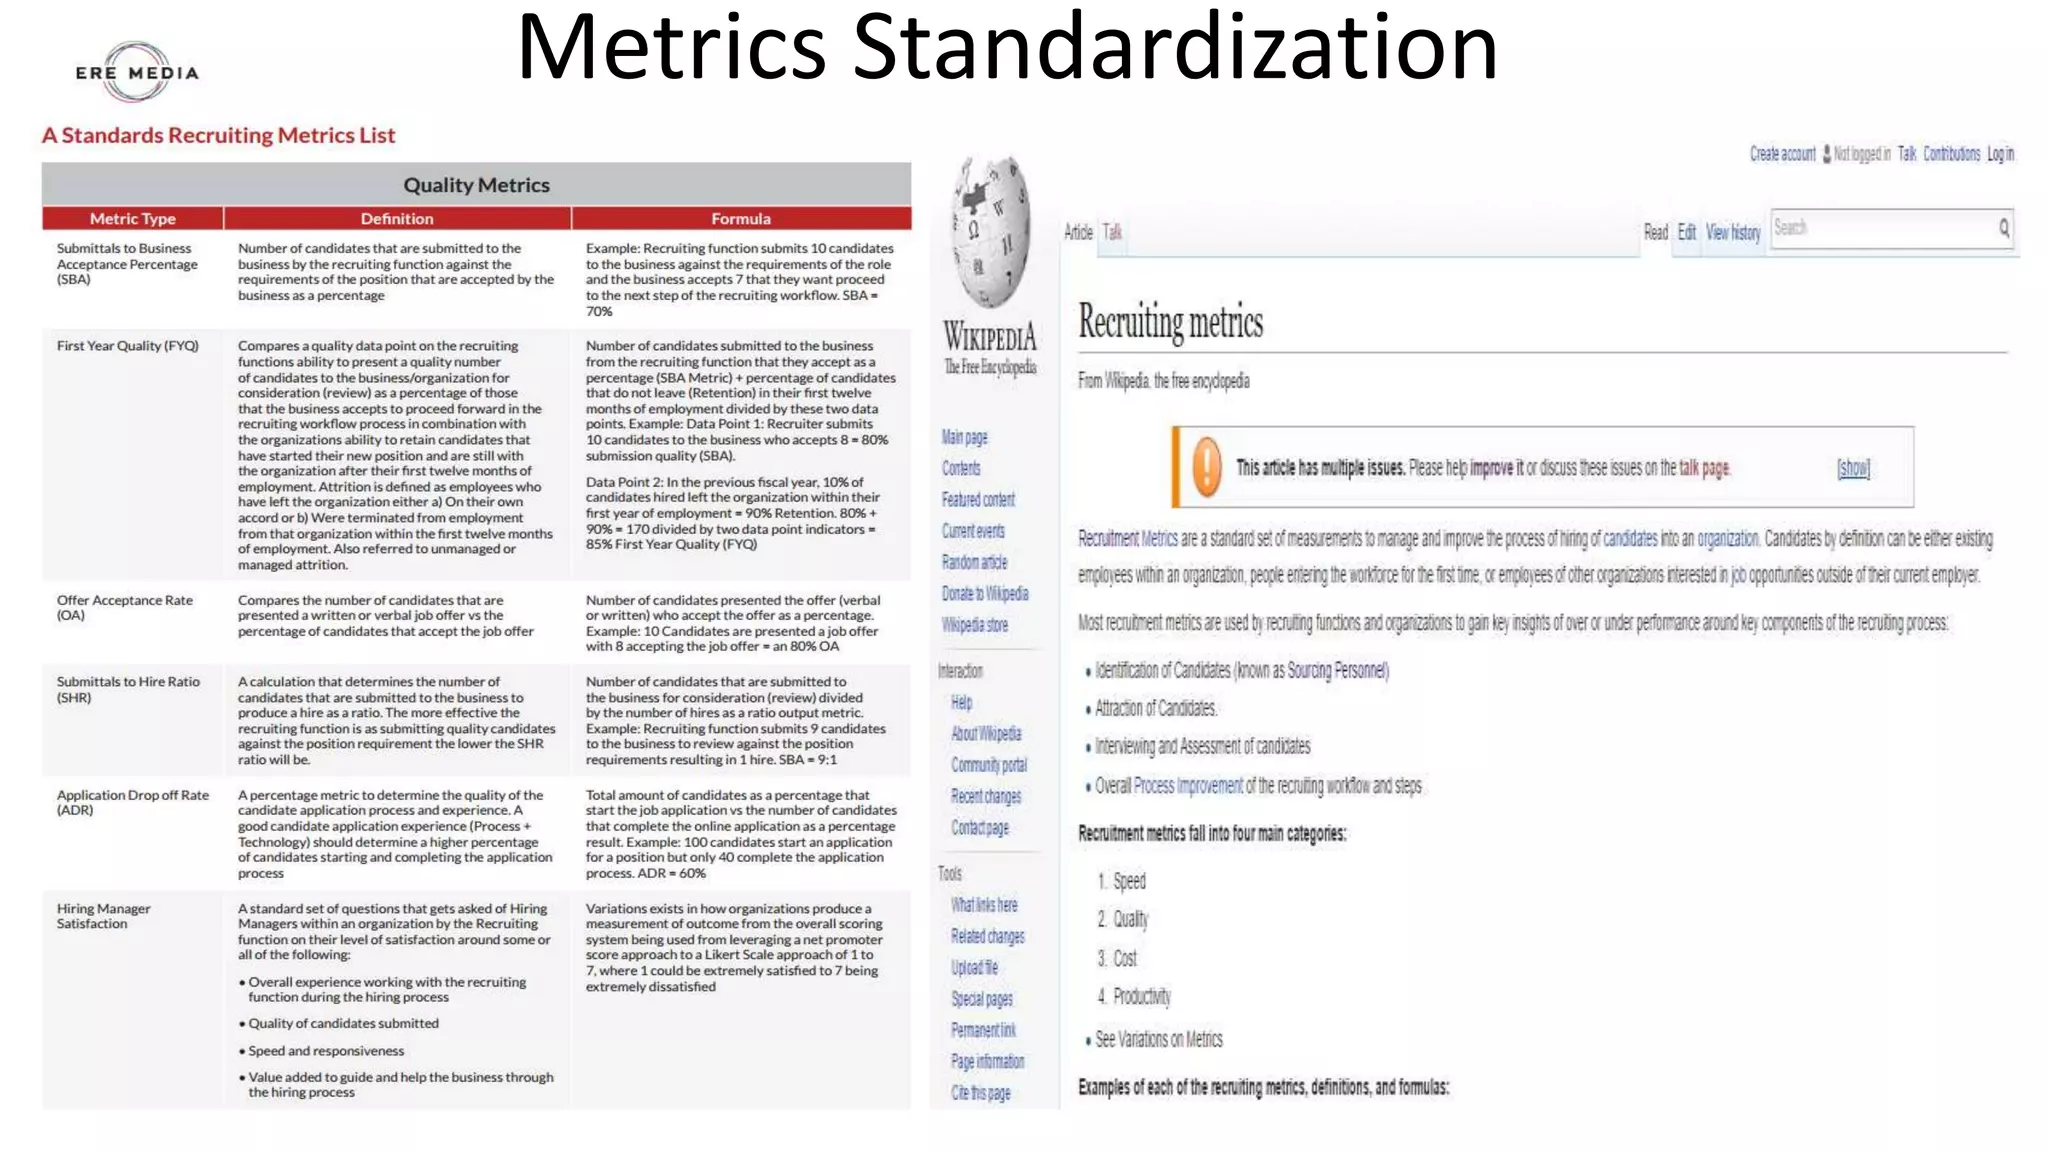
Discussion on KPI scorecards, transparency, and data accuracy, emphasizing effective measurement strategies.
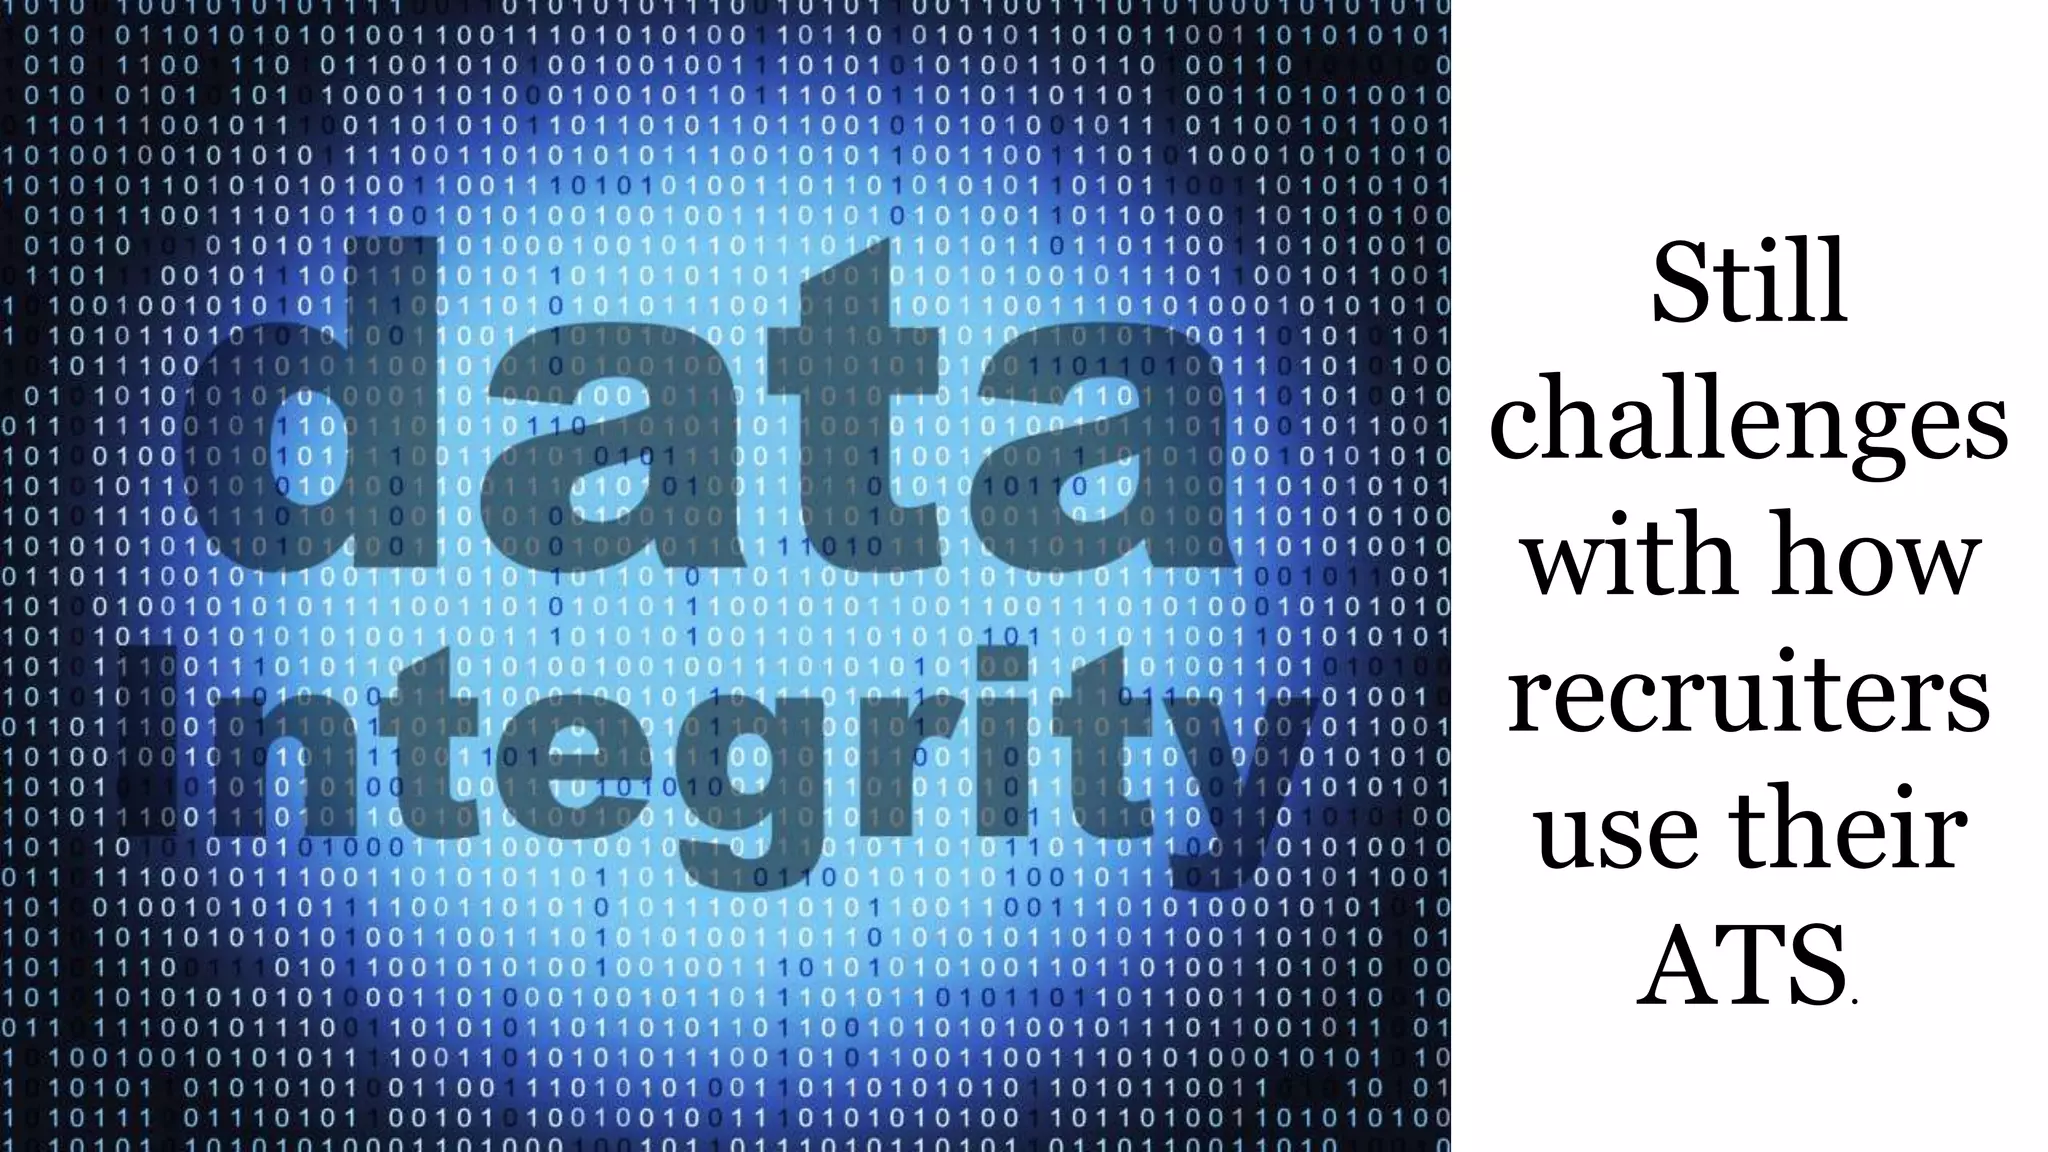
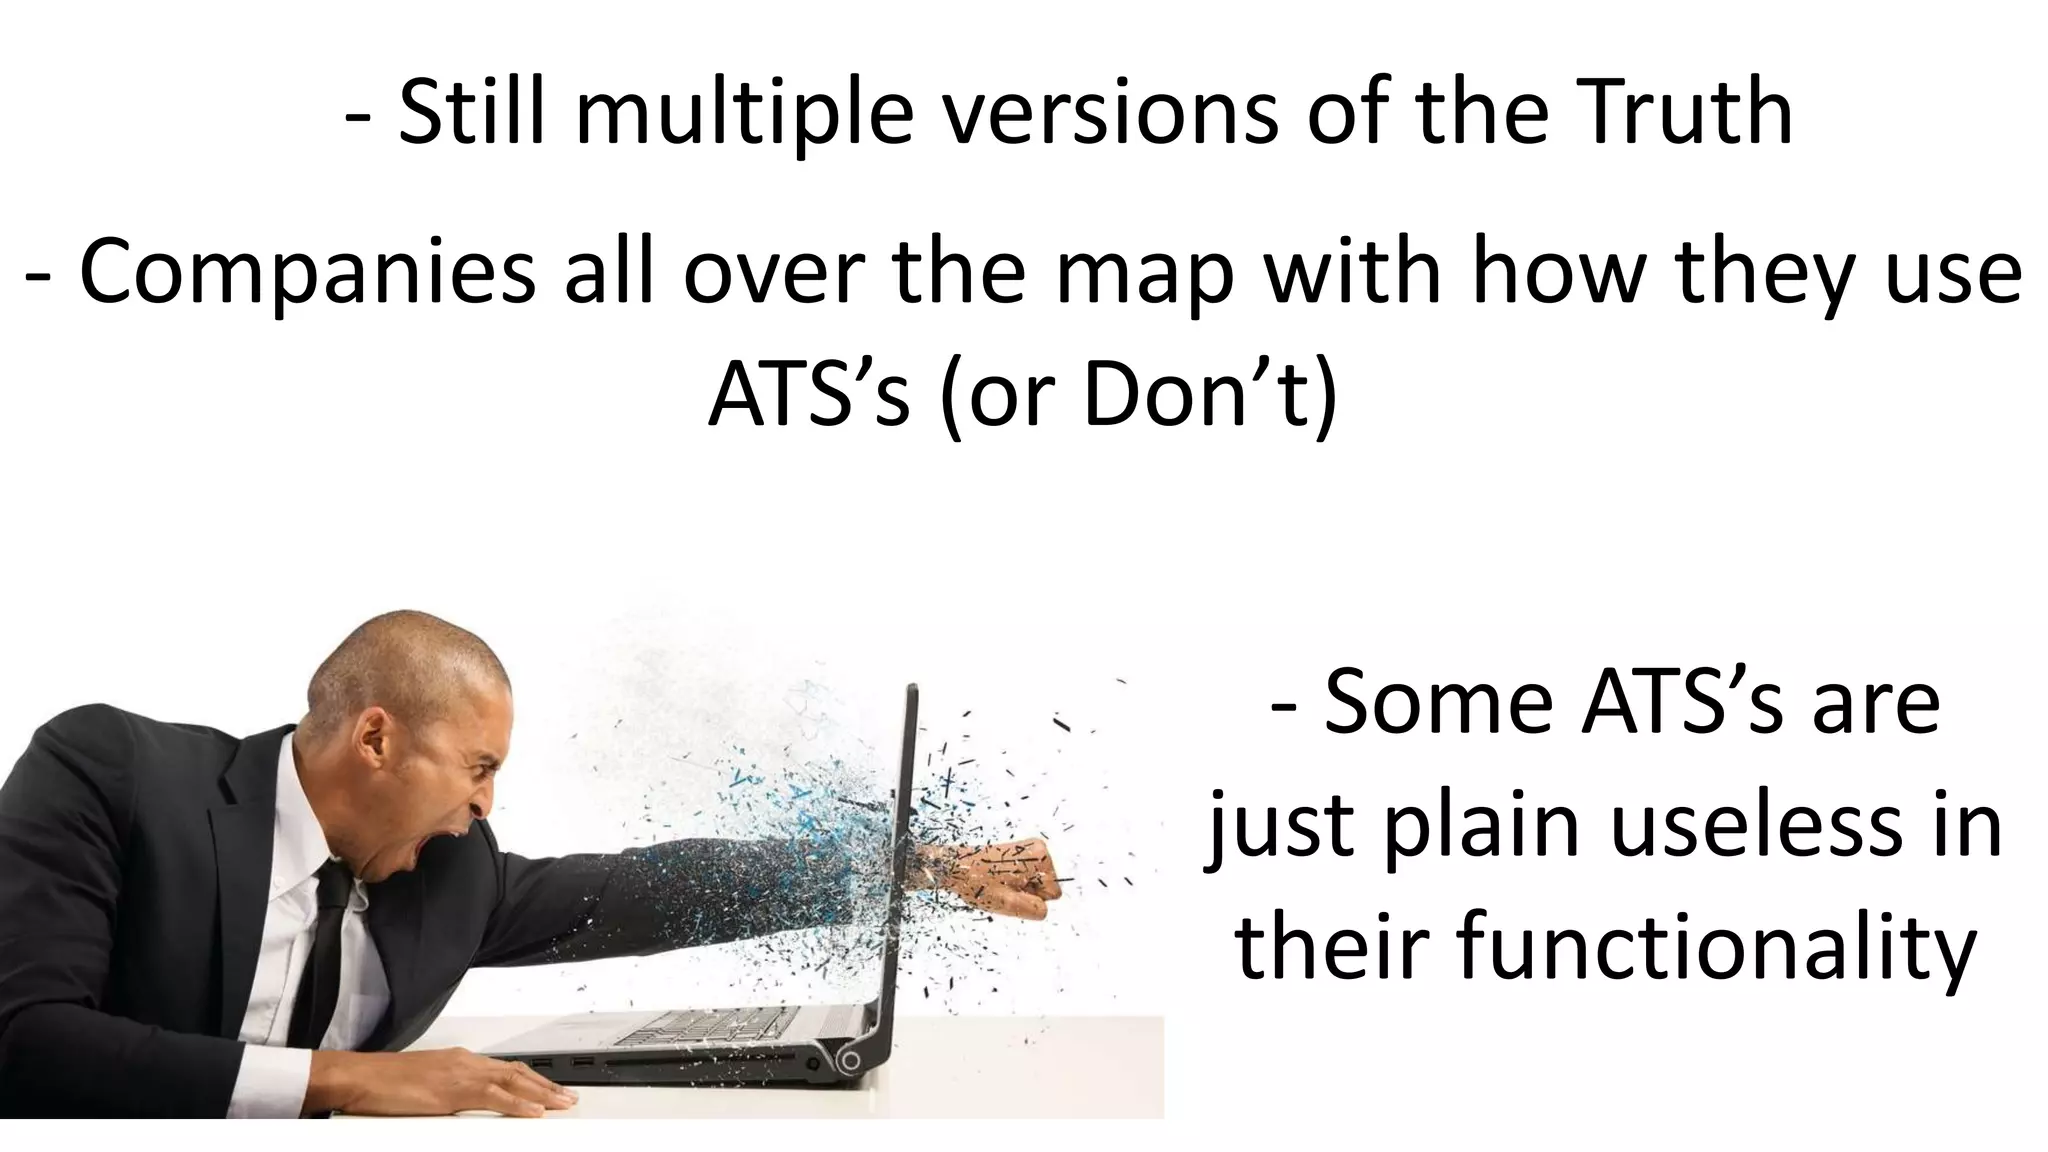
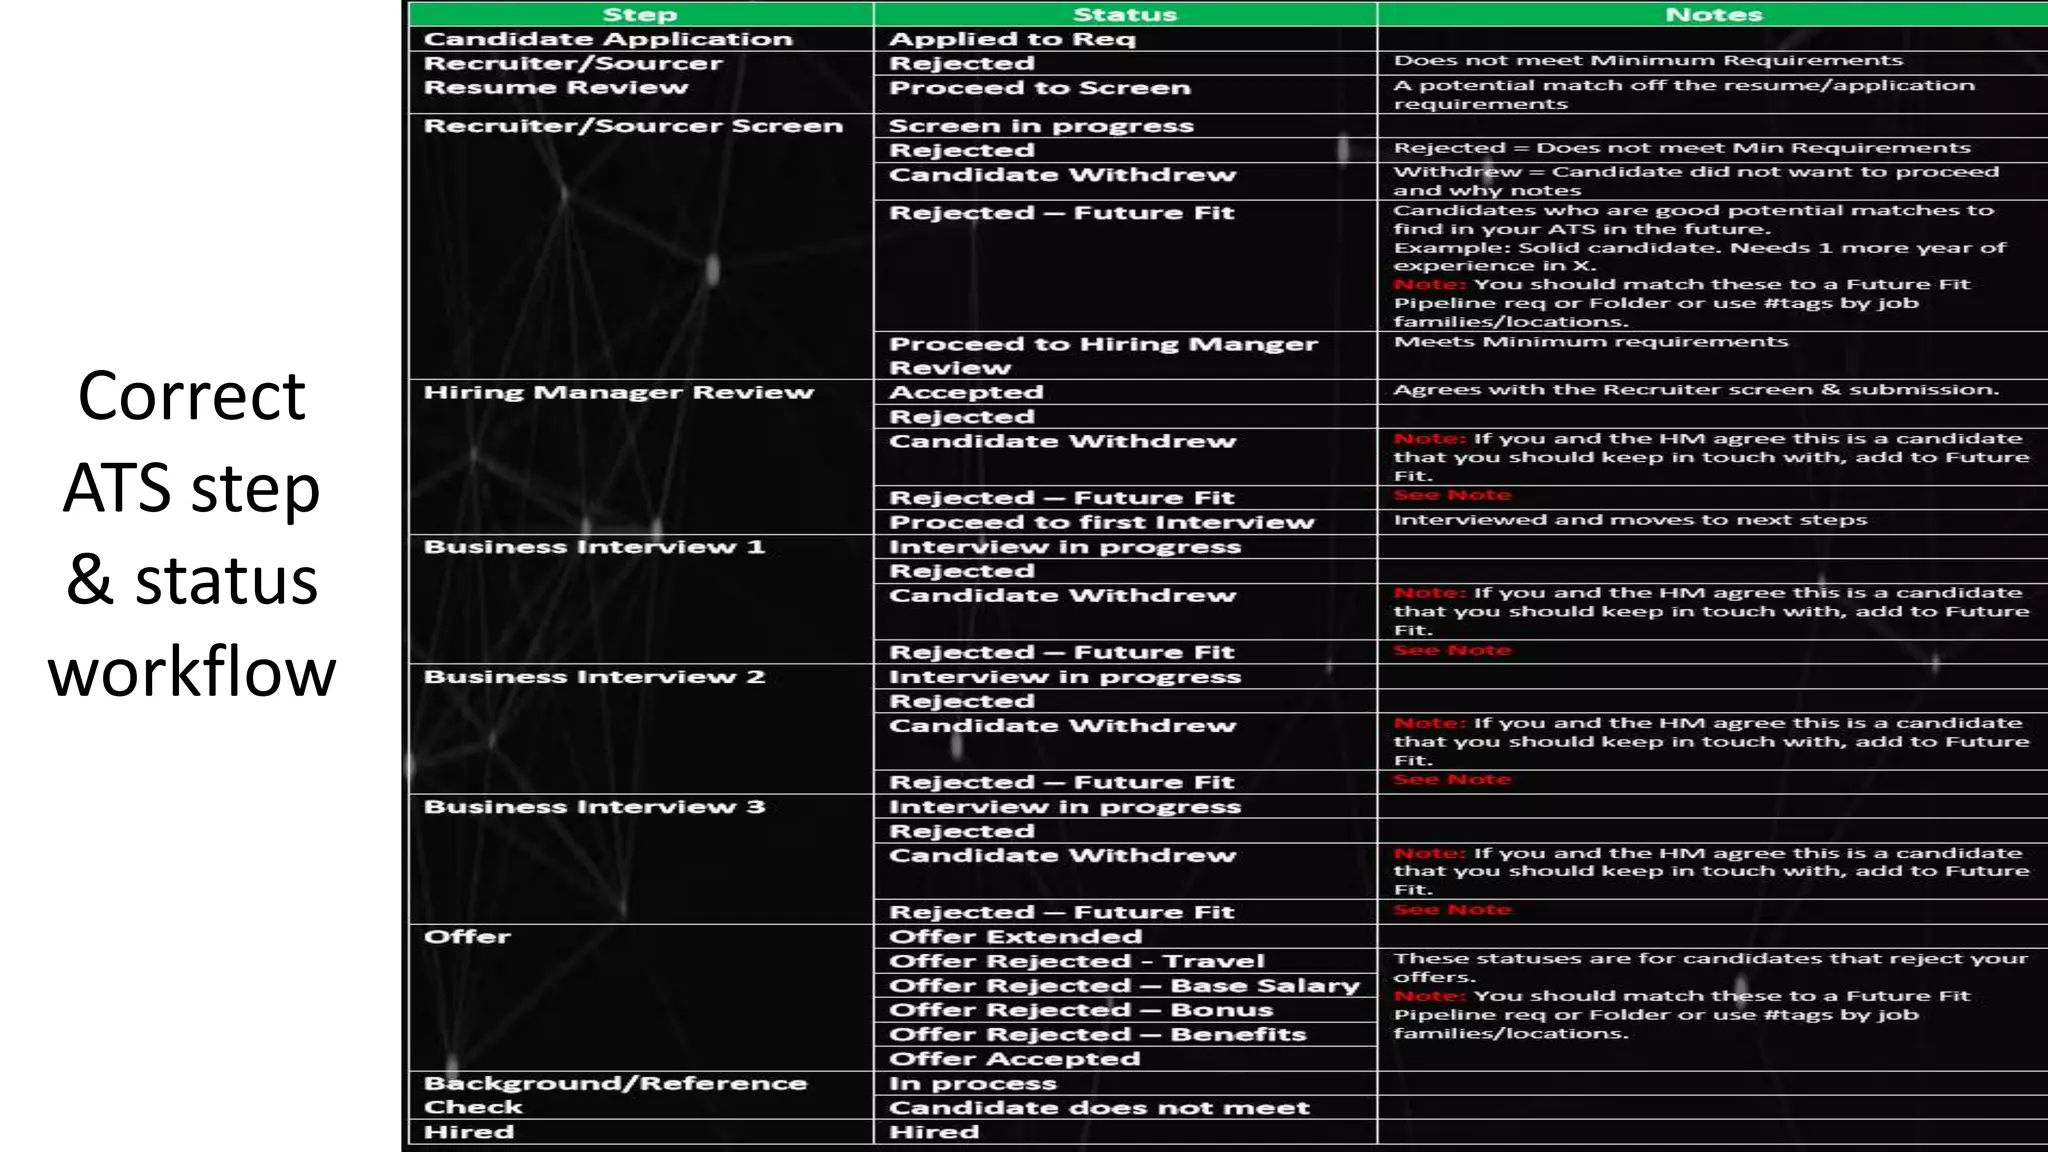
Identifies issues with data integrity in recruitment processes and suggestions to improve data consistency.
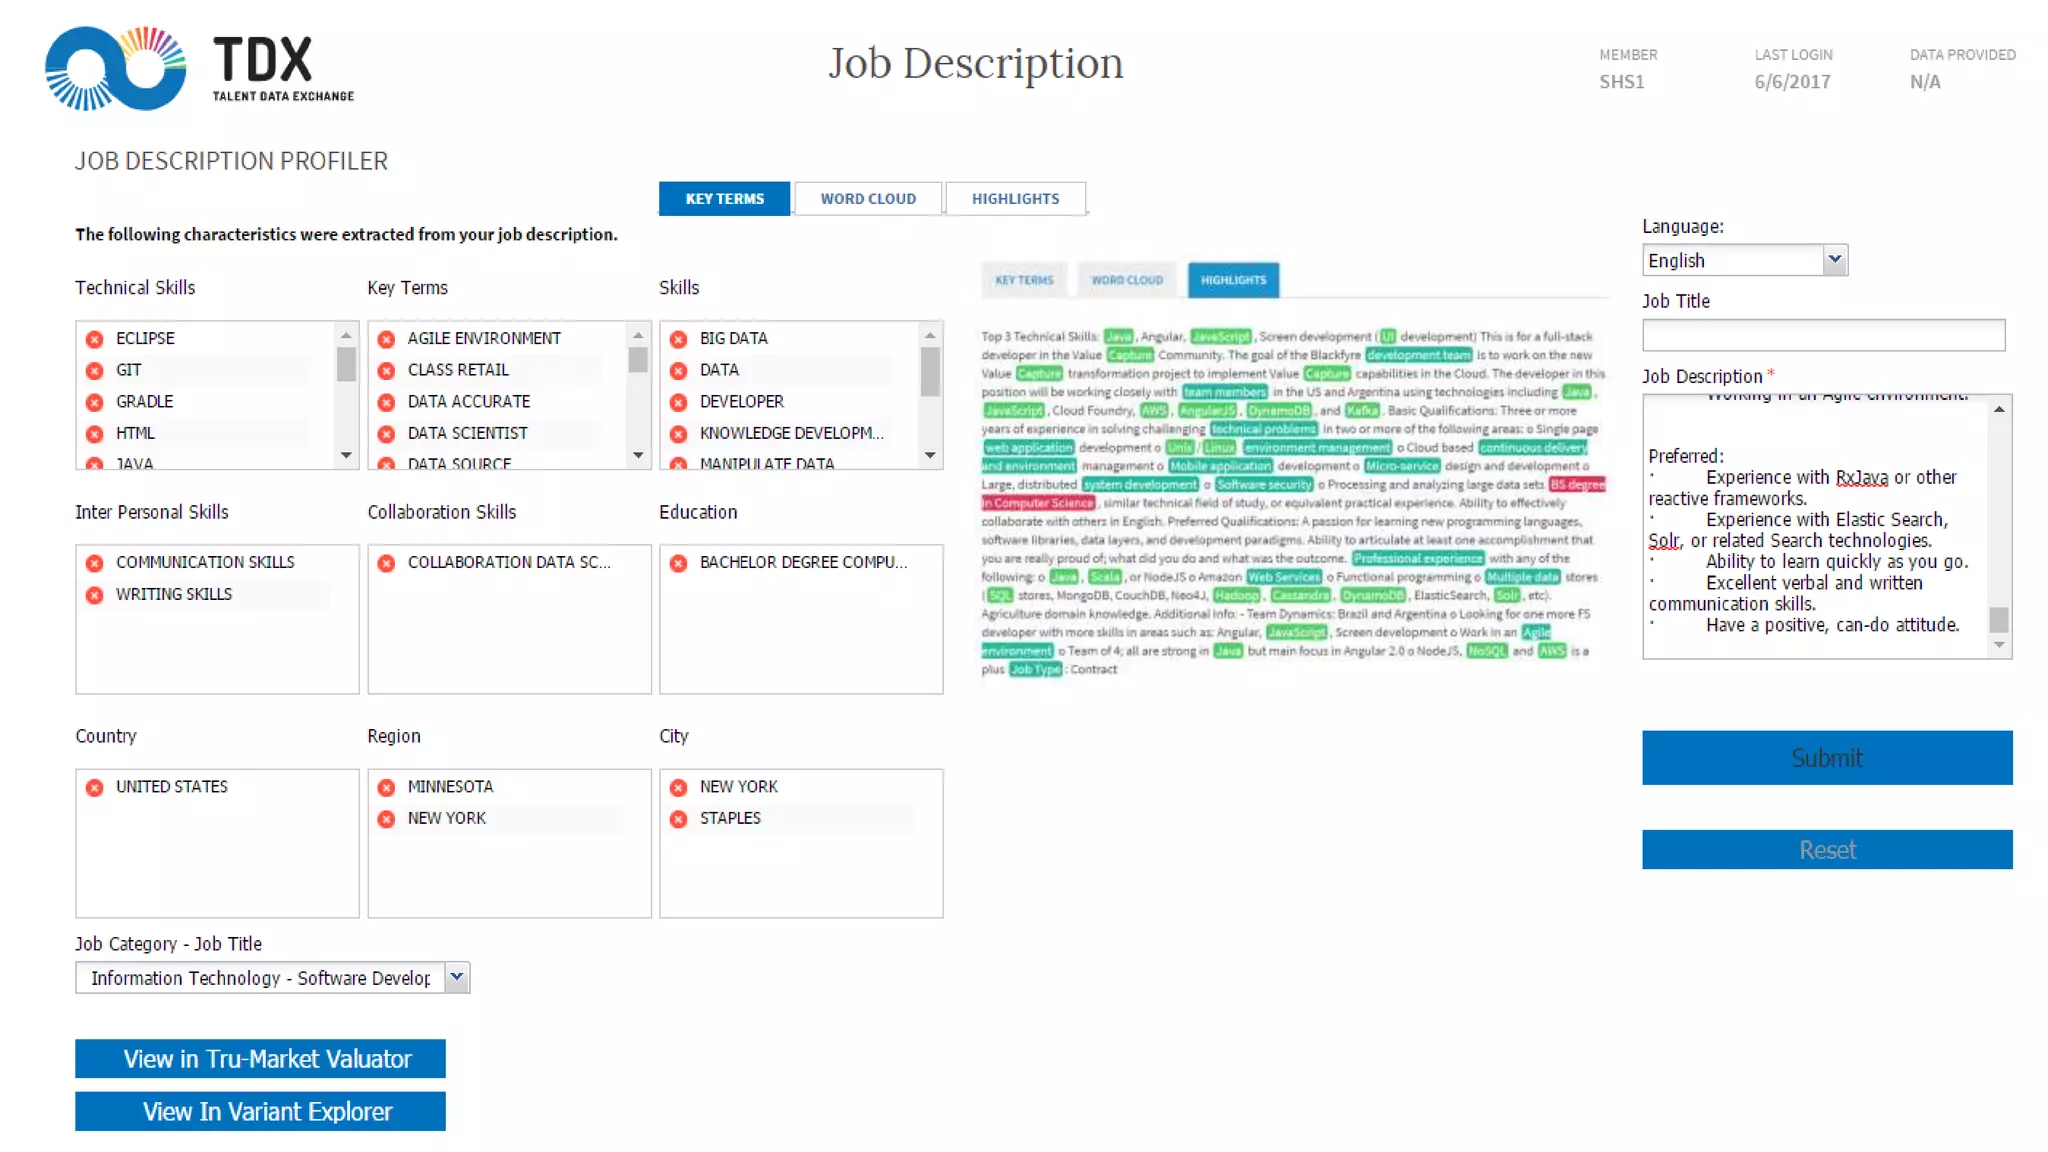
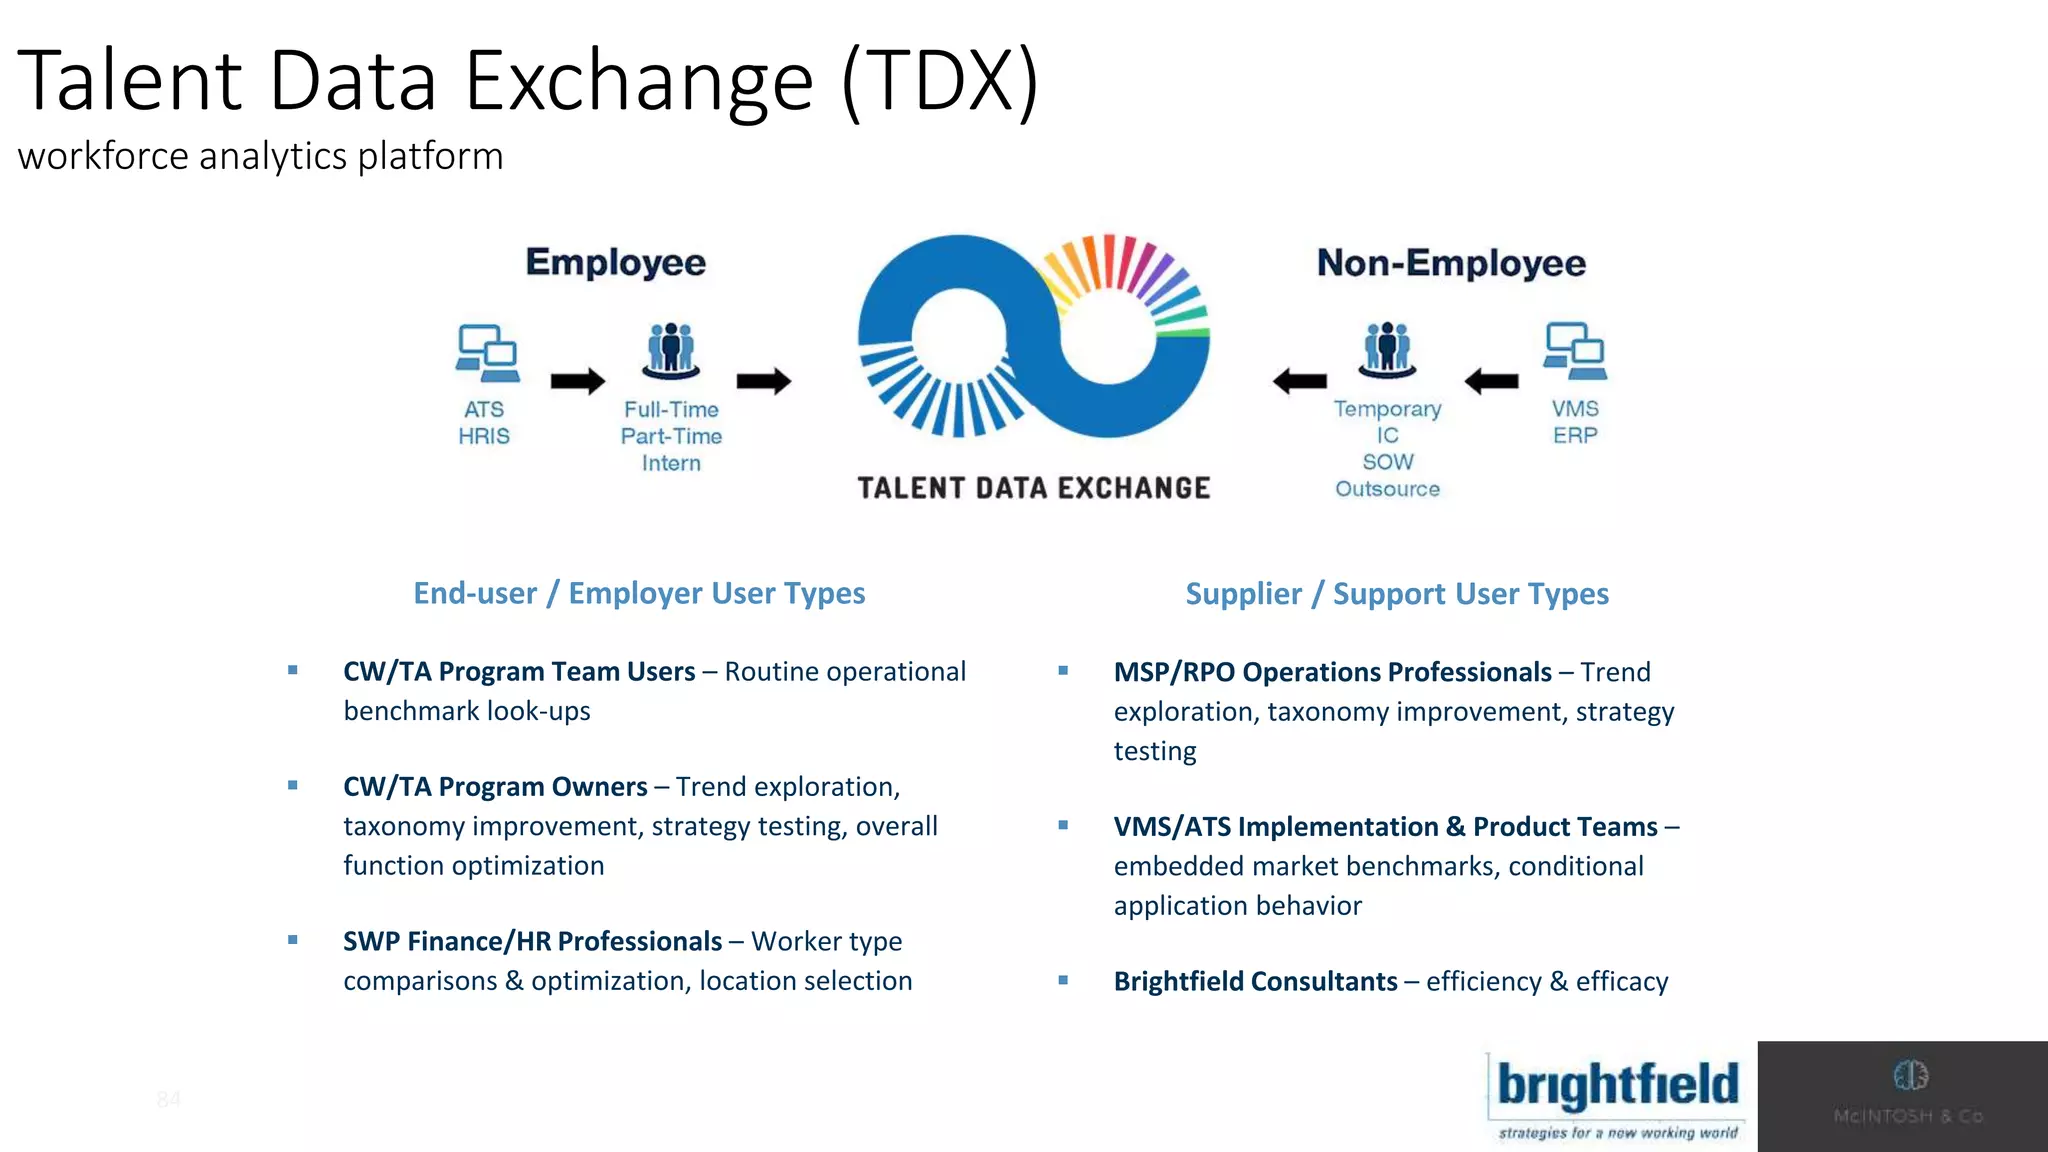
Exploration of benchmarking tools for practical application, focusing on user types and analytics platform functionalities.


![How to Measure & Improve Quality of Hire [Webcast]](https://cdn.slidesharecdn.com/ss_thumbnails/wcqualityofhirelouadler11-151210103121-thumbnail.jpg?width=640&height=640&fit=bounds)


![The Future of HR: From Metrics to Analytics [Webcast]](https://cdn.slidesharecdn.com/ss_thumbnails/hrmetricstopredictiveanalyticsslideshare-151118001524-lva1-app6892-thumbnail.jpg?width=640&height=640&fit=bounds)


![HR Joins the Analytics Revolution [REPORT]](https://cdn.slidesharecdn.com/ss_thumbnails/visier-hbr-hr-joins-the-analytics-revolution-150301132749-conversion-gate01-thumbnail.jpg?width=640&height=640&fit=bounds)


![[DSC Europe 25] Debmalya Biswas - Agentification: the art of transforming man...](https://cdn.slidesharecdn.com/ss_thumbnails/r5azlggvtqiaiiusrqdr-4-251212103249-5a12c89b-thumbnail.jpg?width=640&height=640&fit=bounds)
![[DSC Europe 25] Bogdan Daniel Maruneac - AI - It starts with you.pptx](https://cdn.slidesharecdn.com/ss_thumbnails/odov3snhrcqs9hx5ny2n-4-251205085715-f1daacfe-thumbnail.jpg?width=640&height=640&fit=bounds)
![[DSC Europe 25] Dragan Vucic - Building the Learning Organization - How AI Tr...](https://cdn.slidesharecdn.com/ss_thumbnails/8brigo2sbu6qur6gxrra-7-251205085715-6ae07d24-thumbnail.jpg?width=640&height=640&fit=bounds)
![[DSC Europe 25] Sara Polak - The Archaeology of Innovation: AI as the Next Cr...](https://cdn.slidesharecdn.com/ss_thumbnails/7ecbscdnt8mlcuqbd2ln-2-sara-polak-ai-creative-industries-251208152533-aa1fcf54-thumbnail.jpg?width=640&height=640&fit=bounds)
![[DSC Europe 25] Max Talanov - Non digital NNs.pptx](https://cdn.slidesharecdn.com/ss_thumbnails/wif8tr3gtua74qvtopke-non-digital-nns-251205090438-26b0eea6-thumbnail.jpg?width=640&height=640&fit=bounds)
![[DSC Europe 25] Goran Obradovic - The Rise of Sovereign AI: Building the Regi...](https://cdn.slidesharecdn.com/ss_thumbnails/7nw2xxixrxqdxvrb5wca-6-251205085714-ab09a2ac-thumbnail.jpg?width=640&height=640&fit=bounds)
![[DSC Europe 25] Marko Krstic - Understanding the AI Threat Landscape - Risks,...](https://cdn.slidesharecdn.com/ss_thumbnails/tiyim1ins5jvbrvzpzla-2-251209104645-c69d3553-thumbnail.jpg?width=640&height=640&fit=bounds)

![[DSC Europe 25] Milan Sekuloski - Data, Defence, and Development: Cybersecuri...](https://cdn.slidesharecdn.com/ss_thumbnails/dfrkwwx4qly6atqpbl4z-4-251209104645-c3d4b0ca-thumbnail.jpg?width=640&height=640&fit=bounds)

![[DSC Europe 25] Vladimir Jelic - The AI-Driven Security Shift From Reactive D...](https://cdn.slidesharecdn.com/ss_thumbnails/6g5gj25mtjwayniqem1t-6-251209104645-7a5a5fc6-thumbnail.jpg?width=640&height=640&fit=bounds)
![[DSC Europe 25] Bassam Maharmeh - Artificial Intelligence: Opportunities and ...](https://cdn.slidesharecdn.com/ss_thumbnails/thhfmr2fqpawzj7hsjpg-5-251211083048-2c23204f-thumbnail.jpg?width=640&height=640&fit=bounds)


![[DSC Europe 25] Vid Stimac - Policy Parsimony: Between Oversimplifying and Ov...](https://cdn.slidesharecdn.com/ss_thumbnails/eqlepagzqp2rhg3gbluh-dsc-stimac-251120-251205090438-059e7f54-thumbnail.jpg?width=640&height=640&fit=bounds)


