In this case study learn how BRIDGEi2i helped a Fortune 100 Technology company to develop an algorithm that identifies patterns in Direct Customer bookings
and to develop a unique forecasting model for just Direct customers.
In this case study learn how BRIDGEi2i helped the world's largest Contract Manufacturer to quantify the impact of demand signal variation on capacity utilization and to build a predictive algorithm to counter demand & supply uncertainties and provision linear Capacity Utilization.
In this case study learn how BRIDGEi2i helped a Fortune 100 Technology company to leverage a Teradata environment to pull Bookings, Builds and Shipment information onto 1 platform and to correlate supply chain health with KPIs, Inventory and Backlog – REAL-TIME.
In this case study learn how BRIDGEi2i helped a Fortune 100 Technology company to understand patterns in New Product Introductions and use this understanding for better insights into planning demand for NPIs
In this case study learn how BRIDGEi2i helped a Fortune 100 Technology company to develop an algorithm that simulates demand signals by associating a buffer inventory need for every SKU and to build a tracking mechanism that ensures optimality.
Analytics has demonstrably helped transform supply chains in the modern enterprise. Across Procurement, Planning and Operations functions, organizations have benefited from leveraging analytics to optimize business processes and cultivate a data-driven decision making practice. At BRIDGEi2i, we help organizations get the best out of their data assets to address key supply chain challenges.
Visual aid for onboarding new stakeholders to a large global cross-functional program (implementing Omni-Channel).
Emphasis on change management, clearly defining the role of each stakeholder and making the entire change process transparent.
Patterns for Success in Data Science EngagementsThoughtworks
This talk will focus on lessons learned over the last year during participation data science client engagements. A number of common themes emerged during these projects. Client maturity in terms of expectations, infrastructure and data history were all key contributors to success.
Using Data Analytics to Bridge the Gap between M&V 1.0 and 2.0Zondits
Isaac Wainstein, Patrick Hewlett, and Paul Dobrowsky - ERS
AESP 2017 National Conference: Session 5B: Evaluation
Summary: Successful implementation of energy efficiency as a grid resource requires defense that installed measures confidently provide capacity relief during the network peak. Measurement and verification (M&V), often the means of defending these programs, is at a crossroads, with the debate intensifying between traditional M&V approaches and the meter-based approach championed by “M&V 2.0.” Traditional M&V is the gold standard for high-certainty results required by jurisdictional evaluations, but it can be relatively cost- and time-intensive, due to the numerous on-site inspections, metering, and analyses required for each new initiative. As a result, the industry has looked to M&V 2.0 as an alternative, with real-time, building-level data from advanced metering infrastructure (AMI) reducing project costs and timelines while providing robust data to assess hourly operation by account. However, the “black box” methodology of characterizing measure-level operations from building-level data leaves many skeptical of the ability of M&V 2.0 to support energy efficiency as a resource as accurately and defensibly as traditional M&V. This paper presents the lessons learned from a recent project utilizing a granular M&V methodology that borrows successful aspects of both traditional and 2.0 approaches, maximizing accuracy and minimizing costs by using predictive analytics on previously collected end-use metered data. While no M&V approach can ever be one-size-fits-all, this hybrid model shows that the best M&V solution is often a tailored combination of both approaches.
Detailed case study on enterprise-grade data management application, custom-designed to cater the backend of an analytics-based fluid composition software deployed across renowned oil and gas industry clients.
User experience analysis of http://www.viima.com
Customer Journey creation and consulting.
Achievement: The product was partly reconfigured, some suggestions were successfully implemented.
Decision Automation in Marketing Systems using Reinforcement Learning: Dynami...Grid Dynamics
In this talk, we will discuss automatic decision-making and AI techniques for customer relationship management. First, we will present a methodology that helps to develop highly automated promotion and loyalty management systems. Next, we will walk through practical examples of how predictive models can be used to characterize customer intent, and how optimization and reinforcement learning techniques can be used to build next best action models that incorporate targeting, budgeting, and pricing decisions.
In this case study learn how BRIDGEi2i helped a Fortune 500 Consumer, Technology company to understand patterns in New Product Introduction and how data can be leveraged for the same
In this case study learn how BRIDGEi2i helped a Fortune 500 Technology company to develop a mobile-enabled dashboard to identify root cause to Throughput, Utilization and Yield metrics and delivered Real-time reporting using the Line Operations system
Digital has evolved into a major channel for organizations. From online selling to educational resources or engaging with customers, a online presence has become indispensable for organizations to compete in today's world.
BRIDGEi2i, with its Web Analytics Solution helps you manage your entire online presence across the entire analytics lifecycle.
From descriptive reporting of incoming traffic and your website quality to insights into visitor profiling and predicting visitor intent, BRIDGEi2i will partner with you to engage your visitors better.
Website path analyses, recommendation systems will help you sell and engage your customers and prospects in a personalized manner.
BRIDGEi2i helps a global risk advisory firm build a robust valuation of non-performing loan portfolio for a leading Asian bank. More about BRIDGEi2i at http://www.bridgei2i.com
In this case study learn how BRIDGEi2i helped the Software Division of a Fortune 100 Technology company to develop an algorithm to forecast revenue from SW at a product level and to understand revenue forecasts from licensing and delivery dimensions.
Fraud continues to proliferate across financial institutions, through multiple lines of business and banking channels. Increasingly sophisticated criminal tactics and the proliferation of organized crime rings make detecting fraud difficult and preventing it nearly impossible. Adding to the complexity is increased globalization and growth through mergers and acquisition, which make it harder to effectively monitor multiple portfolios and business lines. The presentation discussus best practices and ideas around the prevention, investigation, and detection of possible fraudulent activities across multiple industries.
Capgemini Smart Analytics Solutions Platform for BankingCapgemini
Capgemini's Smart Analytics Platform for Banking is a powerful platform engine that leverages new technologies and techniques for the ingestion, collation and analysis of customer data.
For more information, please visit:
https://www.capgemini.com/banking-and-capital-markets/capgemini-smart-analytics-solutions
https://www.capgemini.com/insights-data-for-financial-services
The 4 Keys to Demand Planning in 2023 and BeyondAggregage
Demand planning and forecasting processes are critical to the resilience and profitability of any supply chain, maybe now more than ever. Join Eva Dawkins for this exclusive webinar where she will cover everything you need to implement for success!
Ability to work in joint ventures and across divisions, culture and countries. Ability to integrate an understand of IP. Scientific expertise and business strategy. Ability to spur creativity while managing commercially. Expertise in functioning and decision making of regulatory requirement. Human resource skills to transform pharmaceutical segment. Dedicated support systems for web interface with real time information. Quality system must meet regulation in multiple markets plus clients internal standards.
APM event hosted by the South Wales and West of England Branch on 29 March 2023.
Speakers: Alex Constantine and Lloyd Skinner
Artificial intelligence (AI) is starting to transform industries. It can detect cancer, draw paintings, write poems and sieve through masses of data in an instance. It is no surprise, that we wonder how AI may change the project profession.
In this talk, we took a tour of understanding what an AI is and how it works. From there, we looked at which skills we will need in a future with AI and how project teams may change in organisations where project professionals work side by side with an AI.
This event covered:
An introduction to AI
Opportunities for the profession
How AI will affect the competencies we need
How we will experience the change of AI coming in
A live AI case study of AI being deployed into a project environment today
Lastly, in this talk we introduced you to the greyfly.ai flagship tool, Intelligent Project Prediction, which uses AI to provide executive intelligence to increase project success and gave a practical example of AI being used in PPM today.
https://www.apm.org.uk/news/the-impact-of-ai-on-project-professionals-introducing-a-future-with-ai-at-your-side/
How a Logical Data Fabric Enhances the Customer 360 ViewDenodo
Watch full webinar here: https://bit.ly/3GI802M
Organisations have struggled for years in understanding their customers, this has mainly been due to not having the right data available at the right point in time. In this session we will discuss the role of Data Virtualization in providing customer 360 degree view and look at some of the success stories our customers have told us about.
Foundational Strategies for Trust in Big Data Part 3: Data LineagePrecisely
For any team working with data it is not enough to understand the data needed for satisfying regulatory, compliance and data governance requirements or supporting new business initiatives. Data integration and governance teams, guided by the Chief Data Officer, need to be able to prove and validate where data sources came from and how they are used in support of critical business initiatives. Did the data come from the right source, and at the right time? As data compliance pressures on companies grow worldwide, these teams must be able to verify the provenance and lineage of data used in all their new projects/initiatives to ensure trust and confidence.
In the final part of our webcast series on Foundation Strategies for Trust in Big Data, learn how Syncsort Connect helps to support teams in documenting and meeting the regulatory, compliance and data governance requirements of their critical applications and data by supplying end-to-end data lineage. Additionally, gain insight into how together, Syncsort Connect and Syncsort Trillium can enable regulatory business use cases such as AML or fraud detection.
Demand Planning Leadership Exchange: Demand Sensing - Are You Ready? Plan4Demand
866-P4D-INFO | info@plan4demand.com | www.plan4demand.com
Gary Griffith and Joel Argo combine over 25 years of statistical forecasting experience to discuss the capabilities of Demand Sensing, what it is and what it isn’t, how this near-term forecasting method integrates with your mid to long term forecasts, and tips to shift pragmatically towards a demand-driven culture in your organization.
This session will cover key things to consider when approaching the concept of Demand Sensing in your organization, when and who should use it, and how it fits within different business scenarios.
Key take-a-ways include:
• Understanding of key concepts, capabilities & business benefits
• Overview of Demand Sensing technology considerations & system integration points
• Typical data requirements & modeling techniques
• How this next generation technique may be a fit for your organization
Is your organization ready to reap the benefits of Demand Sensing?
Maximize ROI of Insurance Digital Transformation Initiatives with Proven Data...Precisely
Many insurance carriers are transforming the way they do business by deploying new software technologies, migrating data and services to the cloud, and leveraging artificial intelligence (AI) to speed decision-making. Data is at the heart of all these initiatives, and it has a direct impact on success or failure. When that data is integrated into upstream or downstream processes, it can also have a broader impact on the operational, analytical, and compliance needs of the organization. The traditional, and often ad-hoc, tools and processes that organizations employ to support data quality, data integrity, transaction reconciliation, and exception management are often inadequate. They do not provide the speed, technical agility, and intelligence demanded by digital transformation initiatives.
Join us to explore proven methods of how insurance carriers are maximizing ROI and minimizing the time-to-value of digital transformation initiatives by:
• Aligning data governance with organizational and project objectives to reduce implementation effort and duration
• Leveraging automated controls for data quality, including balance and reconciliation of data in motion to avoid operational disruptions and maintain regulatory compliance
• Increasing efficiency and capability through centralized data integrity solution
Harnessing the Power of Advanced Insurance Analytics Through Property DataPrecisely
In commercial and residential underwriting, accurate and robust property data is essential to effectively doing business and performing analytics.
Increasing availability of location-based data and the growing capabilities of AI/ML provide an optimal opportunity for companies to capitalize on location-based data science for a competitive edge. A Willis Towers Watson survey showed that 60% of companies are targeting AI/ML capabilities in 2021 to address IT and organizational bottlenecks, such as data infrastructure, to better analyze data when evaluating risk models and reducing manual input.
However, across the board, companies are challenged with finding an effective strategy for organizing, consistently enriching, and analyzing data across the enterprise. Precisely gives your business the confidence to make better, faster decisions through trusted data with maximum accuracy, consistency, and context.
Learn how clients are leveraging advanced analytics and property enrichment solutions to:
- Improve loss ratio through more diversified risk and profitable underwriting
- Improve the reliability of property evaluation using location data enrichment for every US property
- Enrich properties with thousands of attributes for better, more accurate analytical models, such as AI and ML technologies
- Enable real-time answers to complex analytics leveraging big data analytics platforms such as Databricks or cloud container systems such as Kubernetes
Necessity of Data Lakes in the Financial Services SectorDataWorks Summit
With the emergence of regulations such as the General Data Protection Regulation from the European Union (effective May 2018), with fines up to 20m Euro, Data Lakes are emerging as the data architecture of choice amongst financial institutions. Banks are embarking on a journey to enable data scientists to unlock the value of the data silo'ed in many disparate data systems. By enabling self service data access and merging multiple streams of data by using data clustering, entity extraction, identity resolution and other techniques - we will show how banks have used Analytics to uncover business value without falling into the abyss of data swamps. The build out of the data lake requires the ingestion of data from multiple operational systems . By leveraging an automated Data Cataloging service, organizations are able to search, profile, discover, tag, track lineage and capture tribal knowledge delivered on the FICO Analytics Cloud enabling the data scientists to build innovative models, make automated decisions, track fraudulent usage, make intelligent marketing campaigns and improve the top line and bottom line for the financial institution.
Speaker:
Rohit Valia, Product Management and Strategy, Fico
How 360 Degree Data Integration Enables the Customer-centric BusinessAstera Software
Adopting a customer-centric stance for your business is only possible when you have tools that allow a holistic view of your customers. Unfortunately, most enterprise data today is fragmented and siloed in databases, operational data marts, and legacy systems. To create a 360 view, all these inputs need to be aggregated, validated, and consolidated.
Enter 360-degree data integration. Using drag & drop connectors, intuitive transformations, and automation features you can build complete, trusted data for accurate forecasting, reporting, and compliance. With a 360-degree customer view, you will get a better understanding of where your business stands with its customers and plan long-term strategies that allow you to engage them on their terms.
An overview of the new Data Exchange for SaaS Usage Model is provided in this session. This usage model addresses the challenges that many organizations face when exchanging data with a SaaS provider. It also describes steps organizations can take in the planning and implementation phases to remediate these challenges.
BRIDGEi2i has frameworks to establish Analytics CoE for Supply Chain functions within organizations. Demand planning solution of BRIDGEi2i aims at using advanced statistical forecasting coupled with real-time decision engines models for demand planning, inventory optimization.
Changing Landscape of Vendors, Technologies and Influences in the Mortgage In...Craig Leabig
Innovation For Mortgage Insurance (MI) companies into 2019: We share our thoughts on innovation in the Mortgage Industry and specifically how MI companies can truly innovate.
Data reply sneak peek: real time decision enginesconfluent
Events happen constantly in every business: a purchase in an online shop, a credit limit is hit, the mobile internet plan has been exhausted, users interact with a website. Events rule the business world. So why would you react to them hours or days later? Real-Time Decision Engines enable a variety of use cases, driving new products, increasing user experience, reducing costs and risks by reacting instantly to business events.
From personalized instantaneous marketing campaigns to reacting to user interactions, Real-Time is the key to open up a world of use cases that batch and scheduled processing cannot efficiently satisfy. In this talk, we are going to show some example use cases that Data Reply developed for some of its customers and how Real-Time Decision Engines had an impact on their businesses.
Achieving a Single View of Business – Critical Data with Master Data ManagementDATAVERSITY
Organizations today are critically reliant on data. However, as enterprise applications accumulate—often through digital transformation initiatives, new product launches, or mergers and acquisitions—business-critical data becomes increasingly siloed. As a result, organizations struggle to gain a complete view of customers, products, business partners, or other data domains scattered across legacy systems, cloud, databases, and spreadsheets—typically featuring unique ways of defining, modeling, and recording master data. Working with a network of vendors and suppliers, each with their own array of applications and data systems, only complicates the picture further. All of which inhibits an organization’s ability to realize value from their data. Master Data Management (MDM) allows organizations to consolidate data from multiple sources to create a single source of truth that provides a holistic view of enterprise-wide information. Join this webinar to discover how multi-domain MDM can eliminate the guesswork and uncertainty that results from data gaps and inconsistencies, paving the way for new, powerful insights through cross-domain intelligence.
Topics covered will include:
- Following a proven method to define and execute a data harmonization strategy that’s directly aligned with business objectives and outcomes
- Establishing a ‘contextually relevant’ golden record of consistent, valid, and accurate data across domains, applications, and services
- Creating linked relationships between data domains and surfacing up analytics on different data types to provide context and enable more informed decision-making
- Ensuring that your data governance strategy both complements and supports your data harmonization and consolidation approach
- Managing all administrative, stewardship, and governance functions across domains from a single user interface
- Allowing various user personas to utilize data and collaborate effectively with structured operating models that are ‘fit for purpose’
- Ultimately achieving a single view of critical data and related data elements that is easy to navigate
Transforming Construction with Knowledge ManagementShelley Armato
Imagine a world where everyone is on the same page? A world where turnover is done at the end of the project? OCIP and CIP closed out? This is the world we have created! #jointherevolution!
New Analytic Uses of Master Data Management in the EnterpriseDATAVERSITY
Companies all over the world are going through digital transformation now, which in many cases is all about maturing the data environment and the use of data. Master data is key to this effort. All transformative projects require master data and usually many subject areas.
What could you accomplish if cultivating master data didn’t have to be part of every project and could be accessed as a service?
We’ll look at creative enterprise use cases of Master Data Management in the enterprise. We’ll see what some MDM vendors are doing with AI and how the future of MDM will be shaped by looking at some specific MDM actions influenced by AI.
Similar to Direct Channel Demand Planning (Fortune 100 Technology Company) (20)
The Client is one of the world’s largest golf entertainment companies with assets in 11 cities across US and UK. As an initiative to improve their brand presence and perception, The Client is interested in (a) understanding the reach of its social media promotion activities and (b) innovative methods to identify & manage consumer sentiments as soon as a negative event has been triggered.
An overwhelming choice of applications, websites and digital platforms leaves our customers with multiple interaction channels and devices to connect with organizations. In a digitally connected economy, businesses need to represent a “single view” of the brand to the customer. The key here is to integrate customer information from multiple touch points and get a 360 degree view of the customer
This presentation talks about BRIDGEi2i’s Customer Experience Tracking Platform – ExTrack and how it could help businesses with near-real-time actionable recommendations for improving customer experience.
In the past decade, the HR function has undergone a significant transformation. It has evolved from being a support function to a strategic business driver. Modern day HR’s can leverage plethora of data that to manage Employee Engagement. This Flyer gives an overview about the key features of BRIDGEi2i’s Employee Analytics Management Solution - EmPOWER
In the past decade, the HR function has undergone a significant transformation. It has evolved from being a support function to a strategic business driver. Modern day HR’s can leverage plethora of data that to manage Employee Engagement. This presentation describes in detail about BRIDGEi2i’s offering on Employee Engagement Analytics and how HR’s can leverage the data eco system to get granular insights for improving Employee Engagement with snapshots of key deliverables
In the past decade, the HR function has undergone a significant transformation. It has evolved from being a support function to a strategic business driver. Modern day HR’s can leverage plethora of data that to manage Employee Engagement. This presentation provides a sneak peak in to the key deliverables of BRIDGEi2i’s Employee Engagement Analytics Solution - EmPOWER
In the past decade, the HR function has undergone a significant transformation. It has evolved from being a support function to a strategic business driver. Modern day HR’s can leverage plethora of data that to manage Employee Engagement. This presentation describes about BRIDGEi2i’s offering on Employee Engagement Analytics and how HR’s can leverage the data eco system to get granular insights for improving Employee Engagement
Market Intelligence has been a central part to a company's strategy since a long time. However, it hasn't evolved fast enough to support today's dynamic environment.
BRIDGEi2i with its Contextual Market Intelligence solutions, provides actionable insights into your target market by marrying domain knowledge, technological expertize and enablement and Analytics capabilities.
The consumer has been the king for quite a while now. Why then are organizations struggling to engage the consumer, personalize its offering and maximize the value that they can realize.
BRIDGEi2i presents a comprehensive, end to end Consumer Analytics solution that helps you know your consumer better, predict purchasing decisions and personalize recommendations
The term "gamification" was coined in 2002 by Nick Pelling, a British-born computer programmer and inventor. As defined by Gartner “Gamification is the use of game design and game mechanics to engage a target audience to change behaviors, learn new skills or engage in innovation.” The target audience may be customers, employees or the general public, but first and foremost, they are people with needs and desires who will respond to stimuli.
This whitepaper highlights the application of gamification in various organizational areas.
With all the buzz going around about Big Data and Analytics, you might think Analytics is just an escoteric buzzword used only by CXOs to improve their revenues or manage their costs. THINK AGAIN!
Analytics is much more that. Imagine a day, any day. 24 hours. What do you think can Analytics accomplish in 24 hours? From a game of golf in the morning, dropping off children to school, a quick visit to the bank, planning the anniversary gift or thinking about retirement, each day could have myriad problems and decisions for each of us.
BRIDGEi2i tells you the story of how the strategic data analytics work it does for large, global companies, actually touches customers’ lives.
Improving customer experience, simplifying logistics, helping them meet their commitments - both personal and financial; it actually helps each of us in the smallest day-to-day decisions of our lives.
24 hours of our lives. All in a day’s work for BRIDGEi2i.
Author: Prithvijit Roy
In this case study learn how BRIDGEi2i helped a Global Logistic market leader in their process of building a Best in Class key account management organization.
This presentation was presented at #CustomerAnalytics Conference, Chicago 2014 by Maruti Peri, VP Sales.
BRIDGEi2i helps businesses extract each ounce of loyalty in today's “Age of the Customers” as customer loyalty keeps fighting an uphill battle with increased product choices and proliferation of prospective client information. To know more about BRIDGEi2i Customer Intelligence Solutions, visit http://www.bridgei2i.com/customer-intelligence.html
BRIDGEi2i delivers User Experience Analysis with insights into the most critical issues and areas of improvement for the IT customers of a leading global technology company.
The world of B2B marketing has changed dramatically with the advent of internet and the increased connectivity in today's world. Traditional marketing methods are getting increasingly ineffective as buyers become more informed and highly aware of the products or solutions they need.
Today there is a lot of buzz around customer experience. Many companies have realized that investments in customer experience improvement is important not just because it helps to boost the bottom lines of their businesses but because it takes at least 4 to 6 times more cost to acquire a new customer than to retain an existing customer.
Techniques to optimize the pagerank algorithm usually fall in two categories. One is to try reducing the work per iteration, and the other is to try reducing the number of iterations. These goals are often at odds with one another. Skipping computation on vertices which have already converged has the potential to save iteration time. Skipping in-identical vertices, with the same in-links, helps reduce duplicate computations and thus could help reduce iteration time. Road networks often have chains which can be short-circuited before pagerank computation to improve performance. Final ranks of chain nodes can be easily calculated. This could reduce both the iteration time, and the number of iterations. If a graph has no dangling nodes, pagerank of each strongly connected component can be computed in topological order. This could help reduce the iteration time, no. of iterations, and also enable multi-iteration concurrency in pagerank computation. The combination of all of the above methods is the STICD algorithm. [sticd] For dynamic graphs, unchanged components whose ranks are unaffected can be skipped altogether.
Adjusting primitives for graph : SHORT REPORT / NOTESSubhajit Sahu
Graph algorithms, like PageRank Compressed Sparse Row (CSR) is an adjacency-list based graph representation that is
Multiply with different modes (map)
1. Performance of sequential execution based vs OpenMP based vector multiply.
2. Comparing various launch configs for CUDA based vector multiply.
Sum with different storage types (reduce)
1. Performance of vector element sum using float vs bfloat16 as the storage type.
Sum with different modes (reduce)
1. Performance of sequential execution based vs OpenMP based vector element sum.
2. Performance of memcpy vs in-place based CUDA based vector element sum.
3. Comparing various launch configs for CUDA based vector element sum (memcpy).
4. Comparing various launch configs for CUDA based vector element sum (in-place).
Sum with in-place strategies of CUDA mode (reduce)
1. Comparing various launch configs for CUDA based vector element sum (in-place).
Ch03-Managing the Object-Oriented Information Systems Project a.pdf
Direct Channel Demand Planning (Fortune 100 Technology Company)
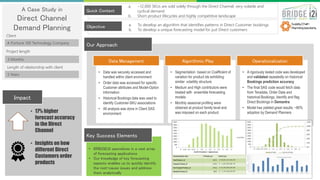
1. A Case Study in
Direct Channel
Demand Planning
A Fortune 100 Technology Company
Quick Context
Objective
• 17% higher
forecast accuracy
in the Direct
Channel
• Insights on how
different Direct
Customers order
products
Impact
• BRIDGEi2i specializes in a vast array
of forecasting applications
• Our knowledge of key forecasting
aspects enables us to quickly identify
the root-cause issues and address
them analytically
Key Success Elements
Our Approach
3 Months
3 Years
Client
Project length
Length of relationship with client
• Data was securely accessed and
handled within client environment
• Order data was accessed for specific
Customer attributes and Model-Option
information
• Historical Bookings data was used to
identify Customer-SKU associations
• All analysis was done in Client SAS
environment
• Segmentation based on Coefficient of
variation for product ids exhibiting
similar volatility structure
• Medium and High contributors were
treated with ensemble forecasting
models
• Monthly seasonal profiling were
obtained at product family level and
was imposed on each product
• A rigorously tested code was developed
and validated repeatedly on historical
Bookings prediction accuracy
• The final SAS code would fetch data
from Teradata, Order Data and
historical Bookings, Identify and flag
Direct Bookings in Demantra
• Model has yielded great results; ~80%
adoption by Demand Planners
Data Management Algorithmic Play Operationalization
a. ~12,000 SKUs are sold solely through the Direct Channel; very volatile and
cyclical demand
b. Short product lifecycles and highly competitive landscape
a. To develop an algorithm that identifies patterns in Direct Customer bookings
b. To develop a unique forecasting model for just Direct customers