Download as PDF, PPTX
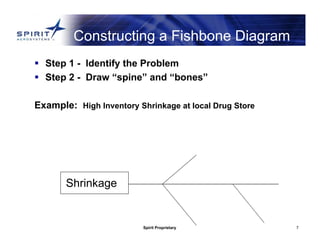
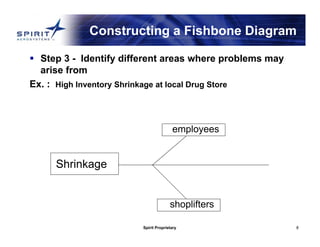
![Spirit Proprietary 6
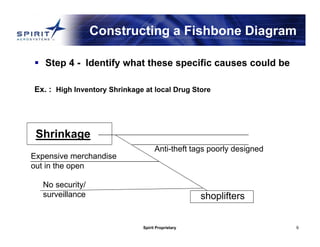
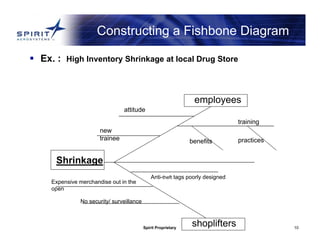
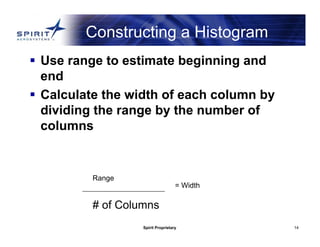
The Basic Seven (B7)
Tools of Quality
1] Fishbone Diagrams
No statistics involved
Maps out a process/problem
Makes improvement easier
Looks like a “Fish Skeleton”](https://image.slidesharecdn.com/7qctoolpresentationmaterial-140808031712-phpapp02/85/7-qc-tool-presentation-material-6-320.jpg)
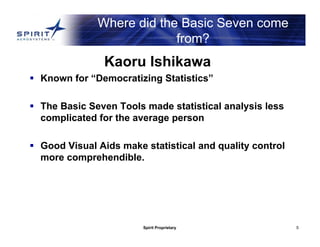
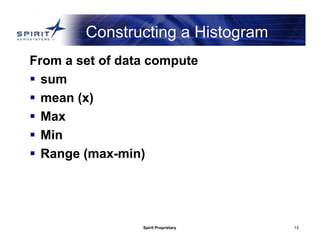
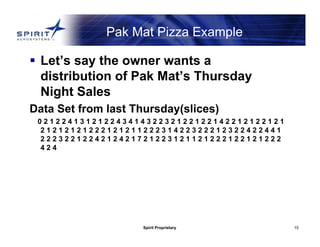
![Spirit Proprietary 12
The Basic Seven (B7)
Tools of Quality
2] Histograms
Bar chart
Used to graphically represent groups of data](https://image.slidesharecdn.com/7qctoolpresentationmaterial-140808031712-phpapp02/85/7-qc-tool-presentation-material-12-320.jpg)
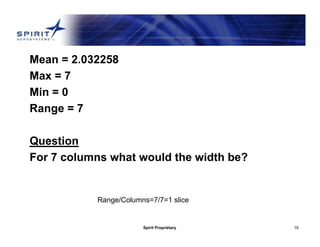
![Spirit Proprietary 19
The Basic Seven (B7)
Tools of Quality
3] Pareto Analysis
Very similar to Histograms
Use of the 80/20 rule
Use of percentages to show importance](https://image.slidesharecdn.com/7qctoolpresentationmaterial-140808031712-phpapp02/85/7-qc-tool-presentation-material-19-320.jpg)
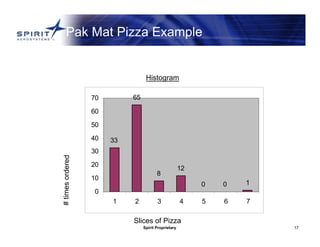
![Spirit Proprietary 23
The Basic Seven (B7)
Tools of Quality
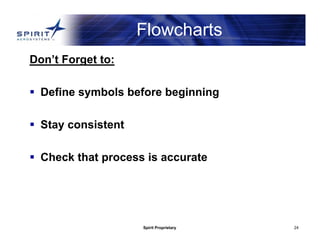
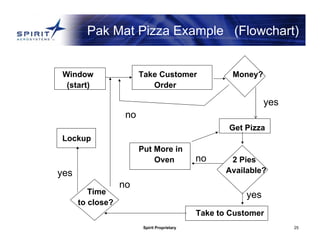
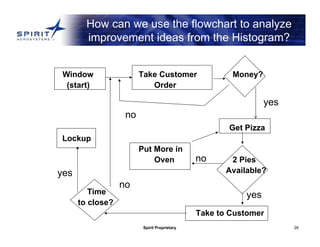
4] Flowcharts
A graphical picture of a PROCESS
Process Decision
The process flow](https://image.slidesharecdn.com/7qctoolpresentationmaterial-140808031712-phpapp02/85/7-qc-tool-presentation-material-23-320.jpg)
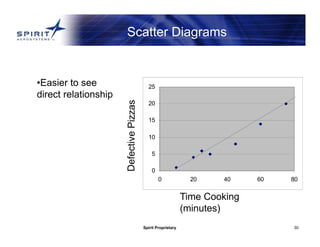
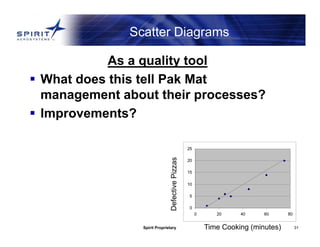
![Spirit Proprietary 28
The Basic Seven (B7)
Tools of Quality
5] Scatter Plots
2 Dimensional X/Y plots
Used to show relationship between
independent(x) and dependent(y)
variables](https://image.slidesharecdn.com/7qctoolpresentationmaterial-140808031712-phpapp02/85/7-qc-tool-presentation-material-28-320.jpg)
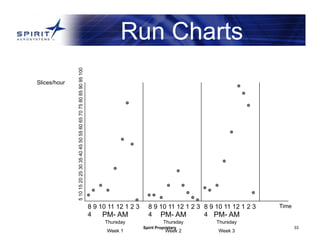
![Spirit Proprietary 32
The Basic Seven (B7)
Tools of Quality
6] Run charts
Time-based (x-axis)
Cyclical
Look for patterns](https://image.slidesharecdn.com/7qctoolpresentationmaterial-140808031712-phpapp02/85/7-qc-tool-presentation-material-32-320.jpg)
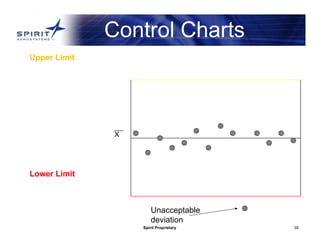
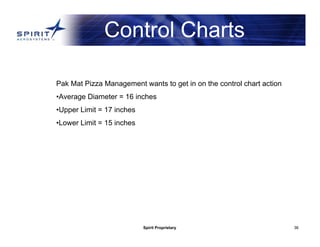
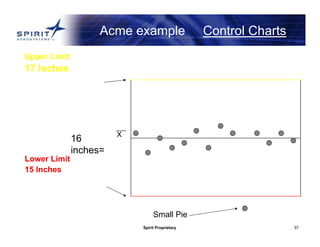
![Spirit Proprietary 34
The Basic Seven (B7)
Tools of Quality
7] Control Charts
Deviation from Mean
Upper and Lower Spec’s
Range](https://image.slidesharecdn.com/7qctoolpresentationmaterial-140808031712-phpapp02/85/7-qc-tool-presentation-material-34-320.jpg)

The document discusses Kaoru Ishikawa's development of the Seven Basic Tools of Quality Control. Ishikawa was inspired by W. Edwards Deming's lectures on quality control tools in Japan in the 1950s. Ishikawa formalized seven graphical tools - including fishbone diagrams, histograms, Pareto charts, flowcharts, scatter plots, run charts, and control charts - that could be easily understood and applied by all workers to solve 95% of quality-related problems. The tools provide visual means to analyze processes, identify issues, and monitor quality improvements.


![7 qc tools[1] to print](https://cdn.slidesharecdn.com/ss_thumbnails/7qctools1toprint-191017092858-thumbnail.jpg?width=640&height=640&fit=bounds)


![7 qc tools training material[1]](https://cdn.slidesharecdn.com/ss_thumbnails/7qctoolstrainingmaterial1-120925054558-phpapp02-thumbnail.jpg?width=640&height=640&fit=bounds)
![7 Quality Control Tools (SQC Model) [MARCH 2009]](https://cdn.slidesharecdn.com/ss_thumbnails/cfakepath7qctools-100630225608-phpapp01-thumbnail.jpg?width=640&height=640&fit=bounds)


