Introduction
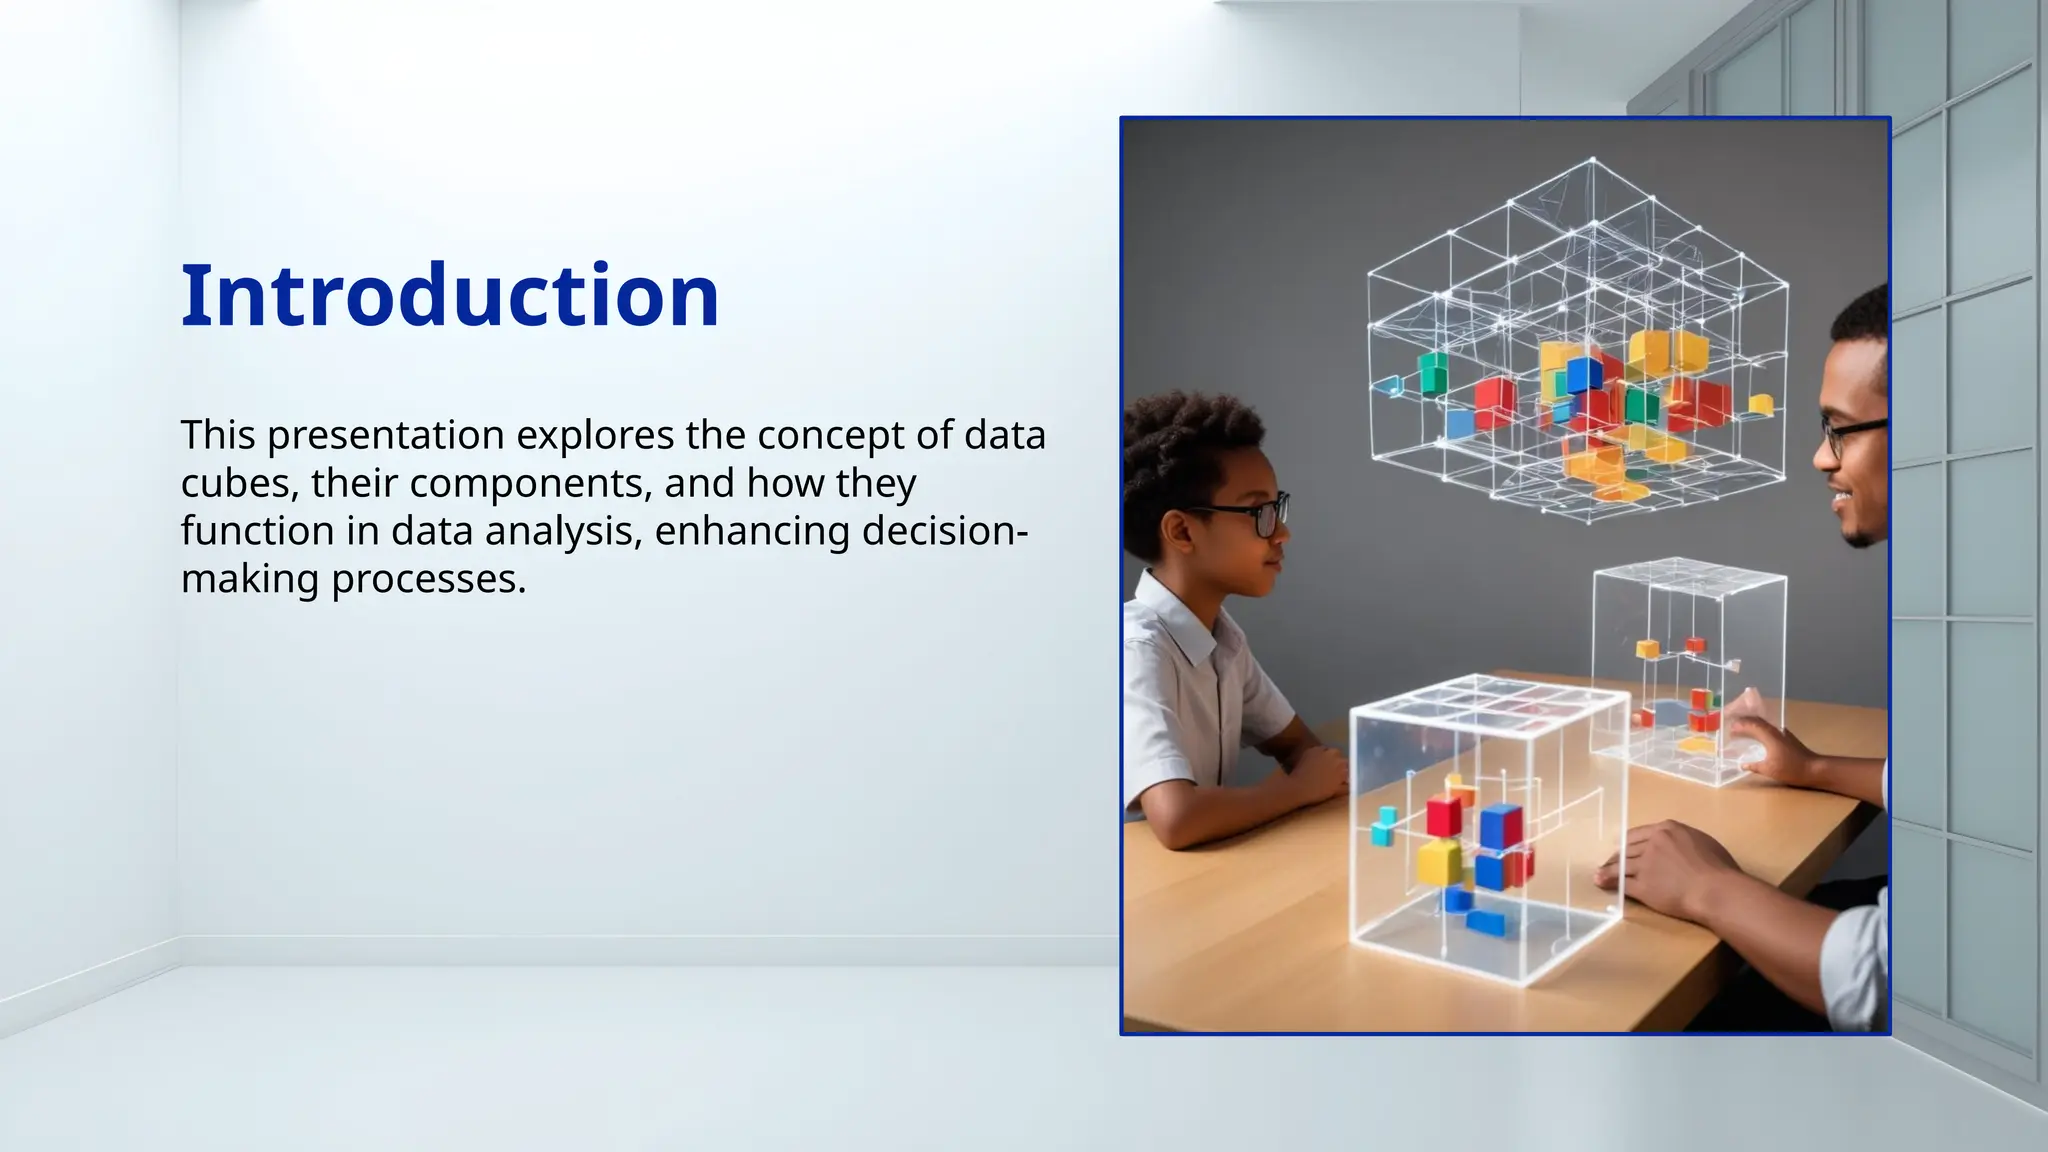
This presentation exploresthe concept of data
cubes, their components, and how they
function in data analysis, enhancing decision-
making processes.
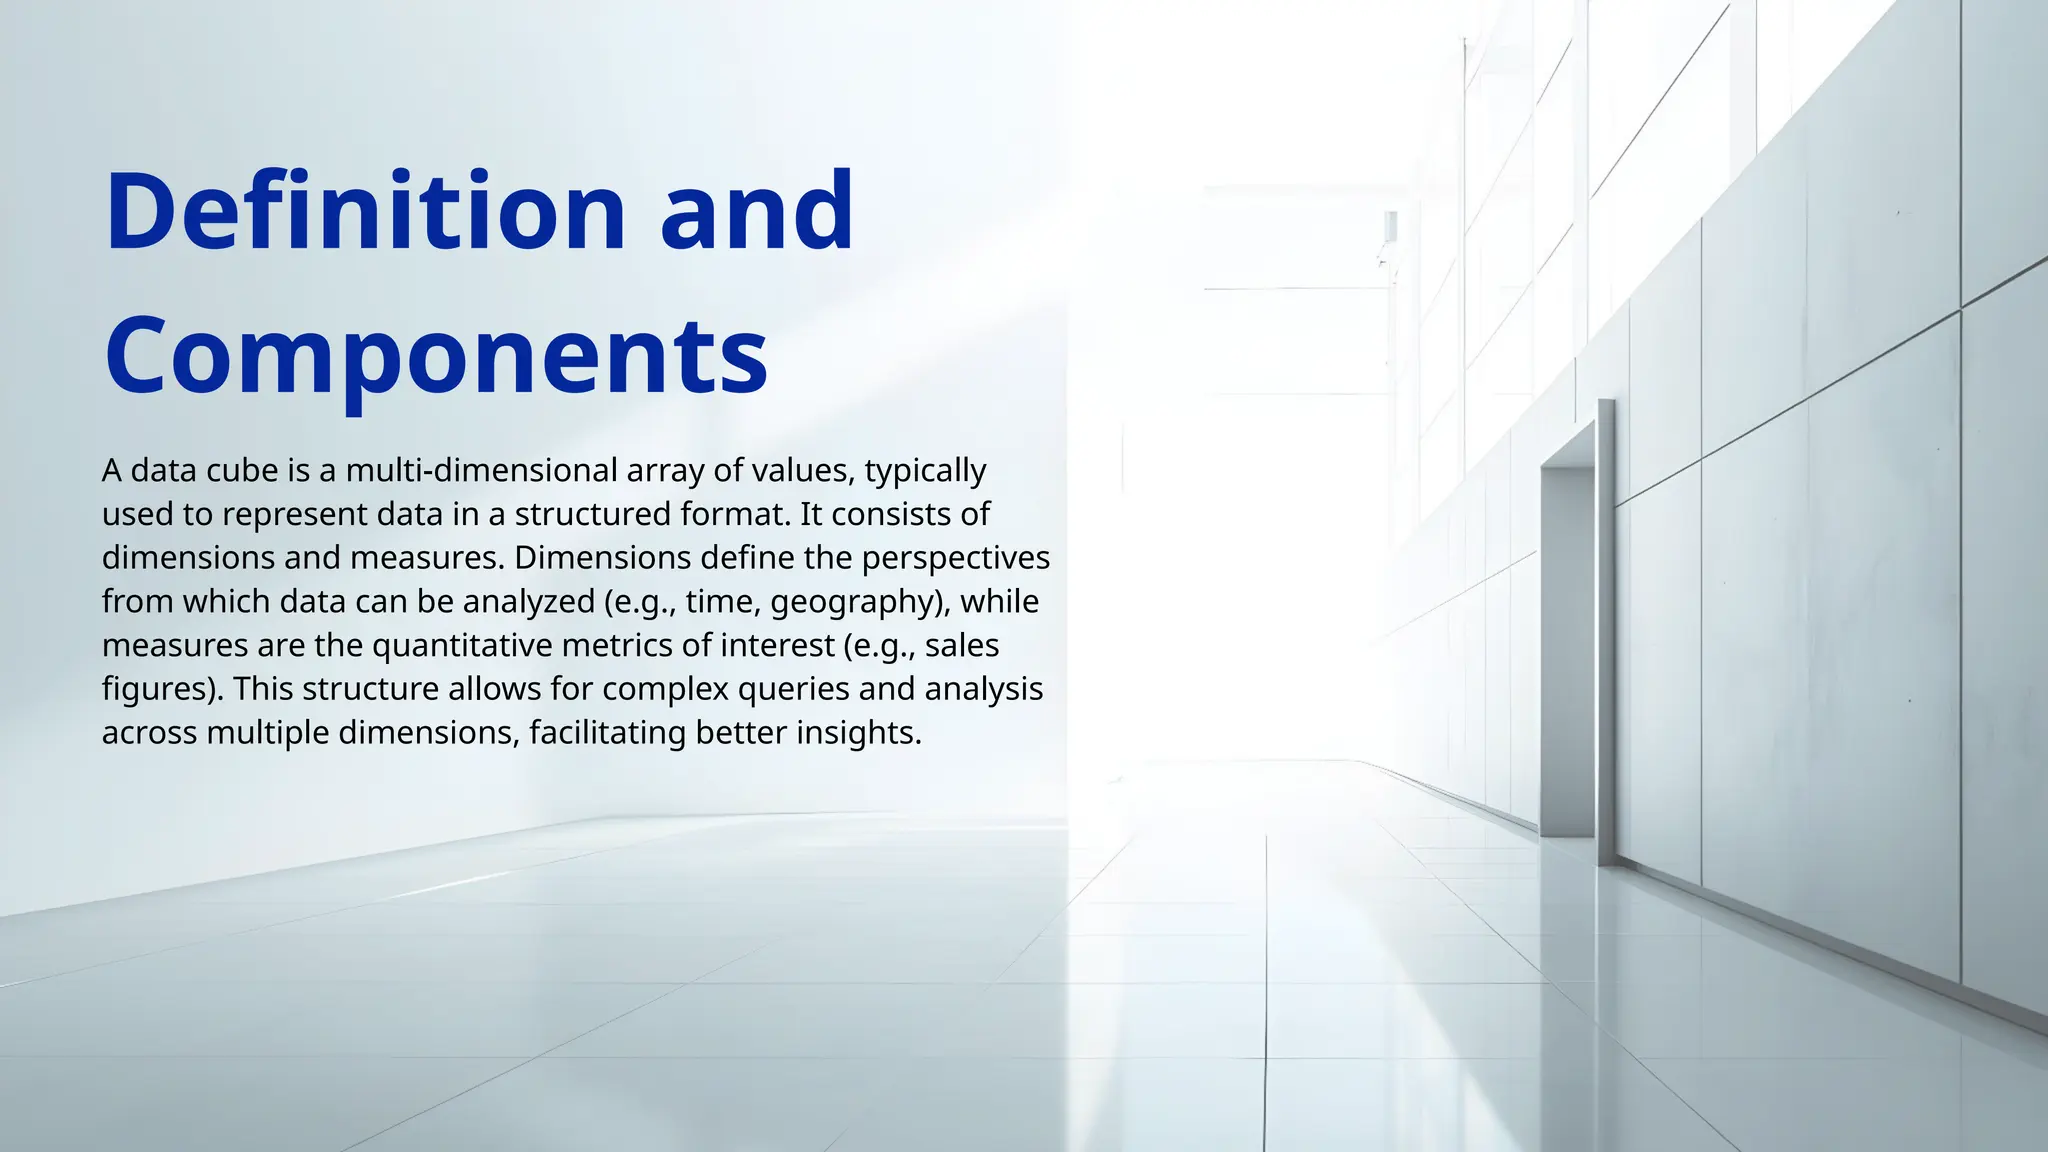
A data cubeis a multi-dimensional array of values, typically
used to represent data in a structured format. It consists of
dimensions and measures. Dimensions define the perspectives
from which data can be analyzed (e.g., time, geography), while
measures are the quantitative metrics of interest (e.g., sales
figures). This structure allows for complex queries and analysis
across multiple dimensions, facilitating better insights.
Definition and
Components
5.
Functionality in Data
Analysis
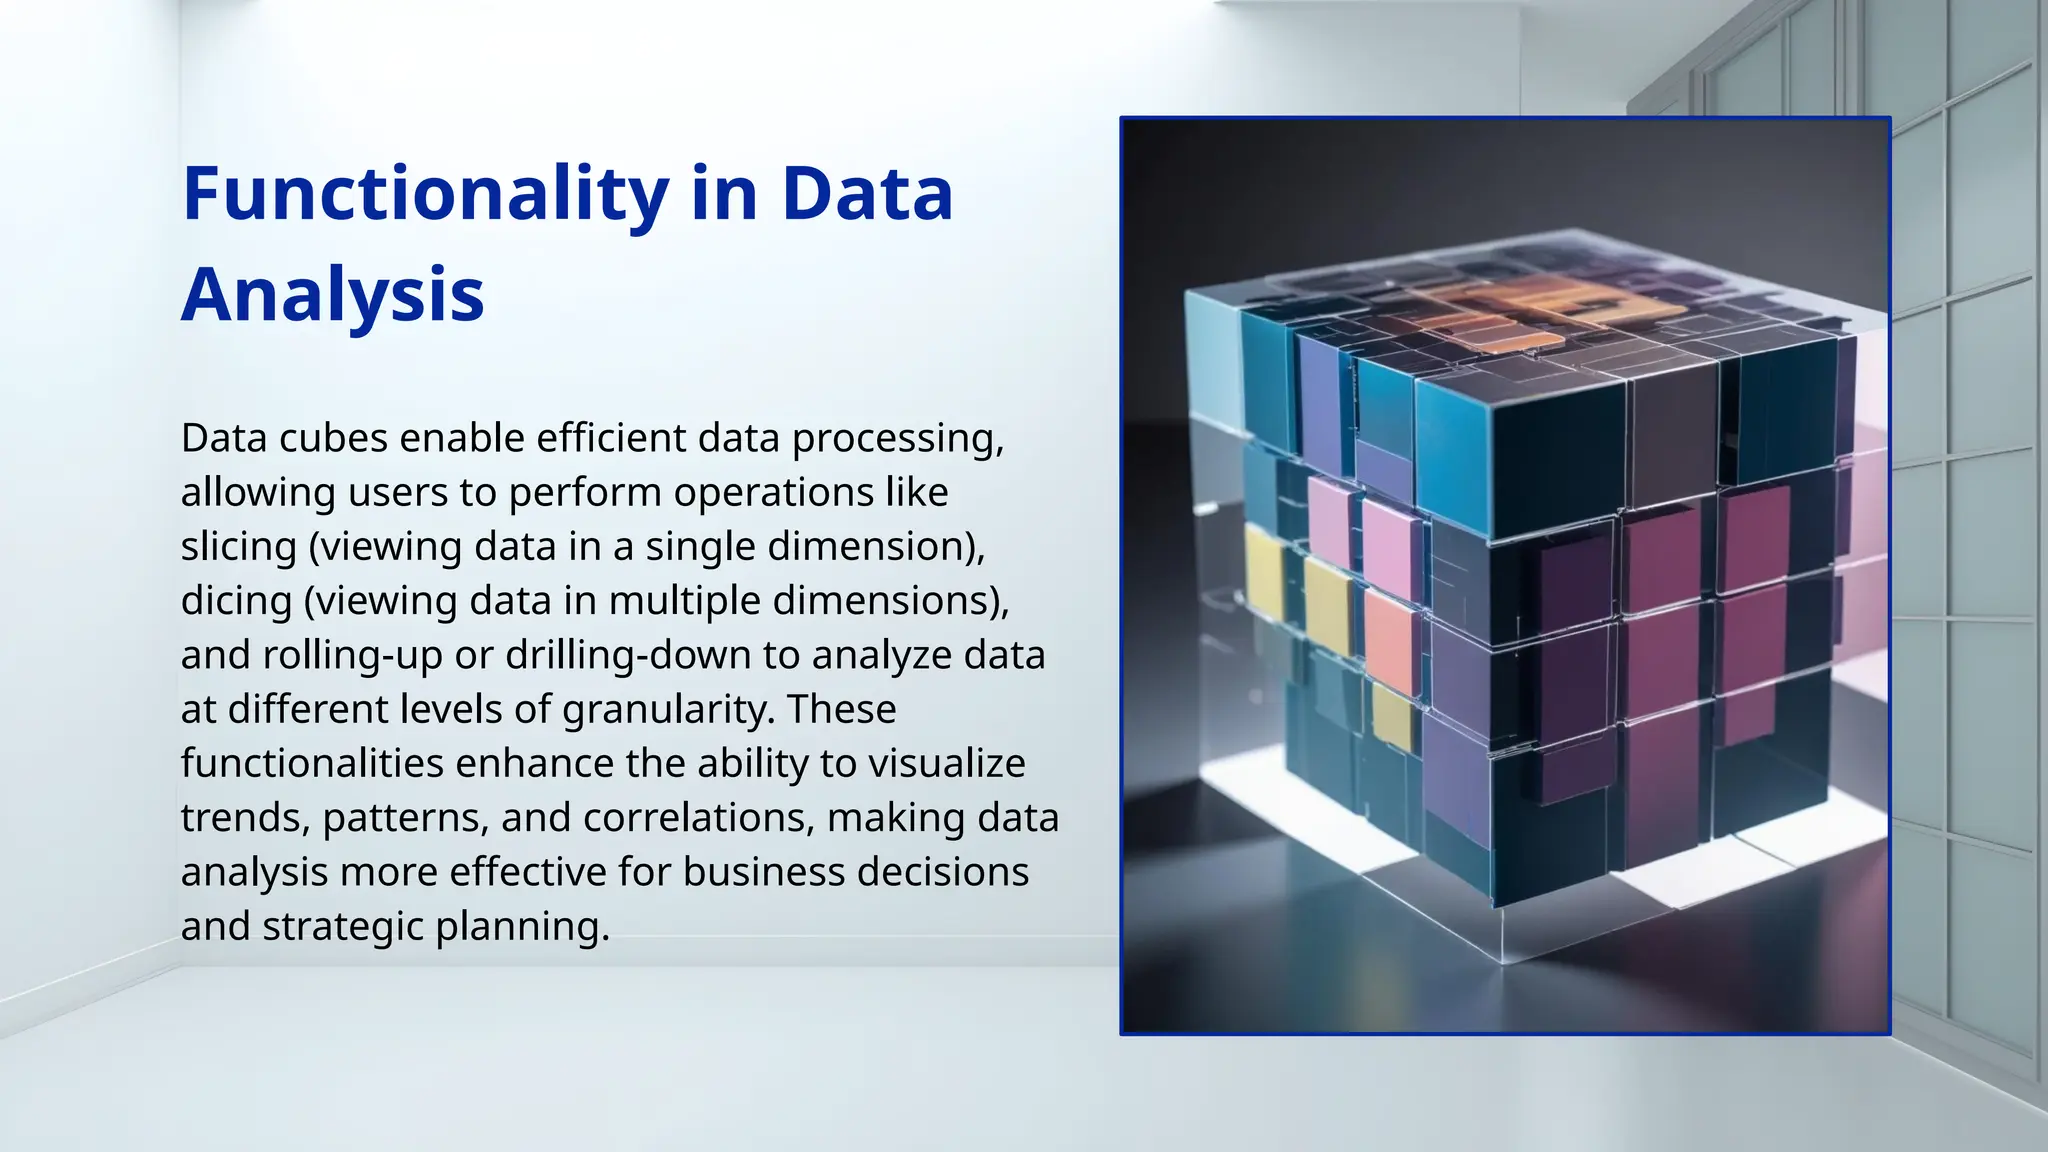
Datacubes enable efficient data processing,
allowing users to perform operations like
slicing (viewing data in a single dimension),
dicing (viewing data in multiple dimensions),
and rolling-up or drilling-down to analyze data
at different levels of granularity. These
functionalities enhance the ability to visualize
trends, patterns, and correlations, making data
analysis more effective for business decisions
and strategic planning.
6.
Data cubes andtraditional databases serve different purposes.
Traditional databases are optimized for transactional operations (OLTP),
wherein data is inserted, updated, and deleted with high efficiency. In
contrast, data cubes are designed for data analysis and querying (OLAP),
facilitating fast retrieval of multi-dimensional datasets. While traditional
databases usually utilize normalized data structures to minimize
redundancy and ensure data integrity, data cubes leverage denormalized
structures optimized for query performance, allowing users to quickly
access and analyze data across various dimensions.
Comparison with
Traditional Databases
Online Analytical Processing(OLAP) refers to technologies that enable
users to analyze data stored in databases. There are three primary
types of OLAP: MOLAP (Multidimensional OLAP), which uses a
multidimensional data cube for data storage, providing fast query
performance; ROLAP (Relational OLAP), which stores data in relational
databases, allowing for larger datasets but with potentially slower
access times; and HOLAP (Hybrid OLAP), which combines both MOLAP
and ROLAP approaches, providing flexibility in performance and
storage without compromising detail.
OLAP Types (MOLAP,
ROLAP, HOLAP)
9.
OLAP Operations (Slice,
Dice,Drill-down)
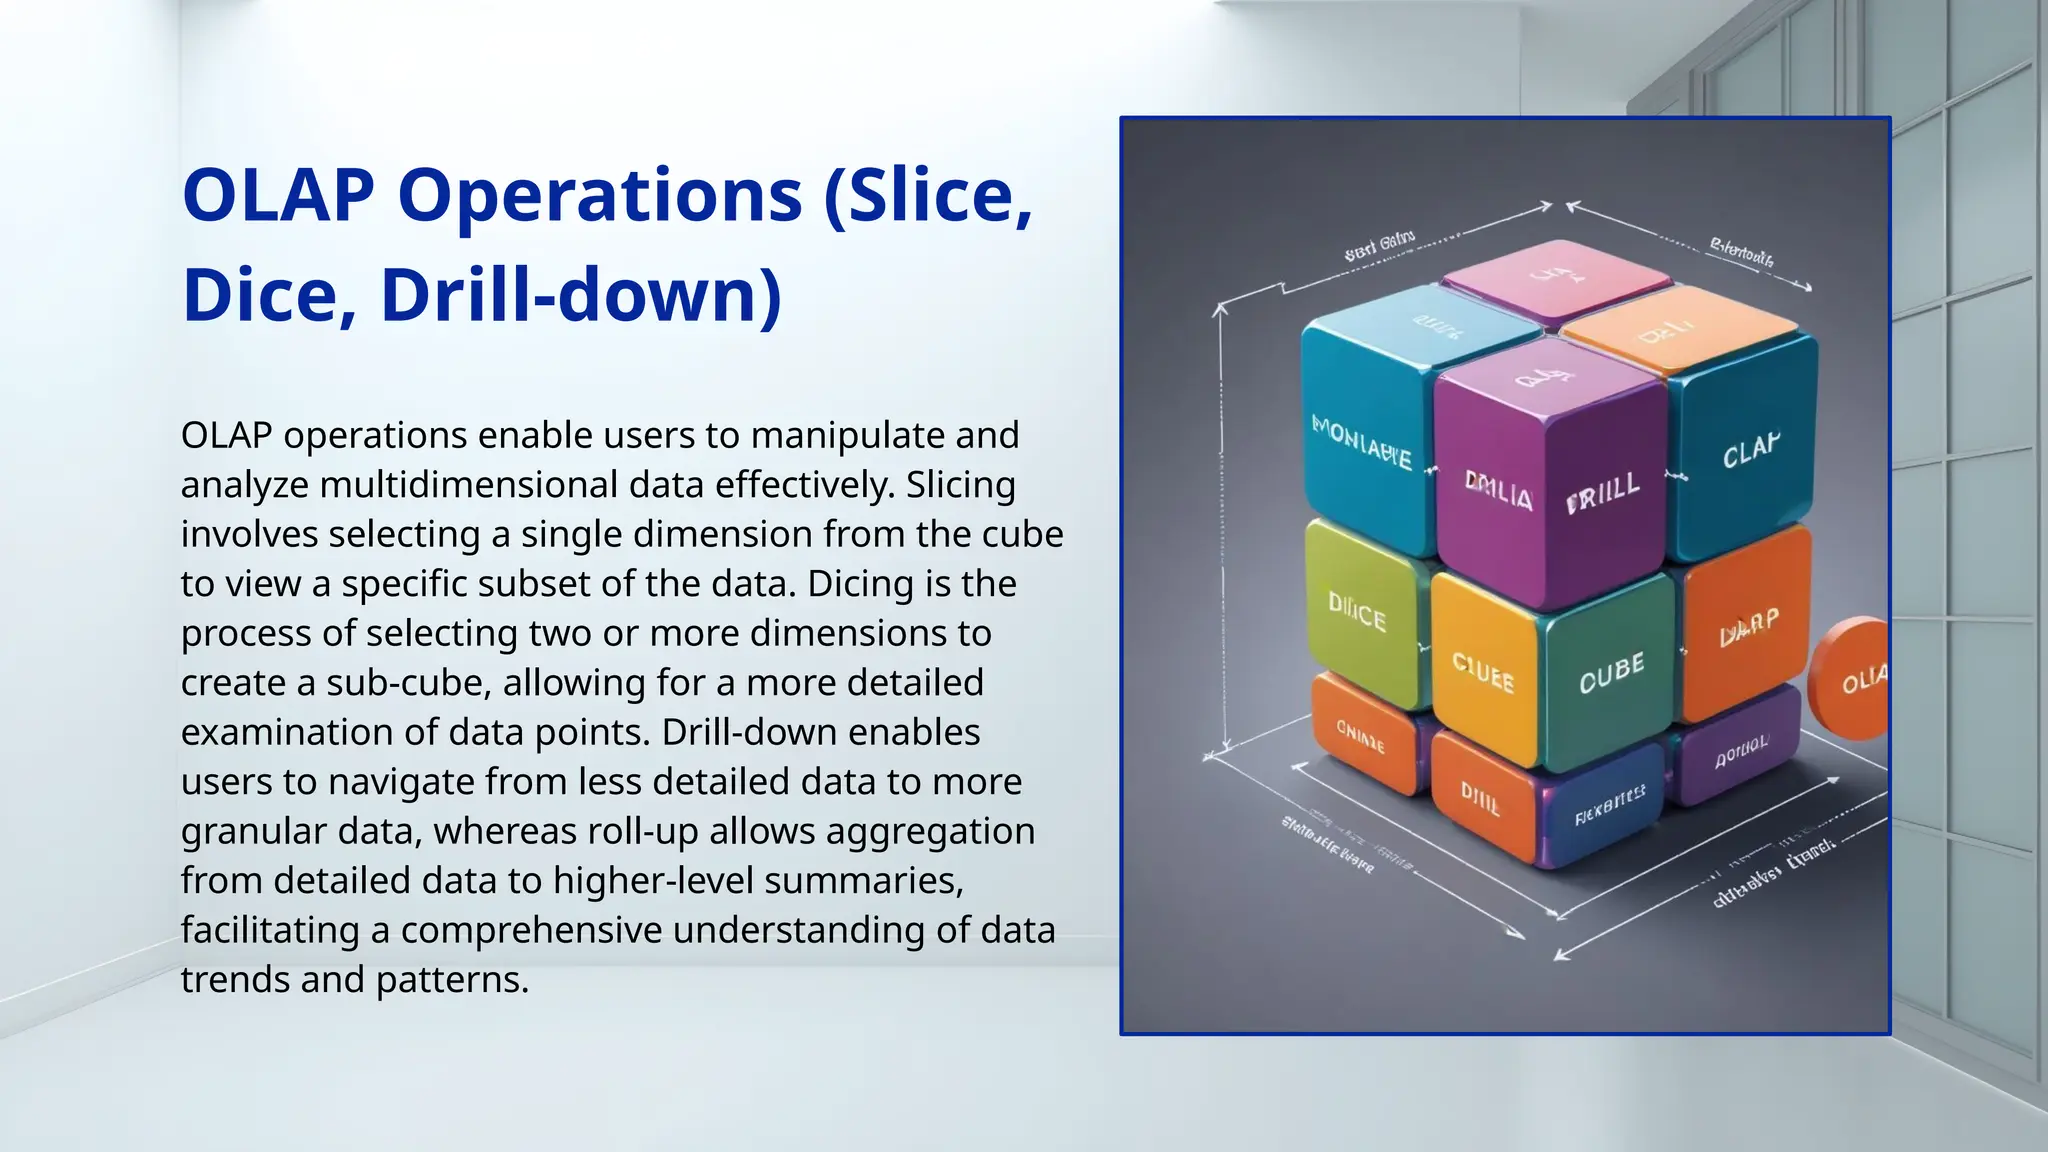
OLAP operations enable users to manipulate and
analyze multidimensional data effectively. Slicing
involves selecting a single dimension from the cube
to view a specific subset of the data. Dicing is the
process of selecting two or more dimensions to
create a sub-cube, allowing for a more detailed
examination of data points. Drill-down enables
users to navigate from less detailed data to more
granular data, whereas roll-up allows aggregation
from detailed data to higher-level summaries,
facilitating a comprehensive understanding of data
trends and patterns.
10.
OLAP systems arepivotal in business intelligence applications, allowing
companies to derive insights from large datasets quickly. Use cases
include financial reporting, where businesses analyze sales trends and
expenses over various periods; market analysis, enabling the
understanding of customer behavior across different demographics;
and performance metrics, allowing organizations to track key
performance indicators (KPIs) efficiently. Overall, OLAP enhances
decision-making by providing timely access to critical business insights,
fostering data-driven strategies.
Use Cases in Business
Intelligence
11.
In conclusion, datacubes and OLAP technologies are vital
components in the field of data management and analytics.
Data cubes provide a structured, efficient way of storing and
querying data, while OLAP enables advanced analytical
operations that drive business intelligence. Understanding
their definitions, functionalities, and applications can
significantly enhance data-driven decision-making processes
within organizations.
Conclusions
12.
CREDITS: This presentationtemplate was created by Slidesgo, and
includes icons, infographics & images by Freepik
Thank you!
Do you have any questions?