This document summarizes a presentation on climate data and projections focusing on limiting global warming to less than 2 degrees Celsius. It discusses the work of GERICS (the Climate Service Center Germany) in developing solutions for regional climate modeling, impacts analysis, and climate adaptation toolkits. Key points covered include:
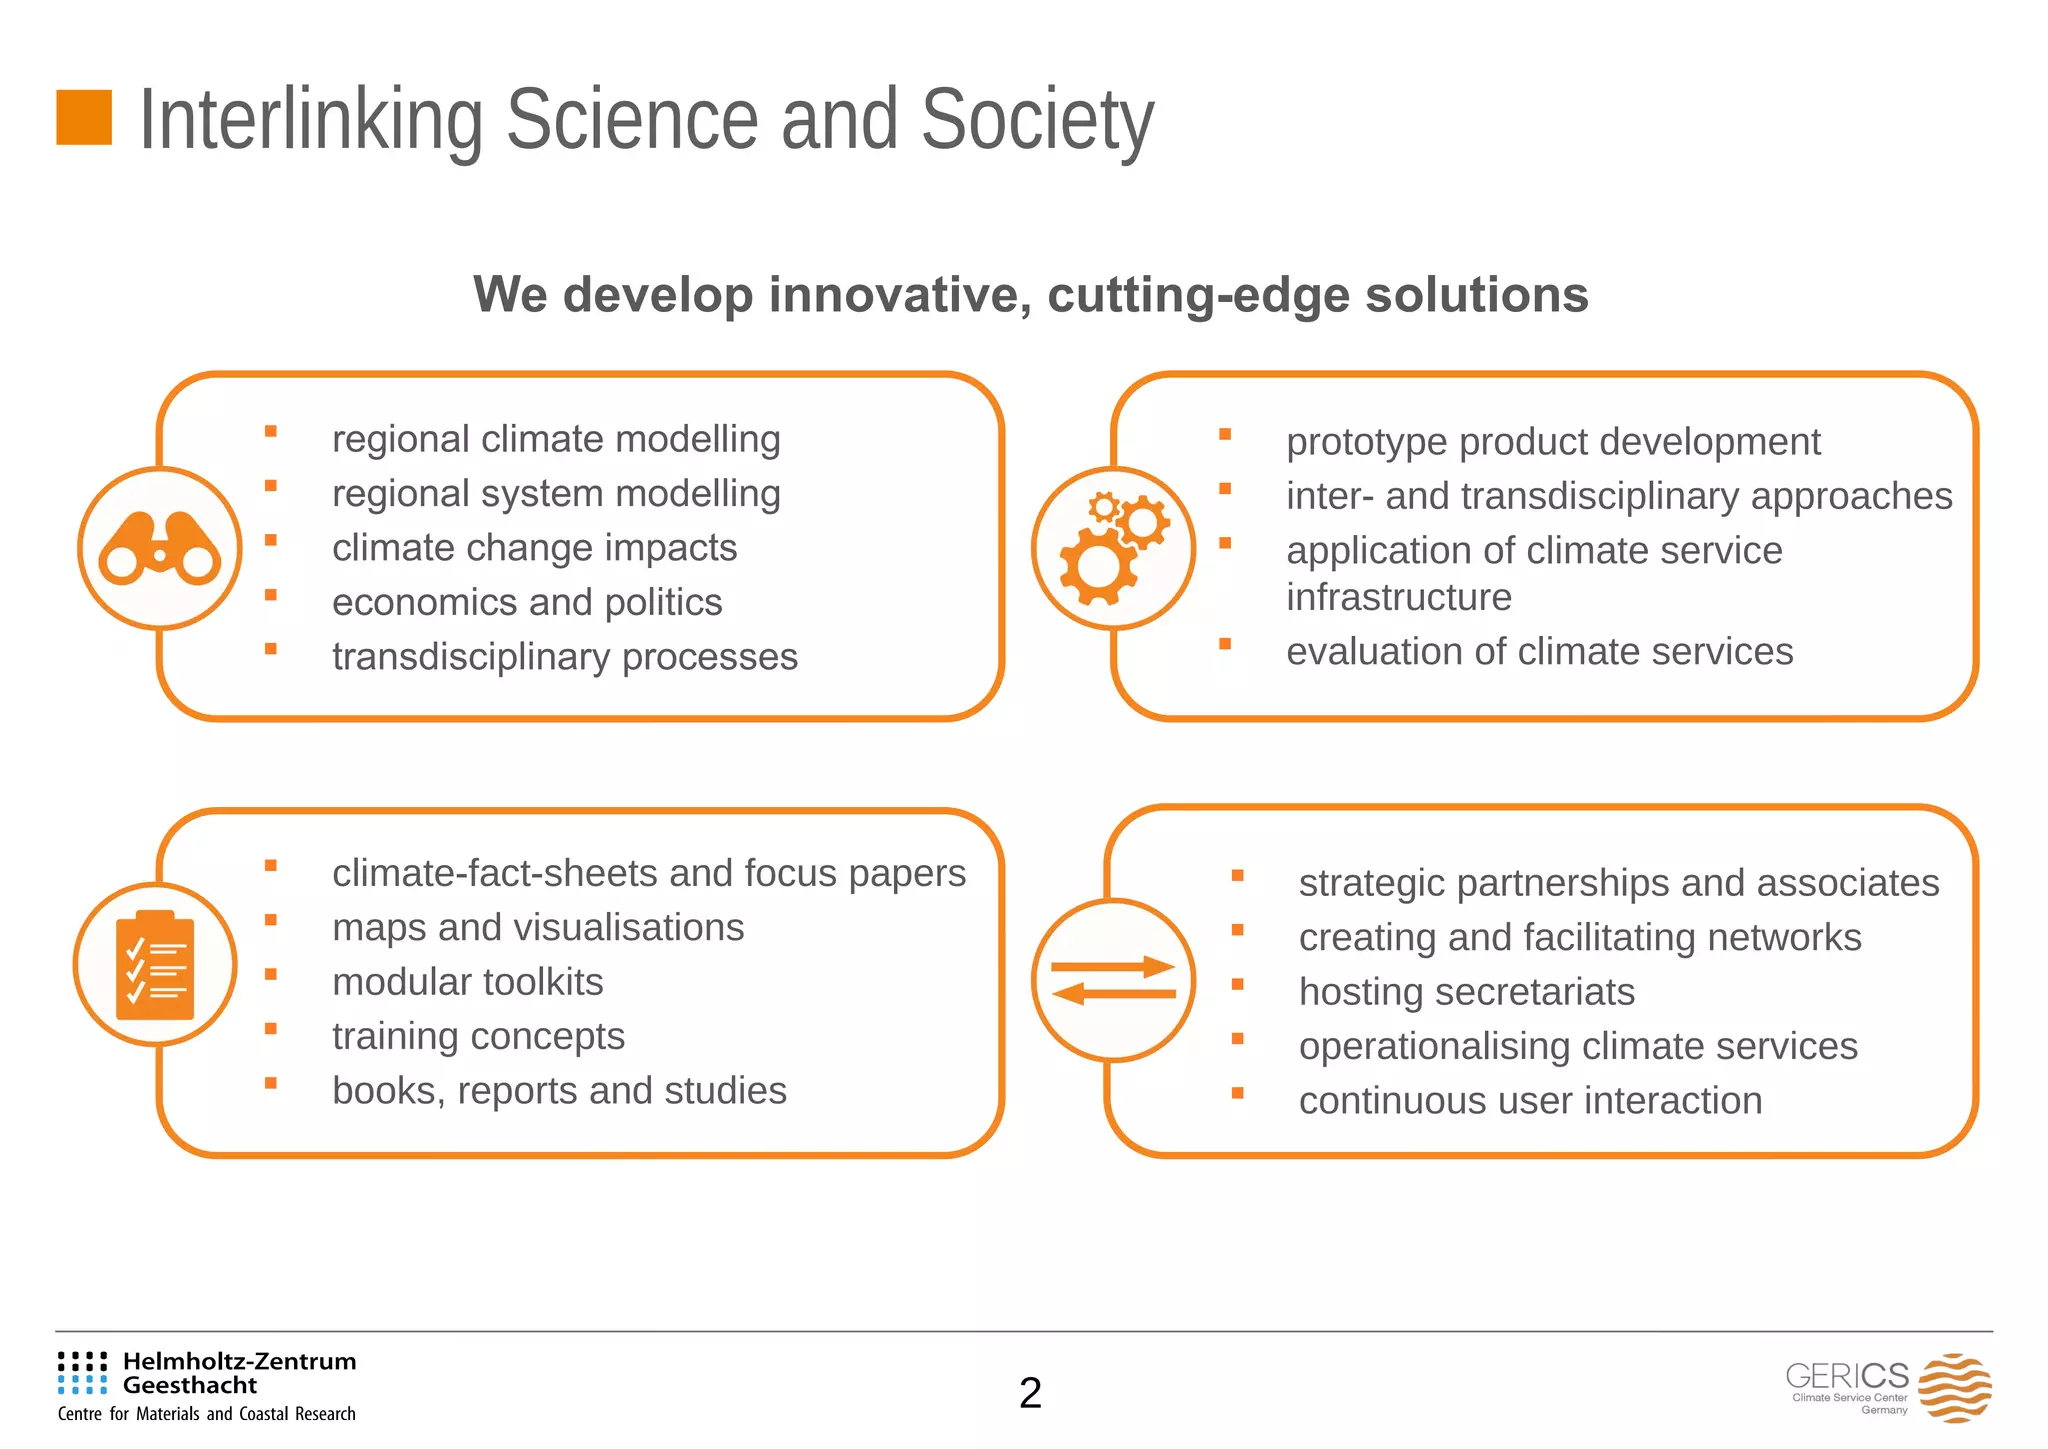
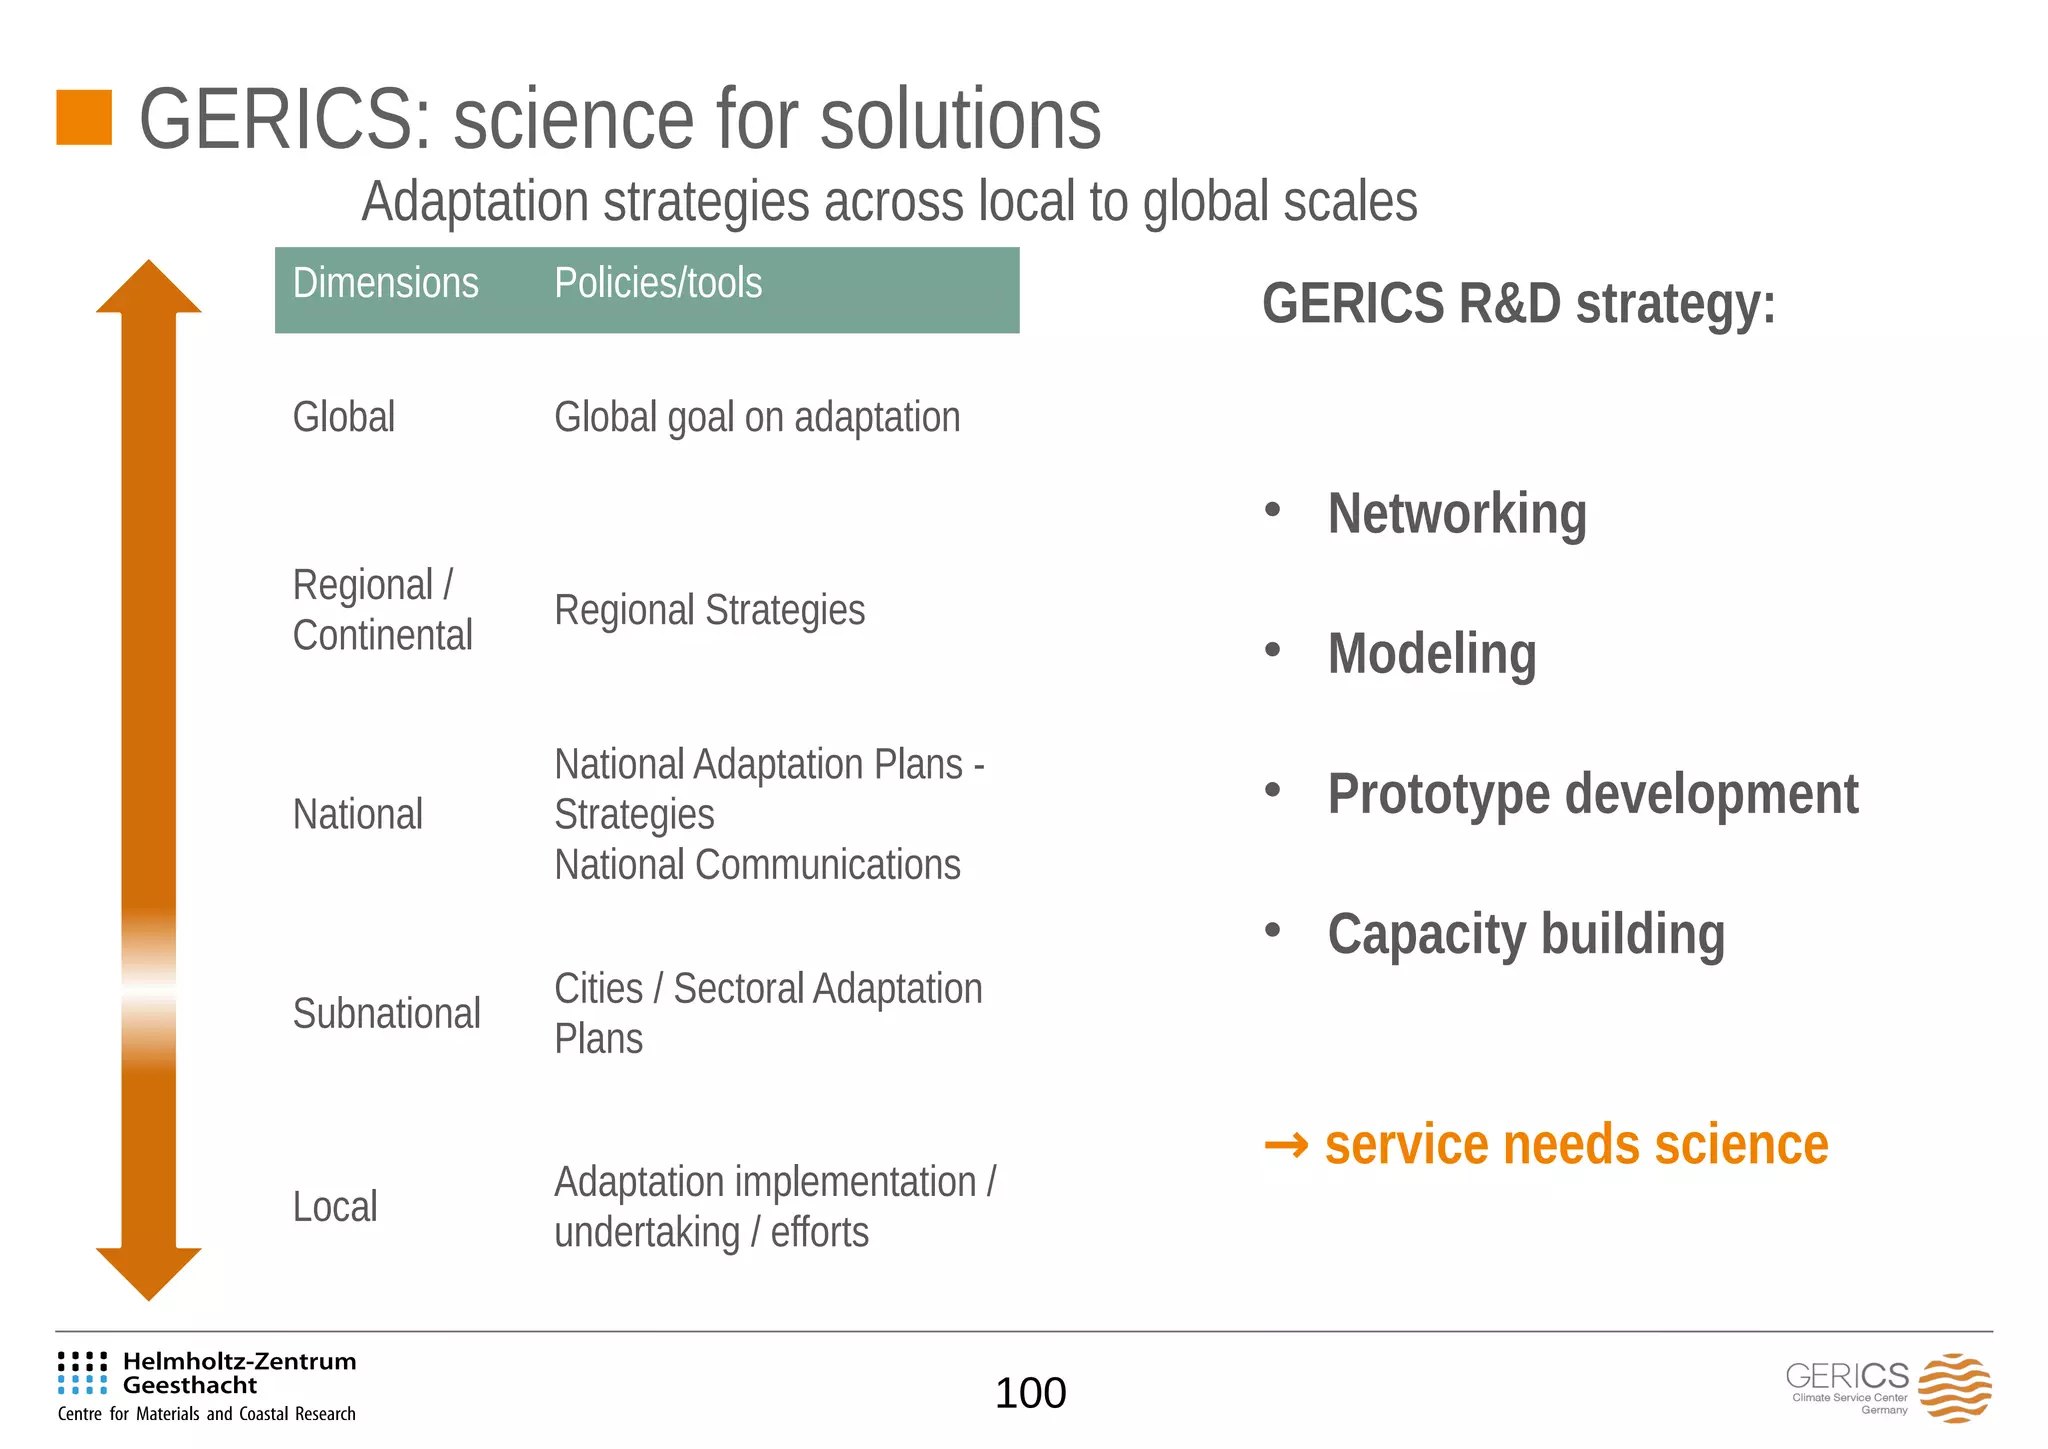
- GERICS' interdisciplinary approach to regional climate modeling, impacts assessment, and stakeholder engagement.
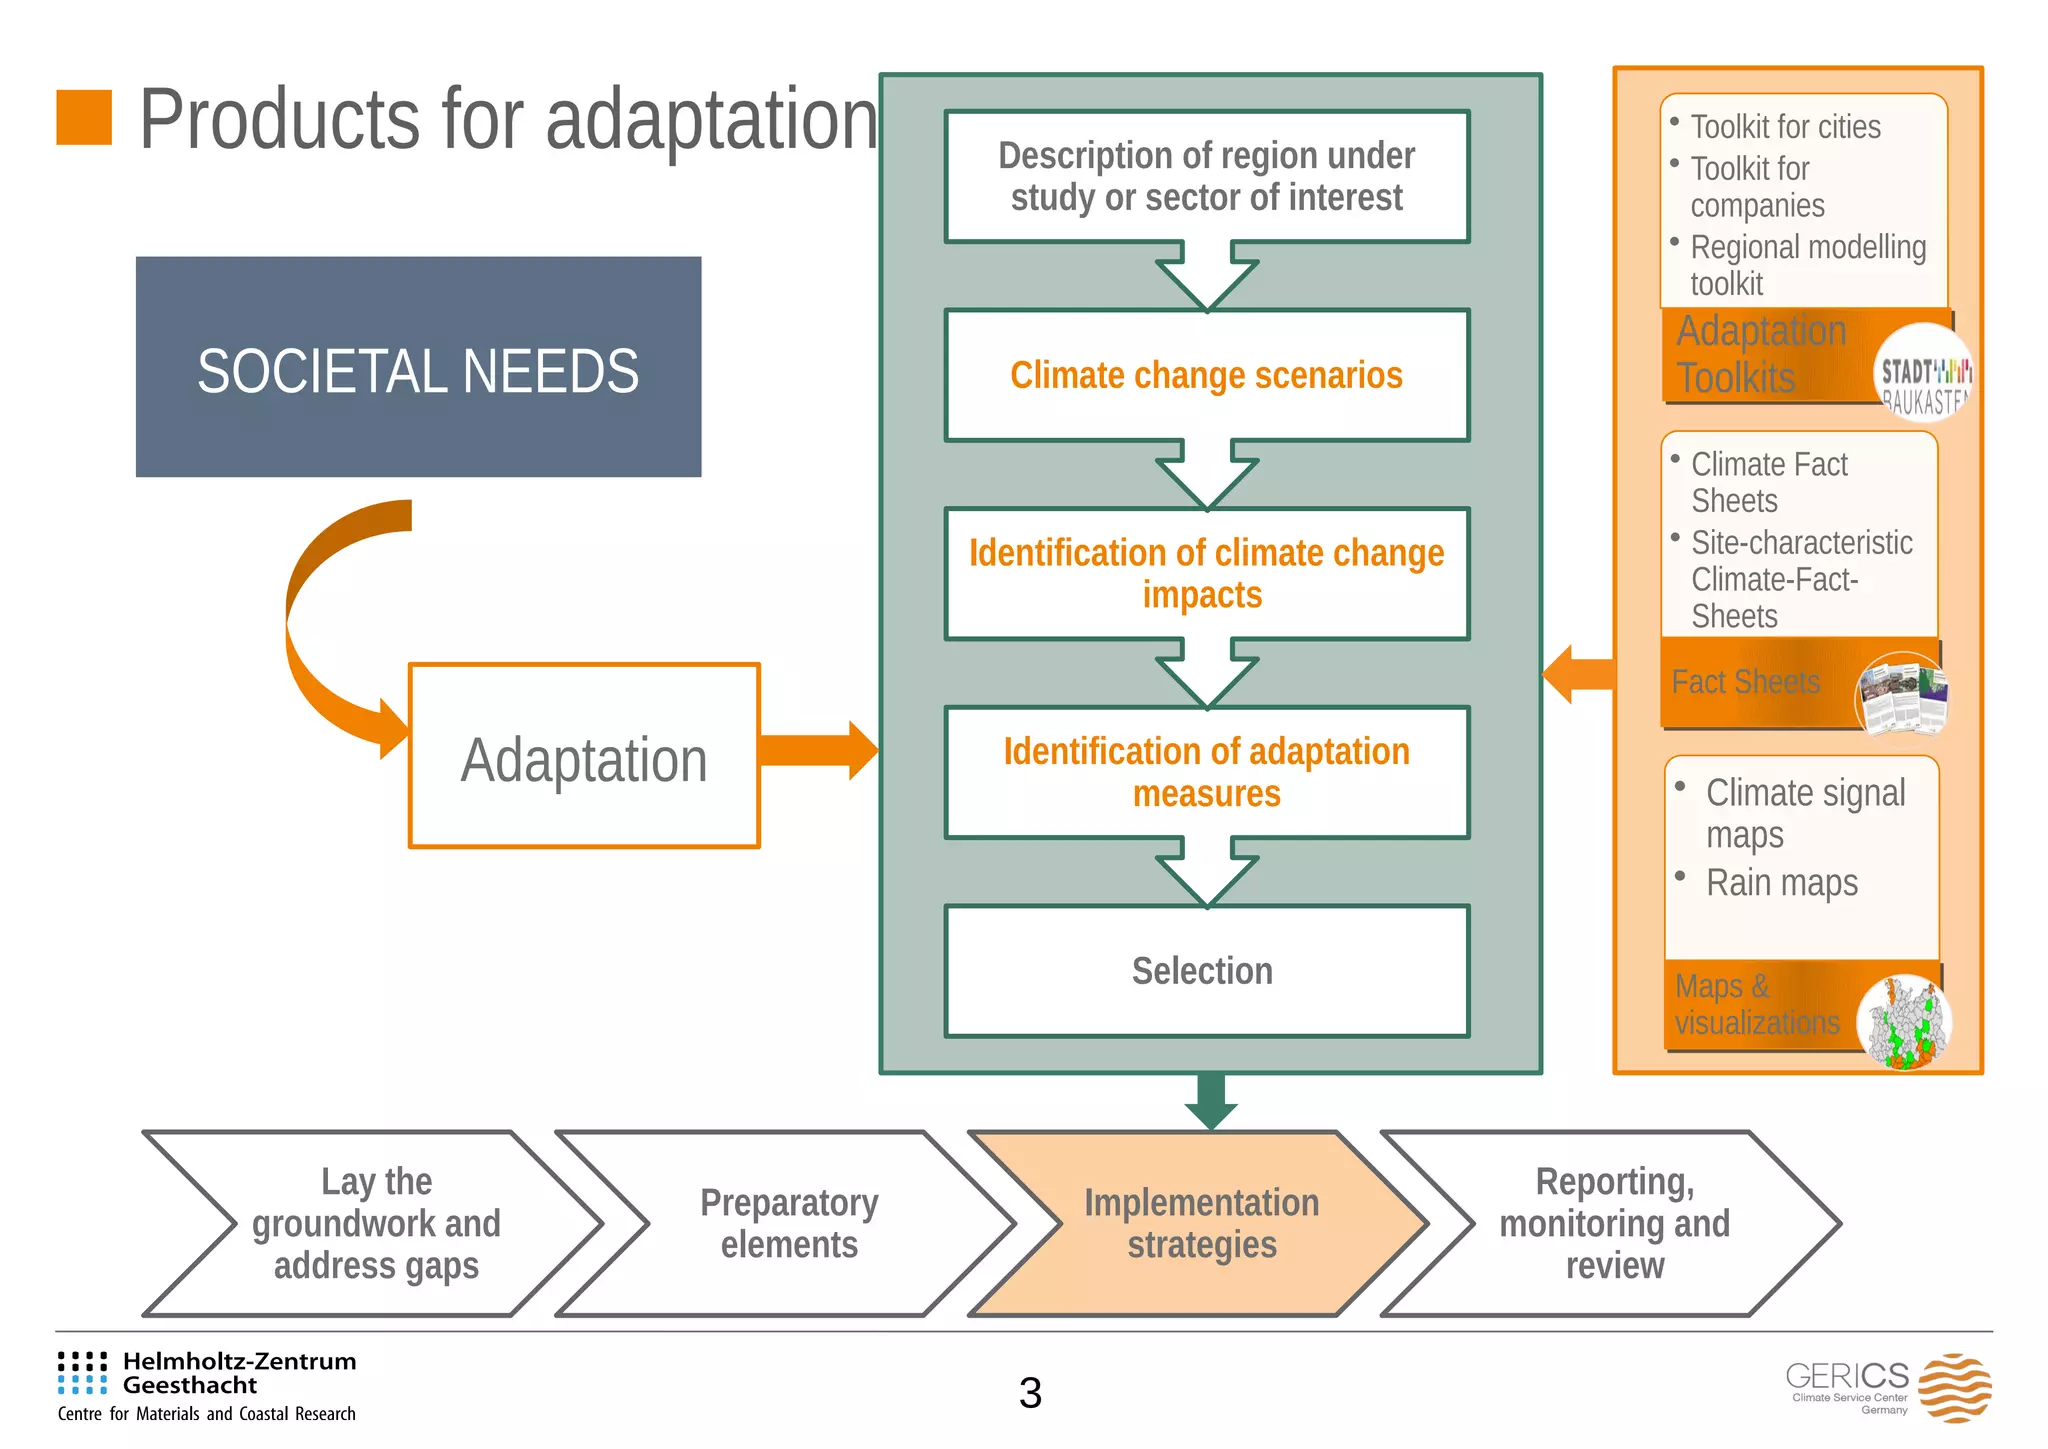
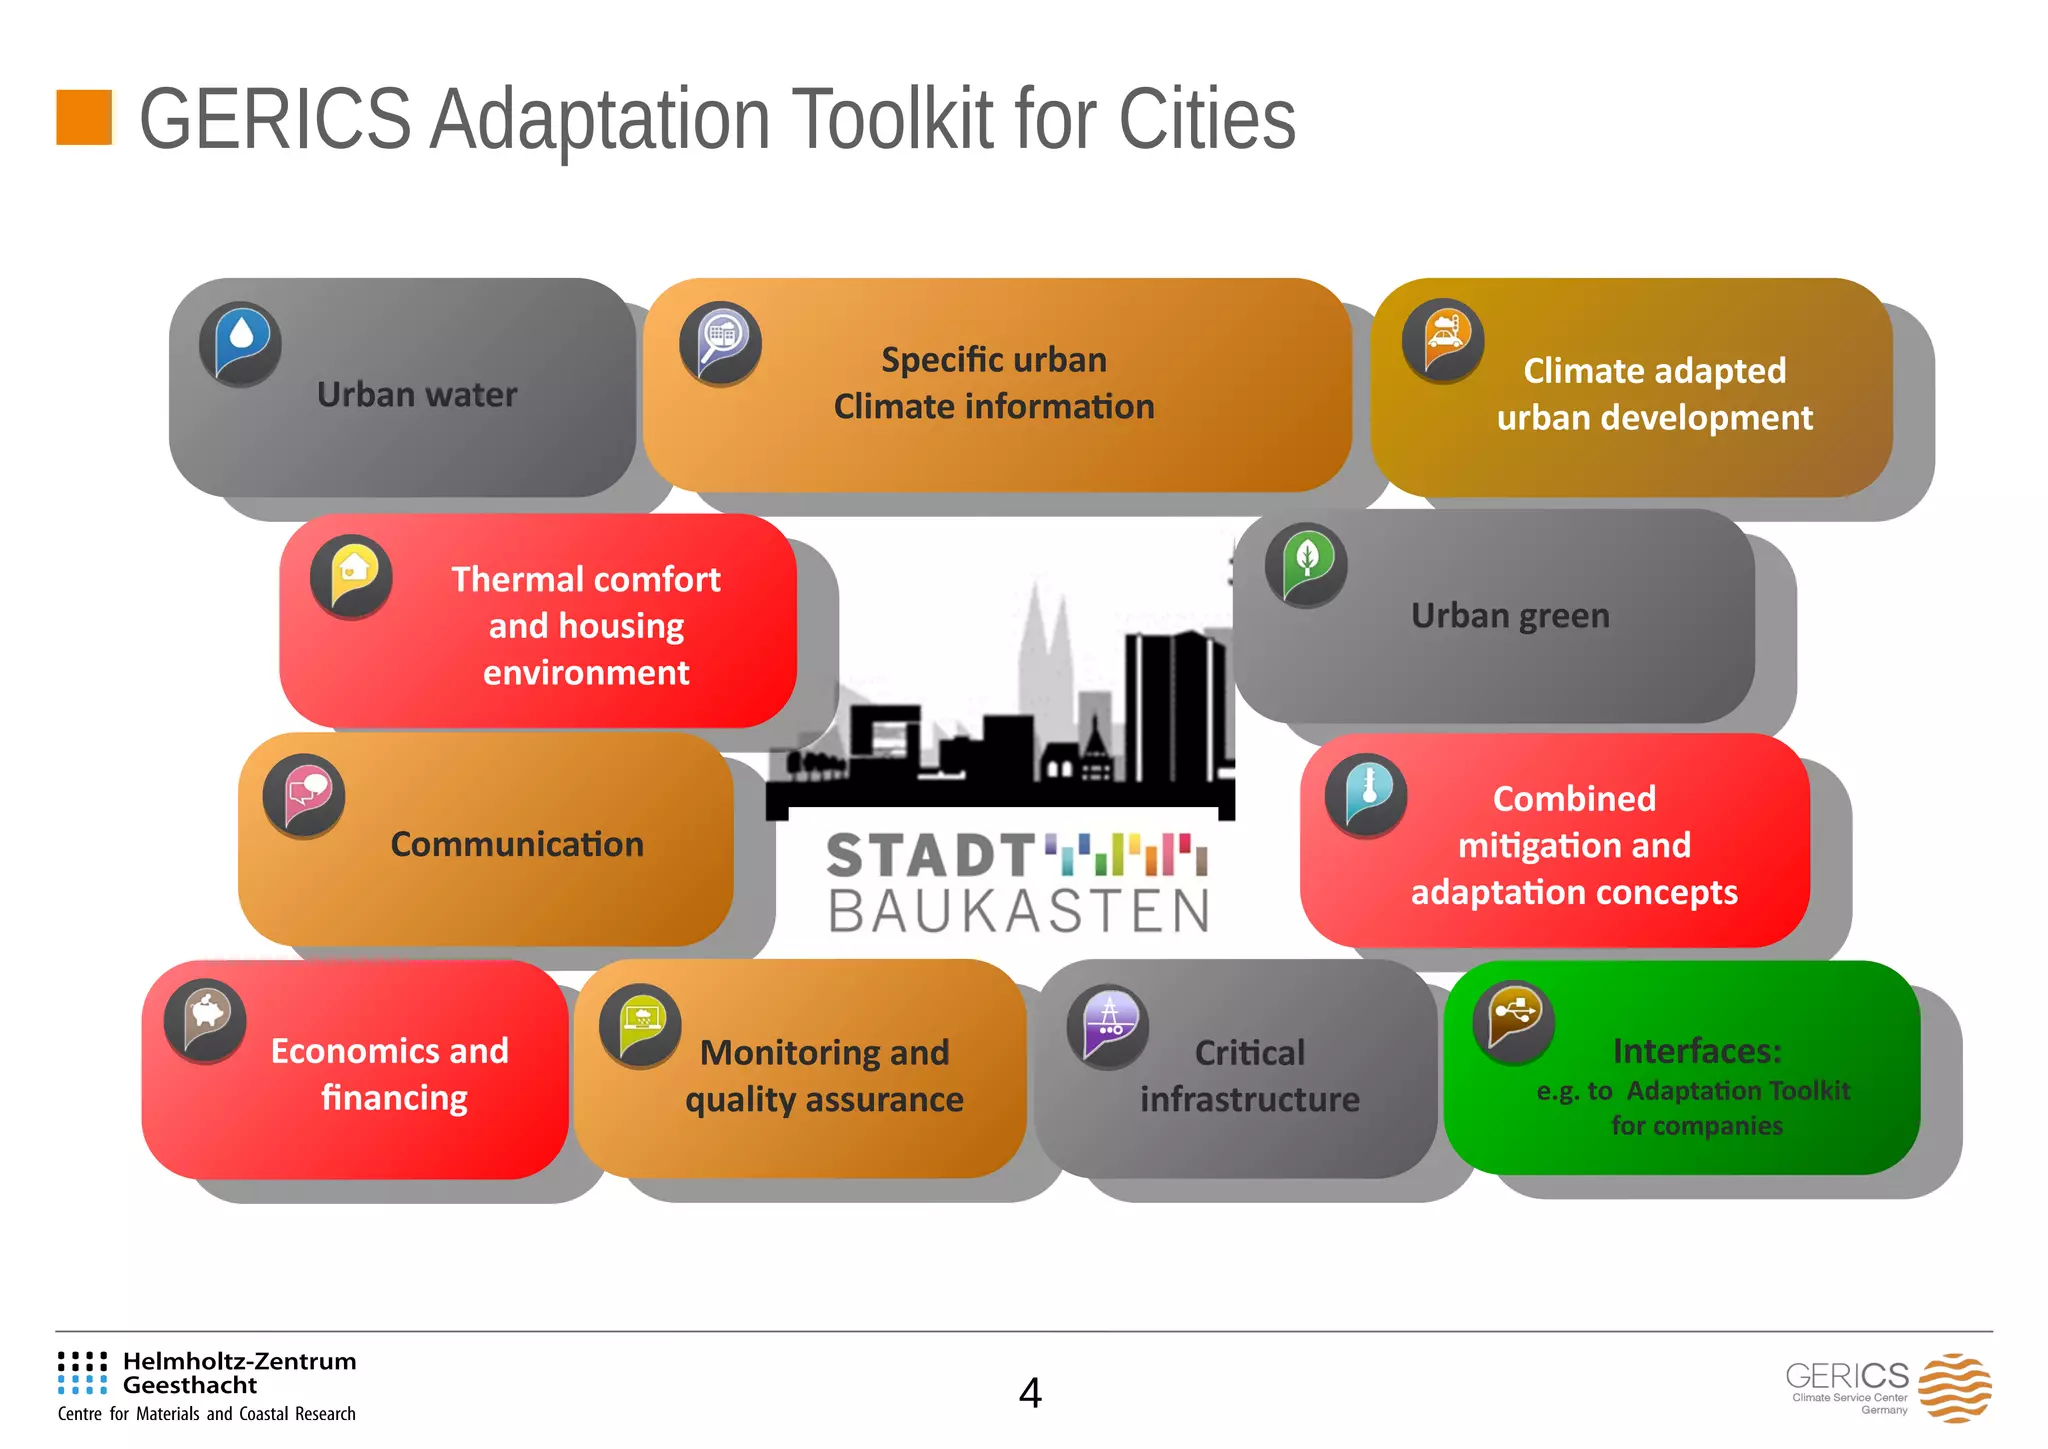
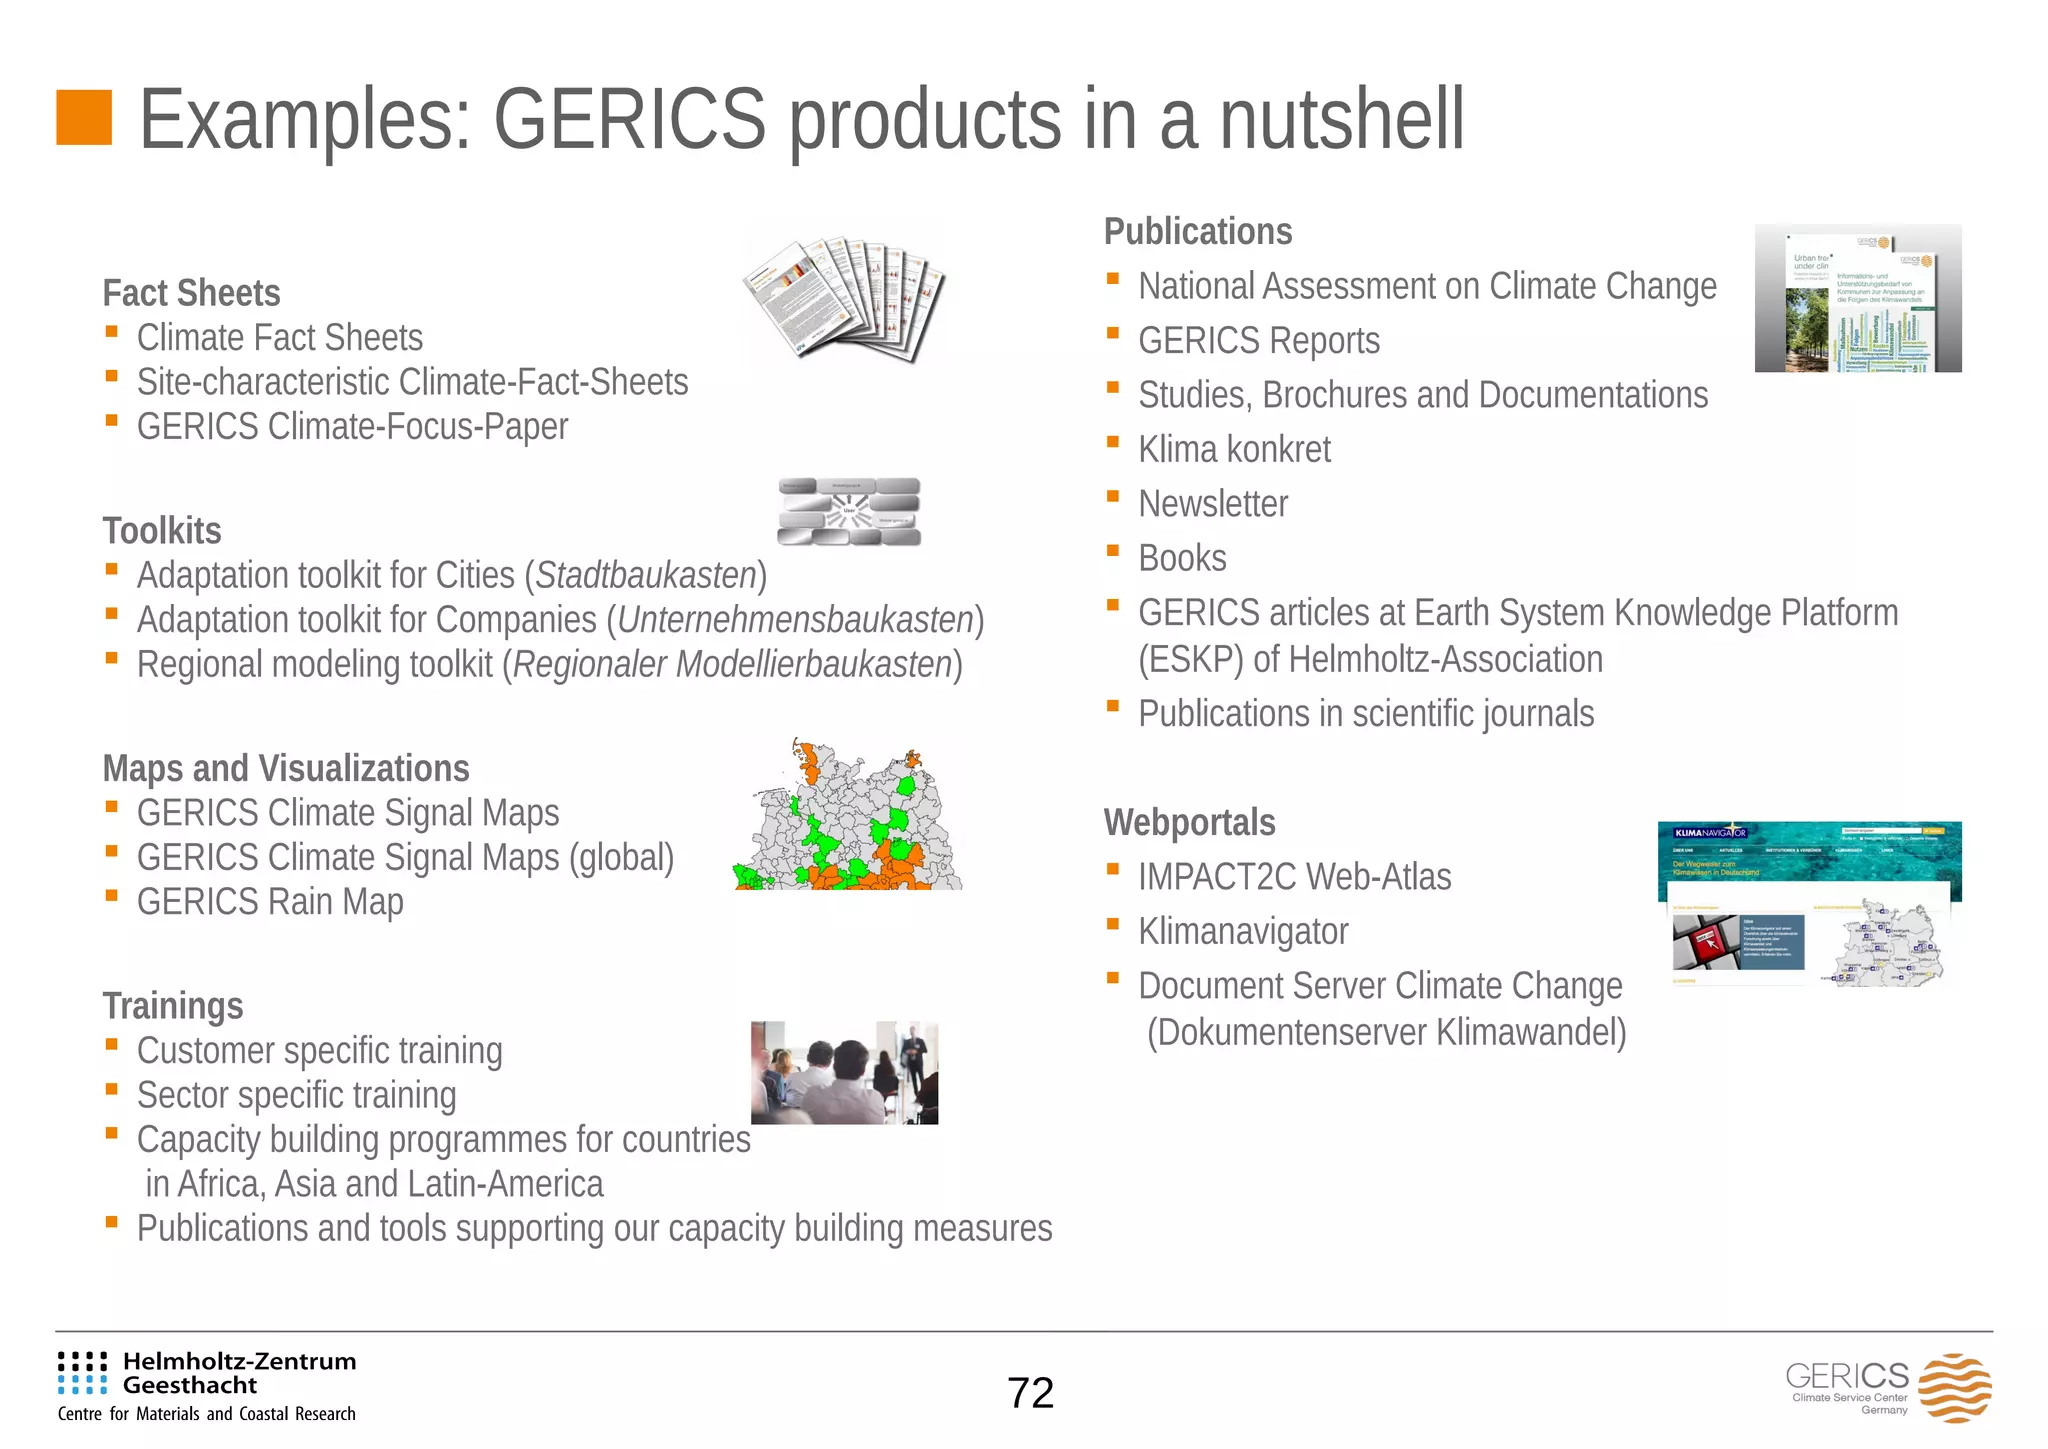
- The development of adaptation toolkits for cities, companies, and other sectors to facilitate climate risk assessment and planning.
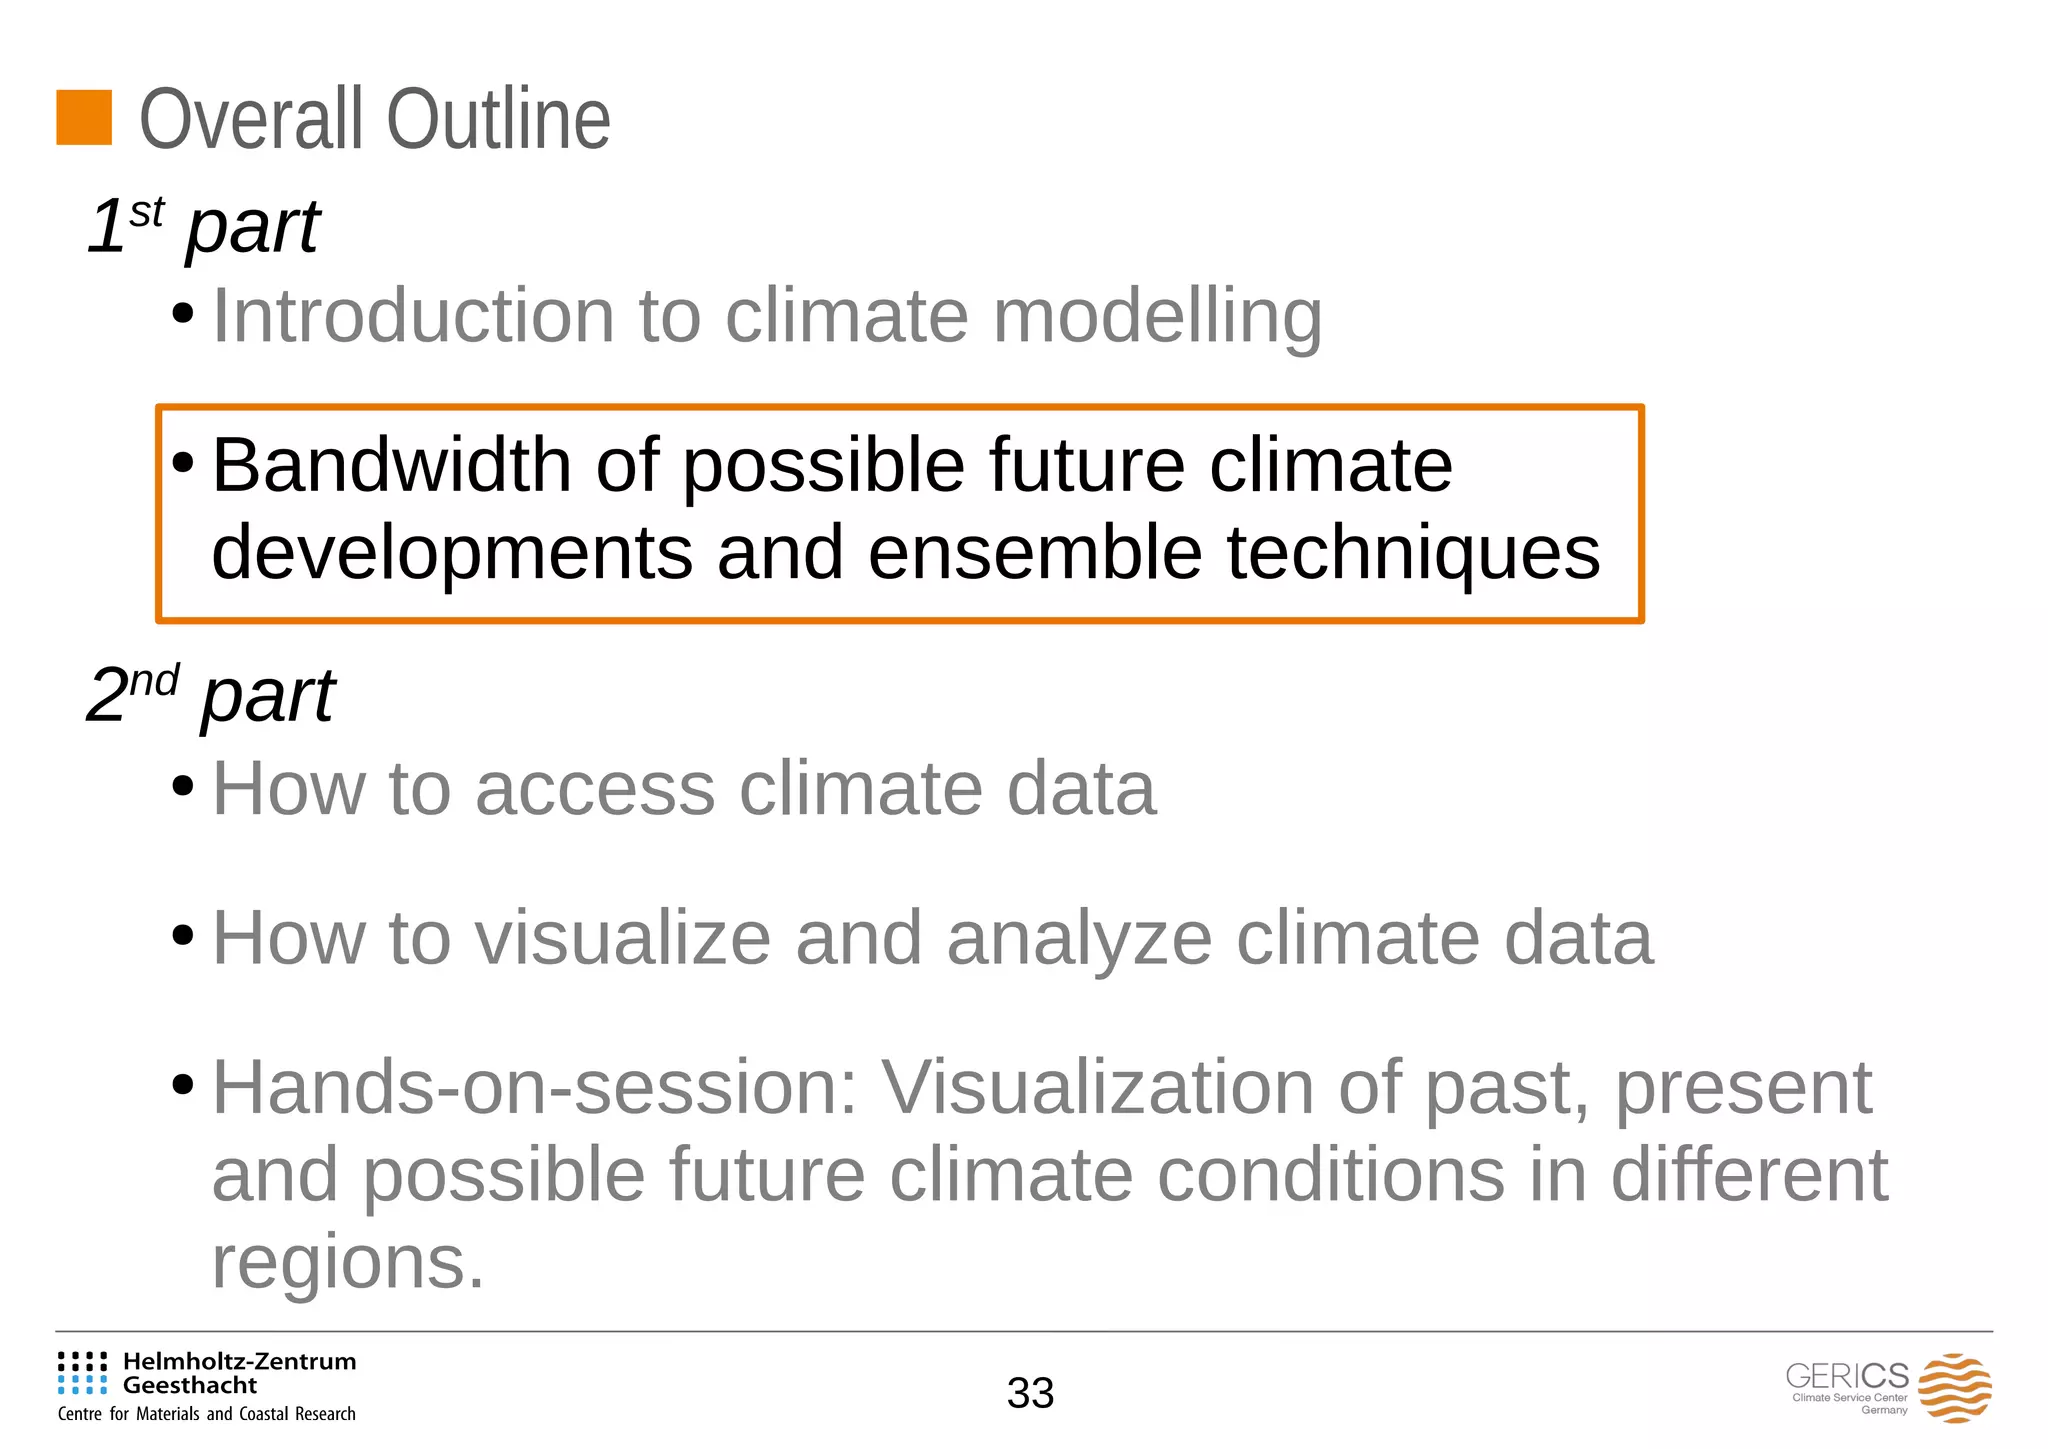
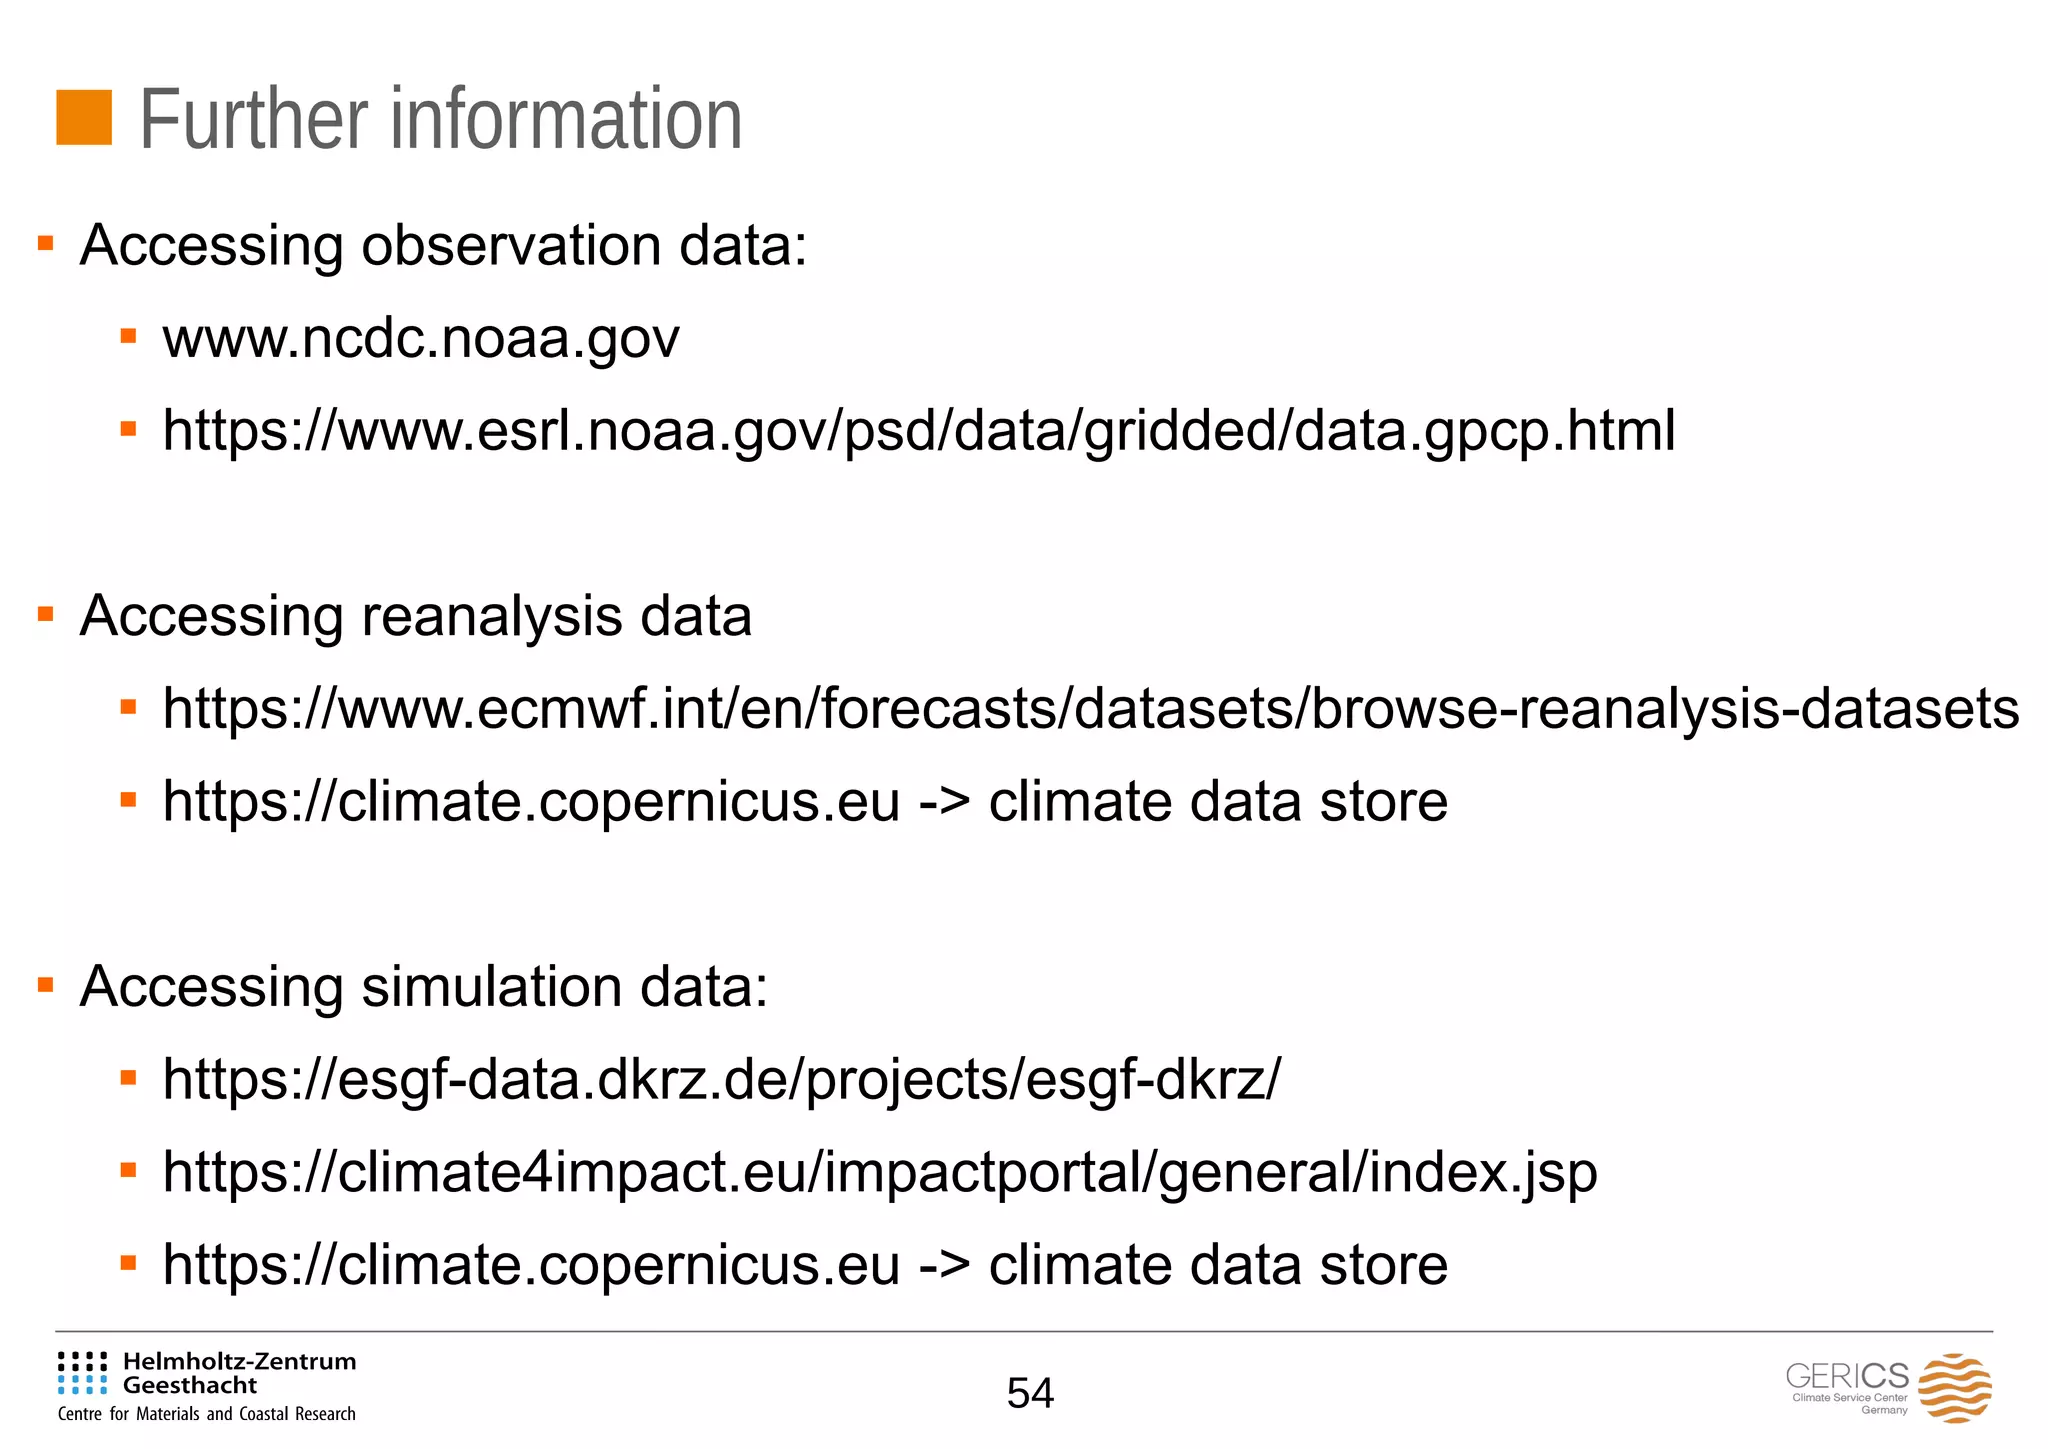
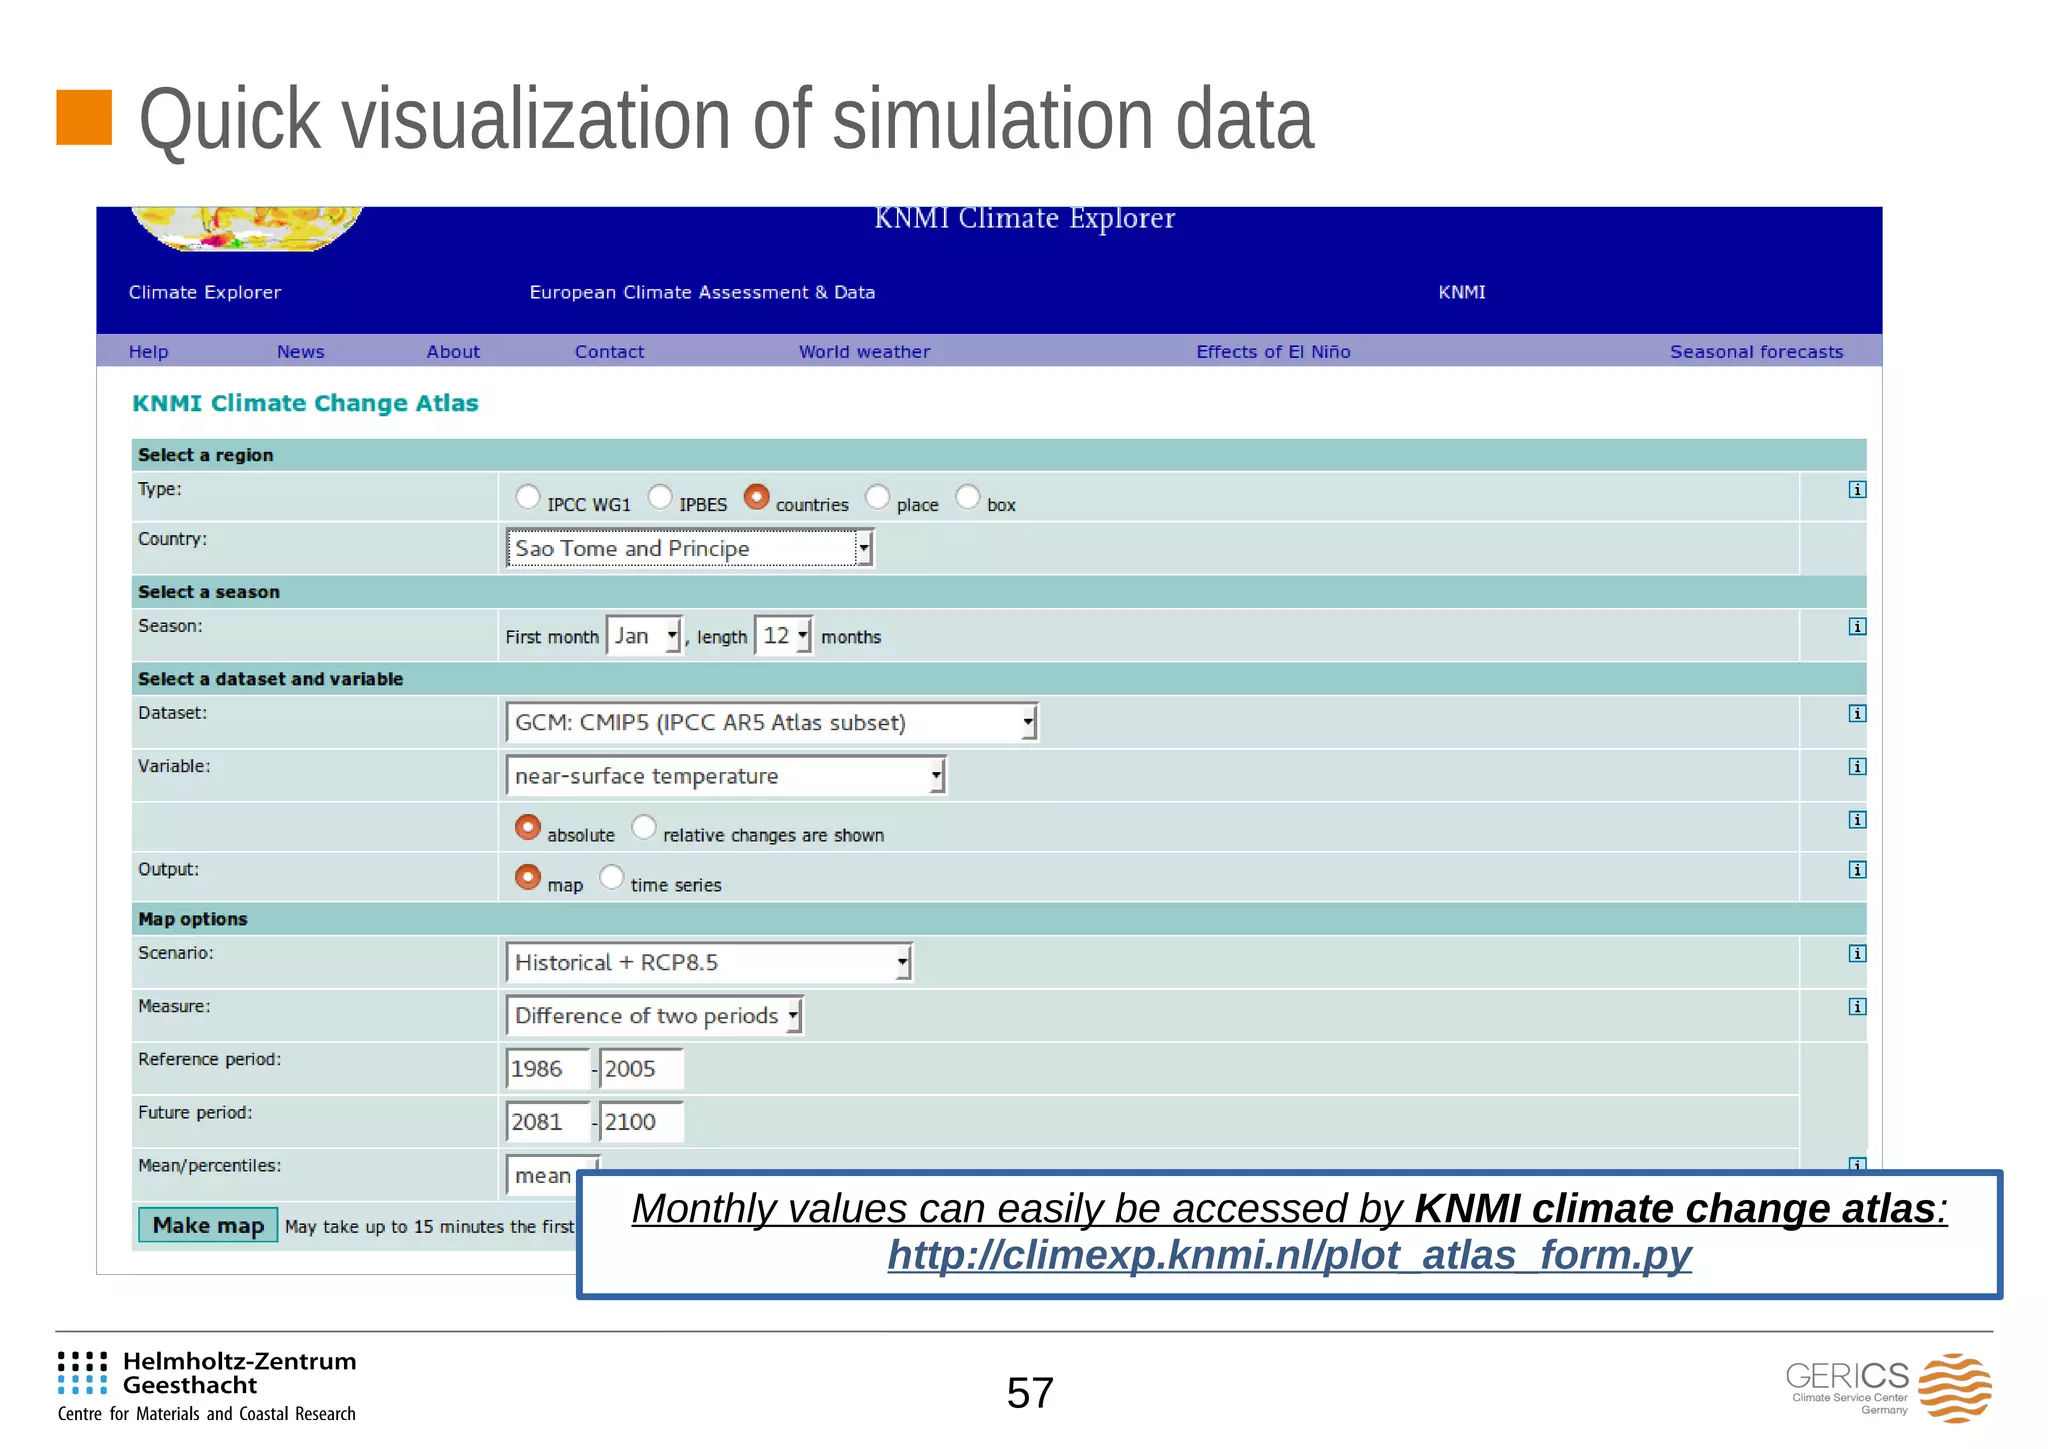
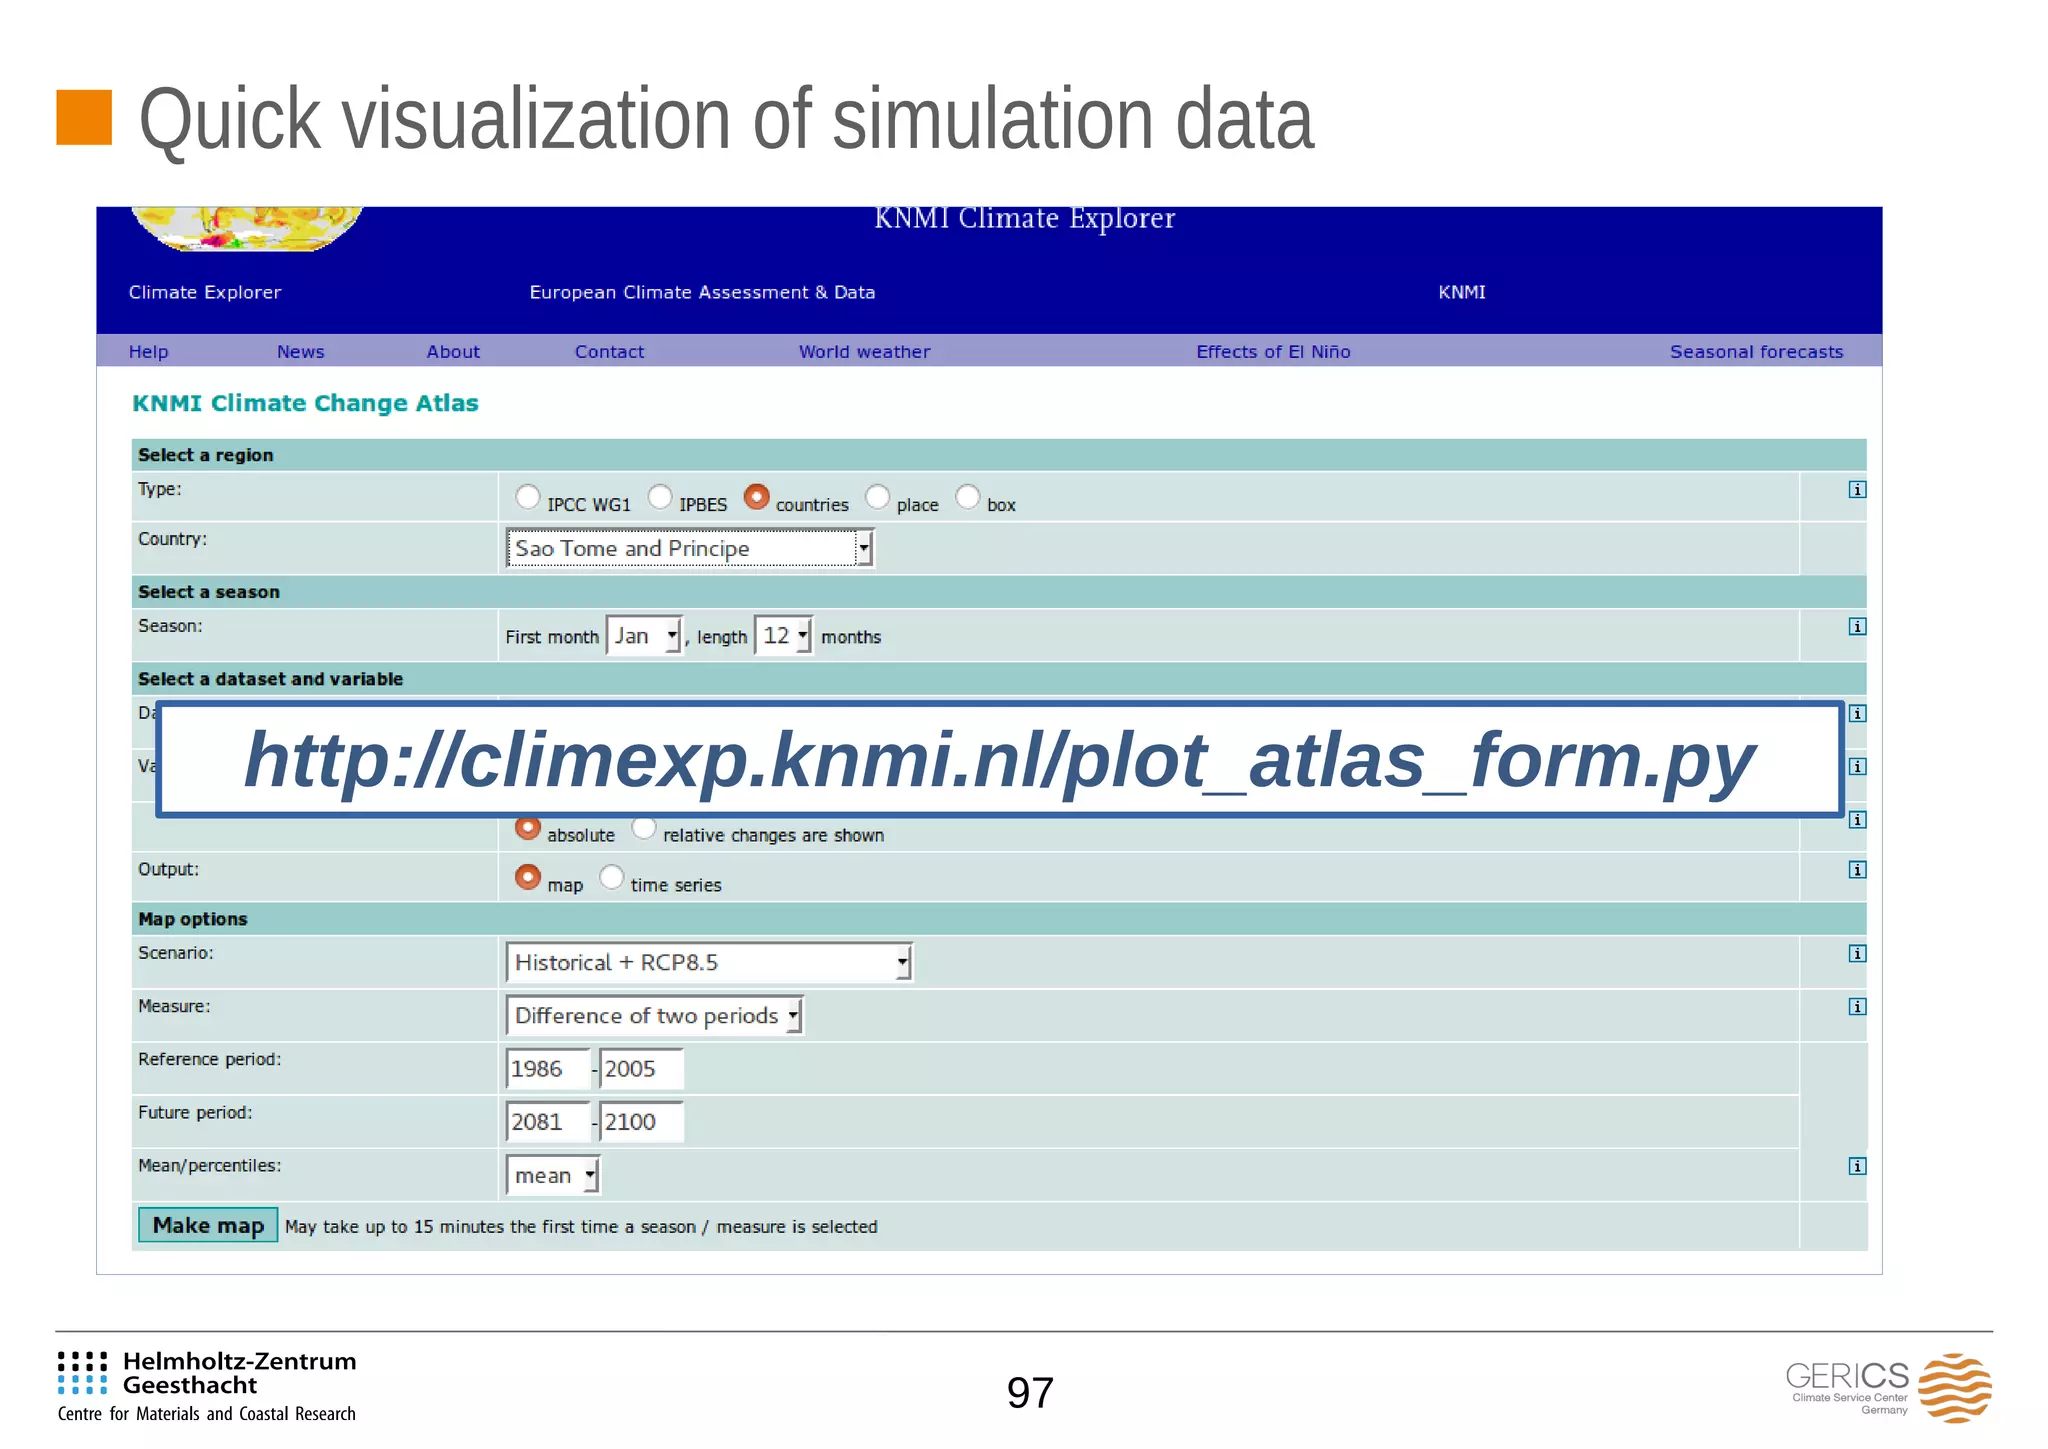
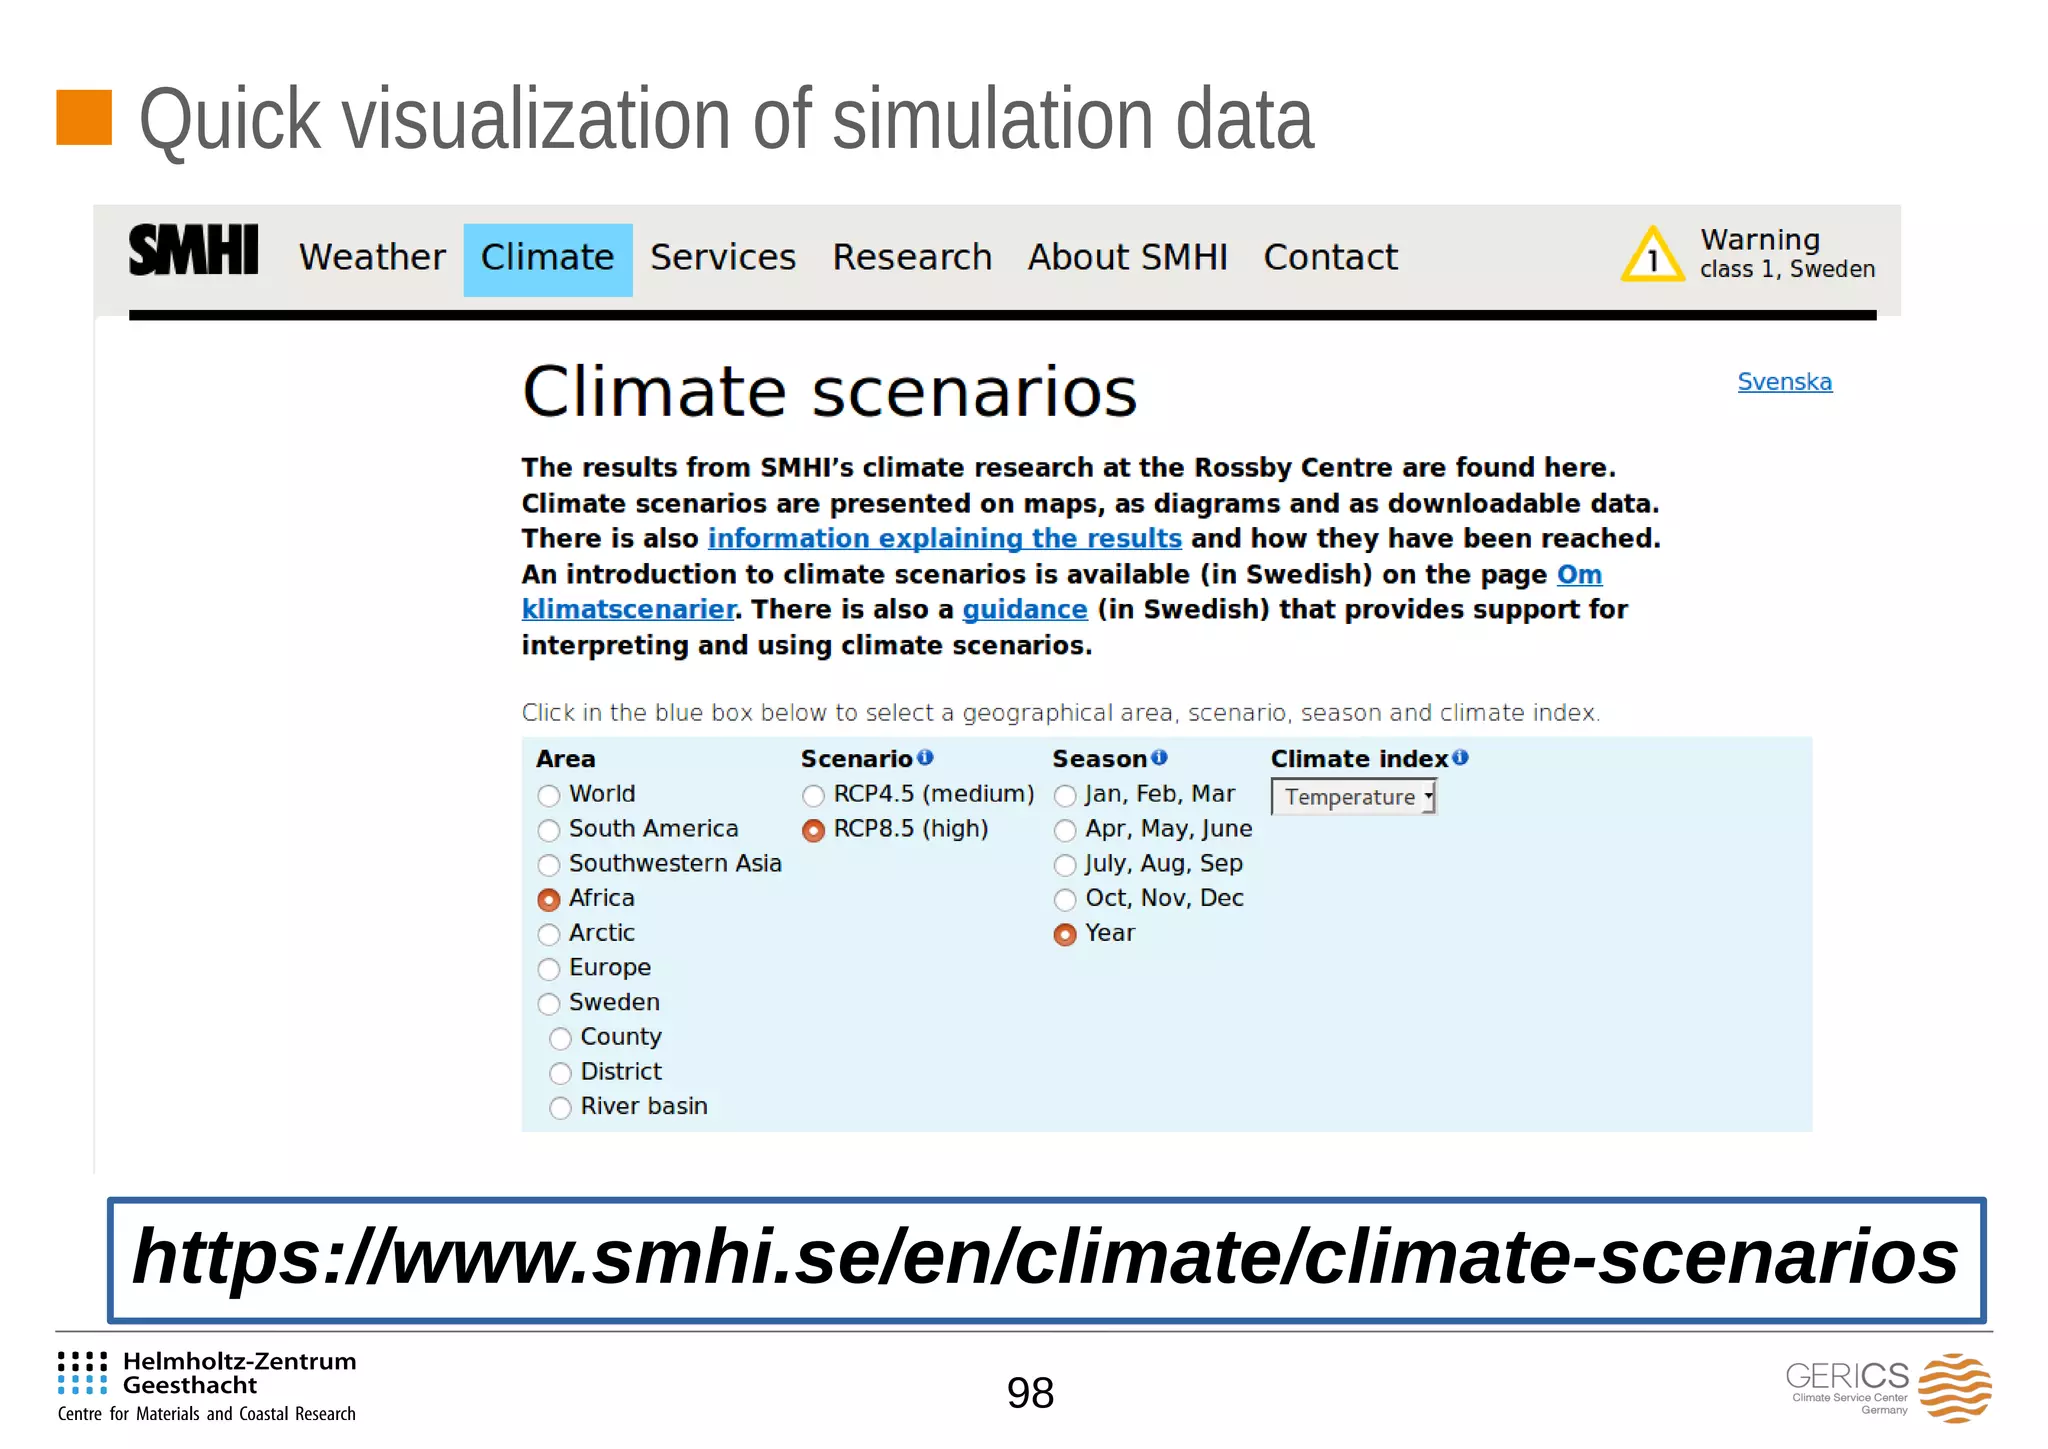
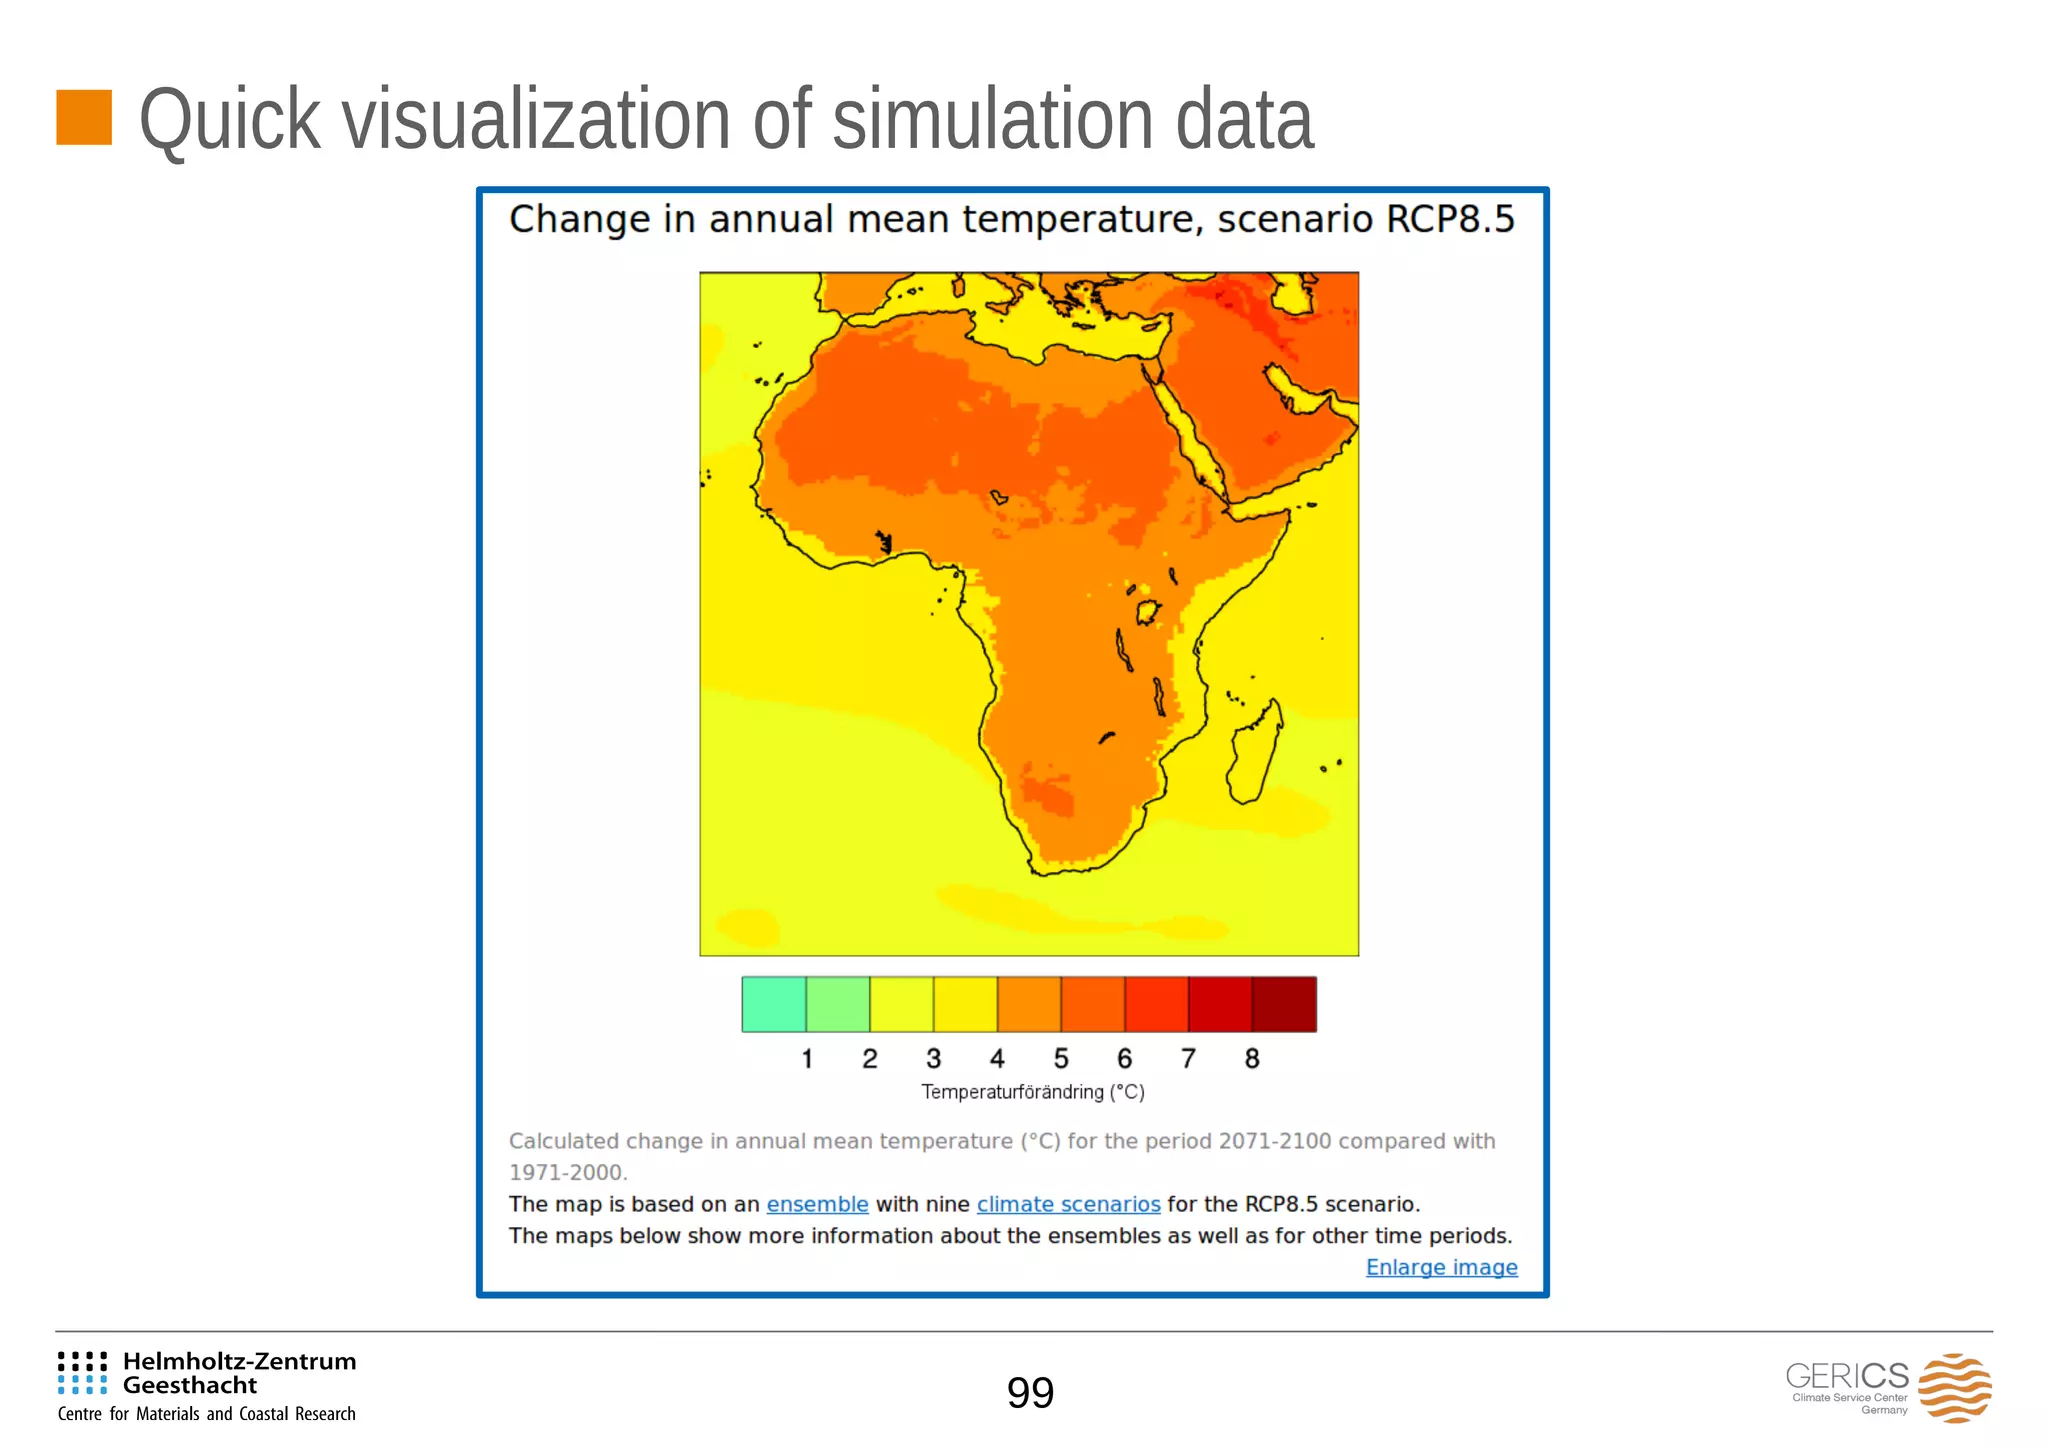
- An overview of the presentation, covering topics like climate modeling techniques, accessing climate projections data, and visualizing and analyzing climate information.
To aid in understanding many complex interactions, scientists often build mathematical models that represent simple climate systems. This module highlights the fundamentals of climate models.
This is the 7th lesson the course - Climate Change & Global Environment taught at the Faculty of Social Sciences and Humanities of the Rajarata University of Sri Lanka
Presentation from the Kick-off Meeting "Seasonal to Decadal Forecast towards Climate Services: Joint Kickoff Meetings" for ECOMS, EUPORIAS, NACLIM and SPECS FP7 projects.
drought monitoring and management using remote sensingveerendra manduri
Monitoring drought and its management became easier with the help of remote sensing..several drought monitoring indices can be used to monitor drought condition. this ppt consists of information regarding droughts in relation to agriculture and their monitoring with the help of remotely sense based indices.
Theme 4 - Climate Change Mitigation and AdaptationCIFOR-ICRAF
This presentation by Christopher Martius, Henry Neufeldt, Glenn Hyman and Laura Snook focuses on the objectives and structure of the climate change adaptation and mitigation program of the FTA Research Program, their evolution over time, the major accomplishments and the main obstacles and challenges.
Climate science part 3 - climate models and predicted climate changeLPE Learning Center
Many lines of evidence, from ice cores to marine deposits, indicate that Earth’s temperature, sea level, and distribution of plant and animal species have varied substantially throughout history. Ice cores from Antarctica suggest that over the past 400,000 years global temperature has varied as much as 10 degrees Celsius through ice ages and periods warmer than today. Before human influence, natural factors (such as the pattern of earth’s orbit and changes in ocean currents) are believed to be responsible for climate changes. For more, visit: http://www.extension.org/69150
Climate Extreme (extreme weather or climate event) refers to the occurrence of a value of a weather or climate variable above (or below) a threshold value near the upper (or lower) ends of the range of observed values of the variable. Extreme weather and climate events, interacting with exposed and vulnerable human and natural systems, can lead to disasters.
Climate data can provide a great deal of information about the atmospheric environment that impacts almost all aspects of human endeavour. This module explains the importance of climate data, its storage, security, applications and other aspects, in a nutshell.
Glaciers are the moving masses of ice. They are the permanent masses of ice that form over the land. These glaciers are originated from the compaction and crystallization of snow. When low temperature and sufficient snowfalls occur over a region we get the glaciers and snow fields will be having very low temperature and continuous snowfalls, glaciers are masses of ice that flow under the action of gravity. Glacier is a natural moving body of crystalline ice of great dimension. A glacier is a typical geological agent and as ice flows over the mountains and regions or land plain lands glaciers can erode, transport and deposit the materials carried away by suspension.
El 29 de febrero y el 1 de marzo de 2016, la Fundación Ramón Areces analizó la relación entre 'Big Data y el cambio climático' en unas jornadas. ¿Puede el Big Data ayudar a reducir el cambio climático? ¿Cómo contribuirá ese análisis masivo de datos a prevenir y gestionar catástrofes naturales? Son solo algunas de las preguntas a las que intentarán responder los ponentes. Las ciencias vinculadas al clima tienen en el Big Data una herramienta muy prometedora para afrontar diferentes fenómenos asociados al cambio climático.
We present a Northern European case study from the recent SETAC Pellston workshop on integration of global climate change (GCC) modeling into ecological risk assessment. In Northern Europe, global climate change (GCC) is expected to result in increased temperature and precipitation. The changes in weather patterns are expected to increase the occurrence of crop pests such as weeds, fungal disease and insect pests. Increased pest pressures can in turn be expected to then alter agricultural practices such as the frequency and combination of pesticide applications. Additionally, climate change may potentially have more direct effects on the environmental exposures in the transport, fate and degradation of pesticides.
A Bayesian network (BN) has previously been developed as a meta-model for incorporating future climate projections and pesticide application scenarios with information from toxic effects data to support environmental risk assessment for streams in agricultural areas. This BN model was initially parameterized for a Norwegian case study with predicted environmental concentrations from a processed-based pesticide exposure model and species sensitivity distributions derived from toxicity tests data.
Within the Pellston workshop, we aimed to improve the existing BN model by incorporating more recent and realistic climate change scenarios, a higher number of climate models, and better methods for regional downscaling. An exposure prediction model was run with alternative climate model that accounted for specific environmental factors linked to the study area, chemical properties of the pesticides, and more realistic pesticide application scenarios. Our experiences from this case study will aid efforts to better account for uncertainty related to climate change in exposure modeling, effect assessment, and risk characterization. The graphical display of the BN model approach can also aid communication of risk under climate change scenarios to stakeholders such as policy makers and regulators.
The views expressed in this presentation are those of the authors and do not necessarily represent the views or policies of the U.S. Environmental Protection Agency.
International Journal of Engineering Research and Applications (IJERA) is an open access online peer reviewed international journal that publishes research and review articles in the fields of Computer Science, Neural Networks, Electrical Engineering, Software Engineering, Information Technology, Mechanical Engineering, Chemical Engineering, Plastic Engineering, Food Technology, Textile Engineering, Nano Technology & science, Power Electronics, Electronics & Communication Engineering, Computational mathematics, Image processing, Civil Engineering, Structural Engineering, Environmental Engineering, VLSI Testing & Low Power VLSI Design etc.
P. Mercogliano, 30 Novembre - 1 Dicembre 2021 -
Webinar: I cambiamenti climatici: sfide ed aspetti evolutivi dei sistemi statistici
Titolo: Assessing climate change with climate models: gaps and perspectives
Climate change is projected to impact drastically in southern African during the 21st century
under low mitigation futures (Niang et al., 2014). African temperatures are projected to rise
rapidly, in the subtropics at least at 1.5 times the global rate of temperature increase (James
and Washington, 2013; Engelbrecht et al., 2015). Moreover, the southern African region is
projected to become generally drier under enhanced anthropogenic forcing (Christensen et
al., 2007; Engelbrecht et al., 2009; James and Washington, 2013; Niang et al., 2014). These
changes in temperature and rainfall patterns will plausibly have a range of impacts in South
Africa, including impacts on energy demand (in terms of achieving human comfort within
buildings and factories), agriculture (e.g. reductions of yield in the maize crop under higher
temperatures and reduced soil moisture), livestock production (e.g. higher cattle mortality as
a result of oppressive temperatures) and water security (through reduced rainfall and
enhanced evapotranspiration) (Engelbrecht et al., 2015).
Big Data and the Climate/Environment domain (vis-a-vis the respective H2020 Societal Challenge) - Opportunities, Challenges and Requirements. As presented and discussed in the public launch of the BigDataEurope project.
What is the point of small housing associations.pptxPaul Smith
Given the small scale of housing associations and their relative high cost per home what is the point of them and how do we justify their continued existance
A process server is a authorized person for delivering legal documents, such as summons, complaints, subpoenas, and other court papers, to peoples involved in legal proceedings.
Russian anarchist and anti-war movement in the third year of full-scale warAntti Rautiainen
Anarchist group ANA Regensburg hosted my online-presentation on 16th of May 2024, in which I discussed tactics of anti-war activism in Russia, and reasons why the anti-war movement has not been able to make an impact to change the course of events yet. Cases of anarchists repressed for anti-war activities are presented, as well as strategies of support for political prisoners, and modest successes in supporting their struggles.
Thumbnail picture is by MediaZona, you may read their report on anti-war arson attacks in Russia here: https://en.zona.media/article/2022/10/13/burn-map
Links:
Autonomous Action
http://Avtonom.org
Anarchist Black Cross Moscow
http://Avtonom.org/abc
Solidarity Zone
https://t.me/solidarity_zone
Memorial
https://memopzk.org/, https://t.me/pzk_memorial
OVD-Info
https://en.ovdinfo.org/antiwar-ovd-info-guide
RosUznik
https://rosuznik.org/
Uznik Online
http://uznikonline.tilda.ws/
Russian Reader
https://therussianreader.com/
ABC Irkutsk
https://abc38.noblogs.org/
Send mail to prisoners from abroad:
http://Prisonmail.online
YouTube: https://youtu.be/c5nSOdU48O8
Spotify: https://podcasters.spotify.com/pod/show/libertarianlifecoach/episodes/Russian-anarchist-and-anti-war-movement-in-the-third-year-of-full-scale-war-e2k8ai4
Presentation by Jared Jageler, David Adler, Noelia Duchovny, and Evan Herrnstadt, analysts in CBO’s Microeconomic Studies and Health Analysis Divisions, at the Association of Environmental and Resource Economists Summer Conference.
Understanding the Challenges of Street ChildrenSERUDS INDIA
By raising awareness, providing support, advocating for change, and offering assistance to children in need, individuals can play a crucial role in improving the lives of street children and helping them realize their full potential
Donate Us
https://serudsindia.org/how-individuals-can-support-street-children-in-india/
#donatefororphan, #donateforhomelesschildren, #childeducation, #ngochildeducation, #donateforeducation, #donationforchildeducation, #sponsorforpoorchild, #sponsororphanage #sponsororphanchild, #donation, #education, #charity, #educationforchild, #seruds, #kurnool, #joyhome
Up the Ratios Bylaws - a Comprehensive Process of Our Organizationuptheratios
Up the Ratios is a non-profit organization dedicated to bridging the gap in STEM education for underprivileged students by providing free, high-quality learning opportunities in robotics and other STEM fields. Our mission is to empower the next generation of innovators, thinkers, and problem-solvers by offering a range of educational programs that foster curiosity, creativity, and critical thinking.
At Up the Ratios, we believe that every student, regardless of their socio-economic background, should have access to the tools and knowledge needed to succeed in today's technology-driven world. To achieve this, we host a variety of free classes, workshops, summer camps, and live lectures tailored to students from underserved communities. Our programs are designed to be engaging and hands-on, allowing students to explore the exciting world of robotics and STEM through practical, real-world applications.
Our free classes cover fundamental concepts in robotics, coding, and engineering, providing students with a strong foundation in these critical areas. Through our interactive workshops, students can dive deeper into specific topics, working on projects that challenge them to apply what they've learned and think creatively. Our summer camps offer an immersive experience where students can collaborate on larger projects, develop their teamwork skills, and gain confidence in their abilities.
In addition to our local programs, Up the Ratios is committed to making a global impact. We take donations of new and gently used robotics parts, which we then distribute to students and educational institutions in other countries. These donations help ensure that young learners worldwide have the resources they need to explore and excel in STEM fields. By supporting education in this way, we aim to nurture a global community of future leaders and innovators.
Our live lectures feature guest speakers from various STEM disciplines, including engineers, scientists, and industry professionals who share their knowledge and experiences with our students. These lectures provide valuable insights into potential career paths and inspire students to pursue their passions in STEM.
Up the Ratios relies on the generosity of donors and volunteers to continue our work. Contributions of time, expertise, and financial support are crucial to sustaining our programs and expanding our reach. Whether you're an individual passionate about education, a professional in the STEM field, or a company looking to give back to the community, there are many ways to get involved and make a difference.
We are proud of the positive impact we've had on the lives of countless students, many of whom have gone on to pursue higher education and careers in STEM. By providing these young minds with the tools and opportunities they need to succeed, we are not only changing their futures but also contributing to the advancement of technology and innovation on a broader scale.
Jennifer Schaus and Associates hosts a complimentary webinar series on The FAR in 2024. Join the webinars on Wednesdays and Fridays at noon, eastern.
Recordings are on YouTube and the company website.
https://www.youtube.com/@jenniferschaus/videos
ZGB - The Role of Generative AI in Government transformation.pdfSaeed Al Dhaheri
This keynote was presented during the the 7th edition of the UAE Hackathon 2024. It highlights the role of AI and Generative AI in addressing government transformation to achieve zero government bureaucracy
ZGB - The Role of Generative AI in Government transformation.pdf
3.3 Climate data and projections
1. Titelmasterformat bearbeiten
Parallel Session 3.3:
Climate data and projections with a
focus on <2°C (GERICS)
Claas Teichmann
and the GERICS team
NAP Expo 2019
8-12 April 2019, Songdo, South Korea
2. 2
We develop innovative, cutting-edge solutions
regional climate modelling
regional system modelling
climate change impacts
economics and politics
transdisciplinary processes
prototype product development
inter- and transdisciplinary approaches
application of climate service
infrastructure
evaluation of climate services
climate-fact-sheets and focus papers
maps and visualisations
modular toolkits
training concepts
books, reports and studies
strategic partnerships and associates
creating and facilitating networks
hosting secretariats
operationalising climate services
continuous user interaction
Interlinking Science and Society
3. 3
• Toolkit for cities
• Toolkit for
companies
• Regional modelling
toolkit
Adaptation
Toolkits
Adaptation
ToolkitsSOCIETAL NEEDS
Adaptation • Climate signal
maps
• Rain maps
Maps &
visualizations
Maps &
visualizations
• Climate Fact
Sheets
• Site-characteristic
Climate-Fact-
Sheets
• Climate-Focus-
PapersFact SheetsFact Sheets
Selection
Identification of adaptation
measures
Identification of climate change
impacts
Climate change scenarios
Description of region under
study or sector of interest
Lay the
groundwork and
address gaps
Preparatory
elements
Implementation
strategies
Reporting,
monitoring and
review
Products for adaptation
4. 4
Urban water
Specific urban
Climate information
Climate adapted
urban development
Thermal comfort
and housing
environment
Urban green
Communication
Combined
mitigation and
adaptation concepts
Economics and
financing
Monitoring and
quality assurance
Critical
infrastructure
Interfaces:
e.g. to Adaptation Toolkit
for companies
GERICS Adaptation Toolkit for Cities
5. 5
Overall Outline
●
Introduction to climate modelling
●
Bandwidth of possible future climate
developments and ensemble techniques
●
How to access climate data
●
How to visualize climate data
●
Hands-on-session: Visualization of past, present
and possible future climate conditions in different
regions.
1st
part
2nd
part
7. 7
Overall Outline
●
Introduction to climate modelling
●
Bandwidth of possible future climate
developments and ensemble techniques
●
How to access climate data
●
How to visualize and analyze climate data
●
Hands-on-session: Visualization of past, present
and possible future climate conditions in different
regions.
1st
part
2nd
part
8. 9
Earth without atmosphere
S0
: solar constant = ~1360 W/m2
S0
4
(1− α)=σTe
4
: albedo~0.3
: Boltzman constant
-18°C
Courtesy M. Reuter
13. 14
Global Fossil CO2 Emissions
Global fossil CO2 emissions: 36.2 ± 2 GtCO2 in 2017, 63% over 1990
Projection for 2018: 37.1 ± 2 GtCO2, 2.7% higher than 2017 (range 1.8% to 3.7%)
Estimates for 2015, 2016 and 2017 are preliminary; 2018 is a projection based on partial data.
Source: CDIAC; Le Quéré et al 2018; Global Carbon Budget 2018
Uncertainty is ±5% for
one standard deviation
(IPCC “likely” range)
https://www.globalcarbonproject.org
16. 18
Twelve warmest years between 1880-2016
NOAA National Centers for Environmental information, Climate at a Glance: Global Time Series,
published October 2017, http://www.ncdc.noaa.gov/cag/
17. 19
Summer 2003: Heatwave over Europe
Quelle: Nasa Goddard Institute for Space Studies
source: Nasa Goddard Institute for Space Studies; Inst. f. Meteorologie und Klimaforschung, Univ. Karlsruhe
18. 20
Summer 2003: Heatwave over Europe
Quelle: Nasa Goddard Institute for Space Studies
source: Nasa Goddard Institute for Space Studies; Inst. f. Meteorologie und Klimaforschung, Univ. Karlsruhe
Heatwaves are regional phenomena and a vary in
time and space
20. 22
Heatwave 2003 Jun/Jul/Aug temperature in switzerland
Quelle: IPCC, 2007; Schär et al, 2004
The outstanding heatwave of 2003, might become a
standard summer at the end of the century
21. 23
Global average near surface temperatures relative to the
pre-industrial period
https://www.eea.europa.eu/data-and-maps/indicators/global-and-european-temperature-8/assessment
22. 24
Global average near surface temperatures relative to the
pre-industrial period
https://www.eea.europa.eu/data-and-maps/indicators/global-and-european-temperature-8/assessment
Will the increase in global average temperature stay
below 2 °C above pre-industrial levels?
23. 25
Greenhouse effect
Development
depends on the
understanding of
the physical
processes of the
climate system
and the availability
of observation
data
Utilization
depends on the
relevance of the
processes for the
cliamate system
And on the
purpose of the
model
experiment
Source:
IPCC 2007 AR4
24. 26
Climate models
Source: IPCC 2007
Differential equations describing dynamics and physics in the climate system:
discretized on a 3-D grid, time dependent numerical solutions (Courant–Friedrichs–Lewy (CFL)
condition necessary condition for stability)
and physical parameterisations for subscale processes
Source: IPCC 2007
vertical: e.g. 90 atmospheric levels
horizontal: e.g. 200 x 400 cubes
time step: e.g. 20 minutes
e.g. 10 3D, 130 2D climate variables
integration for centuries ...
25. 27
Are the models able to reproduce observed trends?
http://www.ipcc.ch
26. 28
Dynamical Downscaling
Modelling all relevant physical processes in a 3-D region using an intern
timestep of 2min to 12sec
Regional models
e.g. REMOx: 50 km to 2.5 km
Global models
e.g. ECHAM x(0°): 400 km to 50 km
Source: based on DKRZ
RCM model
domain
large scale
forcing
27. 29
Climate simulations: towards very high resolution
~150 km gridbox length
~12 km gridbox length
~3 km gridbox length
Global Climate Models
Regional Climate Models
Regional Climate Models at
convection resolving resolution
Instantaneous Near-Surface Temperature at
different model resolutions
Example: Hamburg Metropolitan Region
28. 30
Benefits of high resolution climate simulations
More realistic
monsoon
precipitation
in RCM simulations
mean of 3 RCMs driven by 2 GCMs
(1970-1999)
Monsoon precipitation JJAS
m
RCM ~25KmObs ~ 55KmGCM ~200Km
mm/dayPankaj Kumar, High Noon Project, MPI-M
Orography
~300 km
to
~25 km
31. 33
Overall Outline
●
Introduction to climate modelling
●
Bandwidth of possible future climate
developments and ensemble techniques
●
How to access climate data
●
How to visualize and analyze climate data
●
Hands-on-session: Visualization of past, present
and possible future climate conditions in different
regions.
1st
part
2nd
part
32. 34
Climate projections: main sources of spread
Internal climate variabilityInternal climate variability
Variations of climate
due to natural processes inside the climate system
Modelling uncertaintiesModelling uncertainties
Models are a simplified image of the earth climate system
Human actionHuman action
Anthropogenic emissions of radiatively active substancies to the atmosphere
Land use changes
Natural external factorsNatural external factors
Changing natural factors outside the climate system
e.g. solar variabilty, volcanic eruptions
33. 36
Climate projections: Ensemble experiments
Internal climate variabilityInternal climate variability
Initial condition ensemble
Human actionHuman action
Emission scenario ensemble
Natural external factorsNatural external factors
Prescribed or constant
Modelling uncertaintiesModelling uncertainties
Multi-model ensemble
sample both modelling uncertainties and initial conditions
ensembles of (best available) opportunities
34. 37
Emission scenarios SRES / RCPs
Figure: P. Bowyer; Data based on SRES, IIASA and Global Carbon Project
35. 38
CMIP5: Projected global temperature range
Figure created by Ed Hawkins 2014, source: http://www.climate-lab-book.ac.uk/2014/cascade-of-uncertainty/
relative to pre-industrial time period
36. 39
Overall Outline
●
Introduction to climate modelling
●
Bandwidth of possible future climate
developments and ensemble techniques
●
How to access climate data
●
How to visualize and analyze climate data
●
Hands-on-session: Visualization of past, present
and possible future climate conditions in different
regions.
1st
part
2nd
part
39. 43
Multi-model ensemble CMIP5 and CMIP3
Source: IPCC 2013 AR5 Chapter 9
MIPs Model Intercompariso Projects (since 1990):
standard experiment protocol and an world wide
community-based infrastructure in support of model
simulations, validation, intercomparison,
documentation and data access.
CMIP3: coordinated climate projections, based on
emission scenarios from SRES, global model basis
for IPCC AR4
CMIP5: a new set of coordinated, based on the new
RCPs, global model basis for IPCC AR5
40. 44
Regional climate simulations: WCRP CORDEX
14 domains with a
resolution of
0.44° x 0.44°
(approx. 50 x
50km²)
High resolution
simulations
with 0.11° x 0.11°
(approx. 12 x
12km²)
for Europe
CORDEX data available via Earth System Grid Federation: https://esgf-data.dkrz.de/search/cordex-dkrz/
CORDEX focus on Africa
GERICS participates in many CORDEX-regions
(adapted from F. Giorgi)
41. 45
CORDEX vision and goals
The CORDEX vision is to advance and coordinate the science and application of
regional climate downscaling through global partnerships.
To better understand relevant regional/local climate phenomena, their variability and
changes, through downscaling.
To evaluate and improve regional climate downscaling models and techniques
To produce coordinated sets of regional downscaled projections worldwide
To foster communication and knowledge exchange with users of regional climate information
Emerging scientific challenges
Added value
Human element
Coordination of regional coupled modelling
Precipitation
Local wind systems
CORDEX domains
(adapted from F. Giorgi)
Great parts of the information of climate
change is based on CORDEX activities
42. 47
CORDEX-CORE
Horizontal resolution: 0.22° (~25km) resolution
Forcing: re-analysis (ERA-Interim), RPC2.6 and RCP8.5 driven global
simulations
GCMs: HadGEM (backup: MIROC5), MPI-ESM (backup: EC-Earth),
NorESM (backup: GFDL-ESM)
RCMs: REMO, RegCM, (CLM)
Towards a homogeneous high-resolution simulation dataset for the world
CORDEX-CORE model domains as setup for simulations by the regional climate model REMO.
Domains from top-left to bottom right: North America, Central America, South America, EURO-CORDEX, Africa, South
Asia, East Asia, Australasia.
Orographically structured area.
43. 48
CORDEX-CORE
Horizontal resolution: 0.22° (~25km) resolution
Forcing: re-analysis (ERA-Interim), RPC2.6 and RCP8.5 driven global
simulations
GCMs: HadGEM (backup: MIROC5), MPI-ESM (backup: EC-Earth),
NorESM (backup: GFDL-ESM)
RCMs: REMO, RegCM, CLM
Towards a homogeneous high-resolution simulation dataset for the world
CORDEX-CORE model domains as setup for simulations by the regional climate model REMO.
Domains from top-left to bottom right: North America, Central America, South America, EURO-CORDEX, Africa, South
Asia, East Asia, Australasia.
Orographically structured area.
The main ideas of the CORDEX CORE framework are
to use a core set of RCMs
to downscale a core set of GCMs
to cover the major inhabited areas of the world
to use different representative concentration pathways (RCPs)
to incrementally extend the CORDEX-CORE ensemble with
further contributions by additional models/experiments
44. 49
CORDEX Points Of Contact
For each CORDEX
region, POCs are
listed on
www.cordex.org
45. 50
CORDEX Points Of Contact
For each CORDEX
region, POCs are
listed on
www.cordex.org
http://www.csag.uct.ac.za/cordex-africa
49. 54
Further information
Accessing observation data:
www.ncdc.noaa.gov
https://www.esrl.noaa.gov/psd/data/gridded/data.gpcp.html
Accessing reanalysis data
https://www.ecmwf.int/en/forecasts/datasets/browse-reanalysis-datasets
https://climate.copernicus.eu -> climate data store
Accessing simulation data:
https://esgf-data.dkrz.de/projects/esgf-dkrz/
https://climate4impact.eu/impactportal/general/index.jsp
https://climate.copernicus.eu -> climate data store
50. 55
Overall Outline
●
Introduction to climate modelling
●
Bandwidth of possible future climate
developments and ensemble techniques
●
How to access climate data
●
How to visualize and analyze climate data
●
Hands-on-session: Visualization of past, present
and possible future climate conditions in different
regions.
1st
part
2nd
part
51. 56
Current state of scientific knowledge relevant to climate change:
http://www.ipcc.ch/report/ar5/
5th Assessment Report of the Intergovernmental Panel on Climate Change:
WGI 2013, WGII, WGIII,SYR 2014
IPCC Assessment Report 5
52. 57
Quick visualization of simulation data
Monthly values can easily be accessed by KNMI climate change atlas:
http://climexp.knmi.nl/plot_atlas_form.py
53. 58
Quick visualization of simulation data
Monthly values can easily be accessed by KNMI climate change atlas:
http://climexp.knmi.nl/plot_atlas_form.py
55. EXAMPLES: Number of Frost Days (FD)
LESOTHO'S EXPERIENCE
FUTURE PERIODS:
PERIOD1: 2011 - 2040 NEAR TERM
PERIOD2: 2041 - 2070 MEDIUM TERM
PERIOD3: 2071 - 2100 LONG TERM
MOKOENA FRANCE
REFERENCE/BASELINE: 1971-2000
Data used:
CORDEX-Africa-0.44
(50km resolution)
56. EXAMPLES: Projected winter pr change
LESOTHO'S EXPERIENCE
FUTURE PERIODS:
PERIOD1: 2011 - 2040 NEAR TERM
PERIOD2: 2041 - 2070 MEDIUM TERM
PERIOD3: 2071 - 2100 LONG TERM
MOKOENA FRANCE
REFERENCE/BASELINE: 1971-2000
Data used:
CORDEX-Africa-0.44
(50km resolution)
57. 62
Concise climate
characteristics of
individual countries
or regions
Available on request:
www.climate-service-center.de/climate-fact-sheets
Jointly developed with
Example-pages from CFS: Burkina Faso – Togo – Ghana
Example: GERICS Climate-Fact-Sheets
58. 65
Detailed description of temporal
development projected changes
Expert Judgement on signal strength
and confidence
based on
- statistical significance & magnitude of absolute
change
- quality of simulations in comparison to
observations
- signal-to-noise ratio of projected changes
- agreement of model simulations
Main elements of a Climate-Fact-Sheets
60. 72
Publications
National Assessment on Climate Change
GERICS Reports
Studies, Brochures and Documentations
Klima konkret
Newsletter
Books
GERICS articles at Earth System Knowledge Platform
(ESKP) of Helmholtz-Association
Publications in scientific journals
Webportals
IMPACT2C Web-Atlas
Klimanavigator
Document Server Climate Change
(Dokumentenserver Klimawandel)
Fact Sheets
Climate Fact Sheets
Site-characteristic Climate-Fact-Sheets
GERICS Climate-Focus-Paper
Toolkits
Adaptation toolkit for Cities (Stadtbaukasten)
Adaptation toolkit for Companies (Unternehmensbaukasten)
Regional modeling toolkit (Regionaler Modellierbaukasten)
Maps and Visualizations
GERICS Climate Signal Maps
GERICS Climate Signal Maps (global)
GERICS Rain Map
Trainings
Customer specific training
Sector specific training
Capacity building programmes for countries
in Africa, Asia and Latin-America
Publications and tools supporting our capacity building measures
Examples: GERICS products in a nutshell
61. 73
For further information: Visit GERICS online
Key interfaces to users and practitioners are the GERICS web-services. The main gateway is
the homepage, which is available in German, English, and in Arabic (only main pages).
www.gerics.de
62. 74
Further information
Quick visualization of simulation data
KNMI: Climate Explorer
http://climexp.knmi.nl/plot_atlas_form.py
SMHI: Regional climate change in a 1.5 degrees warmer world
https://www.smhi.se/en/climate/global-warming-levels#sc=15C
SMHI: Climate Scenarios
https://www.smhi.se/en/climate/climate-scenarios
63. 75
Further information
Accessing climate change information
Climate Change Knowledge Portal of the World Bank
http://sdwebx.worldbank.org/climateportal/
UNDP Climate Change Country Profiles
http://www.geog.ox.ac.uk/research/climate/projects/undp-cp/
Copernicus Climate Change Services (focus on Europe, but
examples and plans for extension to the world)
https://climate.copernicus.eu/
Guidelines
Guidance for EURO-CORDEX climate projections data use (mostly
applicable also to other regions)
http://guidelines.euro-cordex.net
64.
65. Global Warming of 1.5°C
An IPCC special report on the impacts of
global warming of 1.5°C above pre-industrial
levels and related global greenhouse gas
emission pathways, in the context of
strengthening the global response to the
threat of climate change, sustainable
development, and efforts to eradicate
poverty.
1
69. Where are we now?
Since pre-industrial times, human activities have
caused approximately 1°C of global warming.
• Already seeing consequences for people, nature
and livelihoods
• At current rate, would reach 1.5°C between 2030
and 2052
• Past emissions alone do not commit the world to
1.5°C
5
Ashley Cooper / Aurora Photos
71. Impacts of global warming 1.5°C
• Less extreme weather where people live,
including extreme heat and rainfall
• By 2100, global mean sea level rise will be around
10 cm lower but may continue to rise for
centuries
• 10 million fewer people exposed to risk of rising
seas
At 1.5°C compared to 2°C:
7
Jason Florio / Aurora Photos
72. Impacts of global warming 1.5°C
At 1.5°C compared to 2°C:
• Lower impact on biodiversity and species
• Smaller reductions in yields of maize, rice, wheat
• Global population exposed to increased water
shortages is up to 50% less
7
Jason Florio / Aurora Photos
73. Impacts of global warming 1.5°C
At 1.5°C compared to 2°C:
• Lower risk to fisheries and the livelihoods that
depend on them
• Up to several hundred million fewer people
exposed to climate-related risk and susceptible to
poverty by 2050
7
Jason Florio / Aurora Photos
74. 86
Example: IMPACT2C web-atlas
GERICS coordinated the EU Project IMPACT2C: Estimating the key impacts of a +2°C climate
change signal for different regions and sectors of the world. The IMPACT2C web-atlas provides
climate change information for the development of possible adaptation strategies.
www.atlas.impact2c.eu
76. 93
Example: Quantify the benefits of staying at 1.5°C
●
Data basis:
●
E-OBS as reference
●
EURO-CORDEX ensemble
●
Fixed population density data for 2015 interpolated to EUR-11
●
30 year periods in which the driving GCM projects a +1.5°C,
+2°C and +3°C global warming level
●
Significance test
●
Mann-Whitney-U test (90% confidence level)
●
Ensemble-CCS is significant if >66% of simulations show a
significant CCS
●
Aim: Quantify the benefits of staying at 1.5°C global warming
level compared to 2°C and 3°C global warming
77. 94
Example: Quantify the benefits of staying at 1.5°C
Hot days per year
E-
Obs
CCS under
+1.5°C
CCS(+2°C) –
CCS(+1.5°C)
CCS(+3°C) –
CCS(+1.5°C)
CCS under +1.5°CE-Obs
CCS(+3°C) – CCS(+1.5°C)CCS(+2°C) – CCS(+1.5°C)
Teichmann et al., 2018
78. 95
Overall Outline
●
Introduction to climate modelling
●
Bandwidth of possible future climate
developments and ensemble techniques
●
How to access climate data
●
How to visualize and analyze climate data
●
Hands-on-session: Visualization of past, present
and possible future climate conditions in different
regions.
1st
part
2nd
part
83. 100
Dimensions Policies/tools
Global Global goal on adaptation
Regional /
Continental
Regional Strategies
National
National Adaptation Plans -
Strategies
National Communications
Subnational
Cities / Sectoral Adaptation
Plans
Local
Adaptation implementation /
undertaking / efforts
GERICS R&D strategy:
• Networking
• Modeling
• Prototype development
• Capacity building
→ service needs science
GERICS: science for solutions
Adaptation strategies across local to global scales
84. 101
Capacity
Building
System Dynamics
Dimensions Policies/tools
Global Global goal on adaptation
Regional /
Continental
Regional Strategies
National
National Adaptation Plans -
Strategies
National Communications
Subnational
Cities / Sectoral Adaptation
Plans
Local
Adaptation implementation /
undertaking / efforts
Adaptation strategies across local to global scales
GERICS: science for solutions
85. 102
• Climate models deliver a valuable tool for the assessment of
potential future climate change
• One has to know how to interpret the data of climate models and
one has to be careful to not over interpret
• Climate models are suspect to uncertainty
• Never rely a decision on the
output of a single model or emission
scenario
• Build on existing knowledge and
expertise
• Regional expertise is essential
Things to remember when using climate data
Contact:
Claas Teichmann
Climate Service Center Germany
Fischertwiete 1
20095 Hamburg
claas.teichmann@hzg.de
www.climate-service-center.de
86. 103
• Climate models deliver a valuable tool for the assessment of
potential future climate change
• One has to know how to interpret the data of climate models and
one has to be careful to not over interpret
• Climate models are suspect to uncertainty
• Never rely a decision on the
output of a single model or emission
scenario
• Build on existing knowledge and
expertise
• Regional expertise is essential
Things to remember when using climate data
Contact:
Claas Teichmann
Climate Service Center Germany
Fischertwiete 1
20095 Hamburg
claas.teichmann@hzg.de
www.climate-service-center.de
Parallel Session tomorrow in Room 205
Parallel Session 5.3: Mediated modeling: using
systems dynamics to build collaborative tools
(GERICS, NAP technical working group)