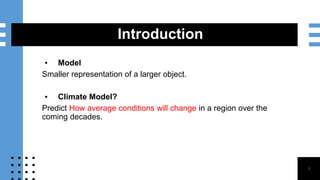
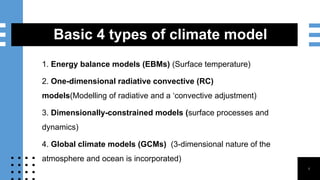
CLIMATE MODELLING
AS2016078
Contents critical review discuss
▪ Introduction
▪ GCM
▪ RCM
▪ Current Problems
▪ Main limitations and Challenges
▪ Projected changes
▪ Model usage in sri lanka
▪ Conclusion
▪ References
2
Introduction
▪ Model
Smaller representation of a larger object.
▪ Climate Model?
Predict How average conditions will change in a region over the
coming decades.
3
Basic 4 types of climate model
1. Energy balance models (EBMs) (Surface temperature)
2. One-dimensional radiative convective (RC)
models(Modelling of radiative and a ‘convective adjustment)
3. Dimensionally-constrained models (surface processes and
dynamics)
4. Global climate models (GCMs) (3-dimensional nature of the
atmosphere and ocean is incorporated)
4
Climate and climate modelling
(Source: IPCC, 2007 )
5
5 components
1. Solar Radiation
2. Dynamics
3. Surface processes
4. Chemistry
5. Resolution in both time and space
(Source: McGuffie and Henderson-
Sellers, 2005)
6
Contemporary GCMs
▪ (GCMs) simulate the Earth‘s climate via
mathematical equations that describe
atmospheric, oceanic, and biotic
processes, interactions, and feedbacks.
▪ The primary tool for understanding how
the global climate may change in the
future
▪ They have between 10 and 20 layers in
the atmosphere, and as many as 30
layers in the ocean.
▪ Contemporary AOGCMs have a
horizontal resolution of between 250km
and 600km.
7
Contemporary GCMs
▪ Based on the Navier–Stokes
equations on a rotating sphere with
thermodynamic terms for various
energy sources (radiation, latent
heat).
𝜌 𝐷𝑣/𝐷𝑡 = 𝛻𝑝 + 𝜇𝛻2𝑣 + 𝑓
(Where, “𝜌” is a density; “𝑣” is a flow
speed; “𝑡” is a time; “𝑝” is a pressure; “𝜇”
is a dynamic viscosity; and “𝑓” is a body
forces) 8
Types of GCMs
1. AGCM (Atmospheric GCM)
Atmosphere & impose sea surface
temperature
2. OGCM (Ocean GCM) Global sea
patterns
3. AOGCM (Atmosphere and Ocean
GCM)
HadCM3
GFDL
CGSM 9
GCM process
10
Inputs
Past and present forcings
▪ Changes in the sun’s output,
▪ Long-lived greenhouse gases – CO2, CH4, N2O
and halocarbons and aerosols
▪ The “Representative Concentration Pathways” (RCPs)
which provide plausible descriptions of the future, based on
socio-economic scenarios of how global society grows and
develops
11
Outputs
Complete picture of the Earth’s climate
▪ Temperatures & humidity
▪ Salinity and acidity (pH) of the oceans
▪ Estimates of snowfall, rainfall, snow cover and the
extent of glaciers, ice sheets and sea ice.
▪ Generate wind speed, strength and direction,
▪ Jet stream and Ocean currents
12
Regional Climate Models (RCMS)
13
Regional Climate Models (RCMs)
The added value of the RCMs in
comparison with the GCMs
▪ Higher detail for mountain
ranges and coastal zones,
differing vegetation coverage
and soil characteristics
A description of smaller-scale
atmospheric processes
14
Model evaluation
▪ Comparison with observational data
▪ Even more data produced
▪ More data collected at selected sites
▪ Comparing against the average state of the climate
▪ Model inter-comparison projects, provide a way to look at
similarities and differences between models.
15
Emission Scenarios
▪ A1 rapid economic growth, a global population that peaks in
mid-century and more efficient technologies.
▪ A2 high population growth, slow economic and technological
change
▪ B1 same global population as A1,& more rapid changes in
economy
▪ B2 intermediate population and economic growth,
Climate projections for South Asia and Sri Lanka are available for
scenarios A1, A2, B1 and B2 (IPCC 2000)
16
Projected Changes (IPCC, AR5)
• Global Average Surface Temperature change
17
Projected Changes (IPCC, AR5)
• CMIP5 multi-model mean spatial distribution
18
Projected Changes (IPCC, AR5)..
(Source: IPCC,
Figure 3
19
Projected Changes (IPCC, AR5)..
• Global ocean surface pH
20
Projected Changes (IPCC, AR5)..
• Global mean sea level rise
21
Projected Changes (IPCC, AR5)..
• Figure: Temperature increase vs cumulative carbon emissions
22
RF & T Scenarios for Sri Lanka
▪ High diversity of altitude from sea level within short distance
▪ Resolution power of the grid points of the GCMs (300 km X 300
km) are not sufficient enough
▪ GCM Based Statistical Downscaling is used
o Sim CLIM Software
o ANUSPLIN Software
23
Baseline (1961-1990) average Rainfall in
Northeast Monsoon (NEM)
Baseline (1961-1990) average Rainfall in
Southwest Monsoon (SWM)
24
1961-1990 Baseline average Tmean in
Northeast Monsoon
1961-1990 Baseline average Tmean in
Second Inter Monsoon
25
Annual rainfall variability in Nuwara-Eliya
-1000
-500
0
500
1000
1500
2000
1900
1910
1920
1930
1940
1950
1960
1970
1980
1990
2000
yearRFanomalyinmm
(from1961-1990)
Annual rainfall variability in Colombo
-2000
-1500
-1000
-500
0
500
1000
1500
2000
1900
1910
1920
1930
1940
1950
1960
1970
1980
1990
2000
year
RFanomalyinmm
(from1961-1990)
26
Annual minimum air Temperature anomaly trend in Colombo
y = 0.005x - 0.3796
R2
= 0.1976
-1
-0.8
-0.6
-0.4
-0.2
0
0.2
0.4
0.6
0.8
1900 1908 1916 1924 1932 1940 1948 1956 1964 1972 1980 1988 1996
yearTminAnomalyinC(from
1961-1990)
Annual minimum air Temperature anomaly trend in Nuwara-
Eliya
y = 0.02x - 1.6757
R2
= 0.6888
-2.5
-2
-1.5
-1
-0.5
0
0.5
1
1.5
1901 1909 1917 1925 1933 1941 1949 1957 1965 1973 1981 1989 1997
year
TminAnomalyinC
(from1961-1990)
27
Mean Temperature and rainfall Change
Scenarios in 2100
Mean Temperature in June 2100 under the A1
CGCM
Rainfall in June 2100
Under A2
HadCM3 28
Range of Mean Temperature
Increment over the baseline in
June 2100
HadCM3 CSIRO CGCM
A1 2.5 – 3.0 2.2 – 2.4 2.0 – 2.2
A2 2.1 – 2.5 1.9 – 2.0 1.7 – 1.8
B1 1.1 – 1.4 1.0 – 1.1 0.9 – 1.0
29
Current Problems
▪ The methodologies have been only based on downscaling
the results from global scale models,
▪ The various projections have been inconsistent without
further investigation
▪ Projections have not been borne out in the last 15 years
30
Main limitations and Challenges
▪ Impossible to simulate with 100% accuracy
▪ Uncertainty to climate projections cope with greenhouse gas
emissions
▪ How well they represent clouds
▪ GCMs do not simulate individual storms and local high
rainfall events
31
Conclusion
▪ GCM are the best tool we have for determining the range
and extent of climate change, as well as for working out what
is likely to happen in the future.
▪ All current models agree that current climatic change is a
result of anthropogenic influences.
▪ Future climate change will depend on the current human
response to that knowledge.
▪ Although GCM outputs are very large scale, they can be
refined and downscaled to assist in prediction for smaller
areas.
▪ Thus, the outputs from GCMs can be exceedingly useful in
terms of for responses to climate change. 32
Outputs as Inputs..
Output is then used as input to assess
▪ Water availability in future.
▪ Food safety
▪ Biodiversity trends
▪ Conservation planning
33
References..
• 2020. http://www.meteo.gov.lk/images/sljom.pdf.
• Carbon Brief. 2020. Q&A: How Do Climate Models Work? | Carbon
Brief. [online] Available at: <https://www.carbonbrief.org/qa-how-
do-climate-models-work> [Accessed 1 August 2020].
• Globalsupportprogramme.org. 2020. [online] Available at:
<https://www.globalsupportprogramme.org/sites/default/files/resour
ces/ecca-country-report-sri-lanka.pdf> [Accessed 1 August 2020].
• User, S., 2020. Home. [online] Meteo.gov.lk. Available at:
<http://www.meteo.gov.lk/index.php?lang=en> [Accessed 2 August
2020].
34

Environmental modelliing

  • 1.
  • 2.
    Contents critical reviewdiscuss ▪ Introduction ▪ GCM ▪ RCM ▪ Current Problems ▪ Main limitations and Challenges ▪ Projected changes ▪ Model usage in sri lanka ▪ Conclusion ▪ References 2
  • 3.
    Introduction ▪ Model Smaller representationof a larger object. ▪ Climate Model? Predict How average conditions will change in a region over the coming decades. 3
  • 4.
    Basic 4 typesof climate model 1. Energy balance models (EBMs) (Surface temperature) 2. One-dimensional radiative convective (RC) models(Modelling of radiative and a ‘convective adjustment) 3. Dimensionally-constrained models (surface processes and dynamics) 4. Global climate models (GCMs) (3-dimensional nature of the atmosphere and ocean is incorporated) 4
  • 5.
    Climate and climatemodelling (Source: IPCC, 2007 ) 5
  • 6.
    5 components 1. SolarRadiation 2. Dynamics 3. Surface processes 4. Chemistry 5. Resolution in both time and space (Source: McGuffie and Henderson- Sellers, 2005) 6
  • 7.
    Contemporary GCMs ▪ (GCMs)simulate the Earth‘s climate via mathematical equations that describe atmospheric, oceanic, and biotic processes, interactions, and feedbacks. ▪ The primary tool for understanding how the global climate may change in the future ▪ They have between 10 and 20 layers in the atmosphere, and as many as 30 layers in the ocean. ▪ Contemporary AOGCMs have a horizontal resolution of between 250km and 600km. 7
  • 8.
    Contemporary GCMs ▪ Basedon the Navier–Stokes equations on a rotating sphere with thermodynamic terms for various energy sources (radiation, latent heat). 𝜌 𝐷𝑣/𝐷𝑡 = 𝛻𝑝 + 𝜇𝛻2𝑣 + 𝑓 (Where, “𝜌” is a density; “𝑣” is a flow speed; “𝑡” is a time; “𝑝” is a pressure; “𝜇” is a dynamic viscosity; and “𝑓” is a body forces) 8
  • 9.
    Types of GCMs 1.AGCM (Atmospheric GCM) Atmosphere & impose sea surface temperature 2. OGCM (Ocean GCM) Global sea patterns 3. AOGCM (Atmosphere and Ocean GCM) HadCM3 GFDL CGSM 9
  • 10.
  • 11.
    Inputs Past and presentforcings ▪ Changes in the sun’s output, ▪ Long-lived greenhouse gases – CO2, CH4, N2O and halocarbons and aerosols ▪ The “Representative Concentration Pathways” (RCPs) which provide plausible descriptions of the future, based on socio-economic scenarios of how global society grows and develops 11
  • 12.
    Outputs Complete picture ofthe Earth’s climate ▪ Temperatures & humidity ▪ Salinity and acidity (pH) of the oceans ▪ Estimates of snowfall, rainfall, snow cover and the extent of glaciers, ice sheets and sea ice. ▪ Generate wind speed, strength and direction, ▪ Jet stream and Ocean currents 12
  • 13.
  • 14.
    Regional Climate Models(RCMs) The added value of the RCMs in comparison with the GCMs ▪ Higher detail for mountain ranges and coastal zones, differing vegetation coverage and soil characteristics A description of smaller-scale atmospheric processes 14
  • 15.
    Model evaluation ▪ Comparisonwith observational data ▪ Even more data produced ▪ More data collected at selected sites ▪ Comparing against the average state of the climate ▪ Model inter-comparison projects, provide a way to look at similarities and differences between models. 15
  • 16.
    Emission Scenarios ▪ A1rapid economic growth, a global population that peaks in mid-century and more efficient technologies. ▪ A2 high population growth, slow economic and technological change ▪ B1 same global population as A1,& more rapid changes in economy ▪ B2 intermediate population and economic growth, Climate projections for South Asia and Sri Lanka are available for scenarios A1, A2, B1 and B2 (IPCC 2000) 16
  • 17.
    Projected Changes (IPCC,AR5) • Global Average Surface Temperature change 17
  • 18.
    Projected Changes (IPCC,AR5) • CMIP5 multi-model mean spatial distribution 18
  • 19.
    Projected Changes (IPCC,AR5).. (Source: IPCC, Figure 3 19
  • 20.
    Projected Changes (IPCC,AR5).. • Global ocean surface pH 20
  • 21.
    Projected Changes (IPCC,AR5).. • Global mean sea level rise 21
  • 22.
    Projected Changes (IPCC,AR5).. • Figure: Temperature increase vs cumulative carbon emissions 22
  • 23.
    RF & TScenarios for Sri Lanka ▪ High diversity of altitude from sea level within short distance ▪ Resolution power of the grid points of the GCMs (300 km X 300 km) are not sufficient enough ▪ GCM Based Statistical Downscaling is used o Sim CLIM Software o ANUSPLIN Software 23
  • 24.
    Baseline (1961-1990) averageRainfall in Northeast Monsoon (NEM) Baseline (1961-1990) average Rainfall in Southwest Monsoon (SWM) 24
  • 25.
    1961-1990 Baseline averageTmean in Northeast Monsoon 1961-1990 Baseline average Tmean in Second Inter Monsoon 25
  • 26.
    Annual rainfall variabilityin Nuwara-Eliya -1000 -500 0 500 1000 1500 2000 1900 1910 1920 1930 1940 1950 1960 1970 1980 1990 2000 yearRFanomalyinmm (from1961-1990) Annual rainfall variability in Colombo -2000 -1500 -1000 -500 0 500 1000 1500 2000 1900 1910 1920 1930 1940 1950 1960 1970 1980 1990 2000 year RFanomalyinmm (from1961-1990) 26
  • 27.
    Annual minimum airTemperature anomaly trend in Colombo y = 0.005x - 0.3796 R2 = 0.1976 -1 -0.8 -0.6 -0.4 -0.2 0 0.2 0.4 0.6 0.8 1900 1908 1916 1924 1932 1940 1948 1956 1964 1972 1980 1988 1996 yearTminAnomalyinC(from 1961-1990) Annual minimum air Temperature anomaly trend in Nuwara- Eliya y = 0.02x - 1.6757 R2 = 0.6888 -2.5 -2 -1.5 -1 -0.5 0 0.5 1 1.5 1901 1909 1917 1925 1933 1941 1949 1957 1965 1973 1981 1989 1997 year TminAnomalyinC (from1961-1990) 27
  • 28.
    Mean Temperature andrainfall Change Scenarios in 2100 Mean Temperature in June 2100 under the A1 CGCM Rainfall in June 2100 Under A2 HadCM3 28
  • 29.
    Range of MeanTemperature Increment over the baseline in June 2100 HadCM3 CSIRO CGCM A1 2.5 – 3.0 2.2 – 2.4 2.0 – 2.2 A2 2.1 – 2.5 1.9 – 2.0 1.7 – 1.8 B1 1.1 – 1.4 1.0 – 1.1 0.9 – 1.0 29
  • 30.
    Current Problems ▪ Themethodologies have been only based on downscaling the results from global scale models, ▪ The various projections have been inconsistent without further investigation ▪ Projections have not been borne out in the last 15 years 30
  • 31.
    Main limitations andChallenges ▪ Impossible to simulate with 100% accuracy ▪ Uncertainty to climate projections cope with greenhouse gas emissions ▪ How well they represent clouds ▪ GCMs do not simulate individual storms and local high rainfall events 31
  • 32.
    Conclusion ▪ GCM arethe best tool we have for determining the range and extent of climate change, as well as for working out what is likely to happen in the future. ▪ All current models agree that current climatic change is a result of anthropogenic influences. ▪ Future climate change will depend on the current human response to that knowledge. ▪ Although GCM outputs are very large scale, they can be refined and downscaled to assist in prediction for smaller areas. ▪ Thus, the outputs from GCMs can be exceedingly useful in terms of for responses to climate change. 32
  • 33.
    Outputs as Inputs.. Outputis then used as input to assess ▪ Water availability in future. ▪ Food safety ▪ Biodiversity trends ▪ Conservation planning 33
  • 34.
    References.. • 2020. http://www.meteo.gov.lk/images/sljom.pdf. •Carbon Brief. 2020. Q&A: How Do Climate Models Work? | Carbon Brief. [online] Available at: <https://www.carbonbrief.org/qa-how- do-climate-models-work> [Accessed 1 August 2020]. • Globalsupportprogramme.org. 2020. [online] Available at: <https://www.globalsupportprogramme.org/sites/default/files/resour ces/ecca-country-report-sri-lanka.pdf> [Accessed 1 August 2020]. • User, S., 2020. Home. [online] Meteo.gov.lk. Available at: <http://www.meteo.gov.lk/index.php?lang=en> [Accessed 2 August 2020]. 34

Editor's Notes

  • #6 Factors of GCM-Earth climate system • Parameters involved in GCMs are cloud fraction, albedo, land surface processes etc. HOW ALL THESE FACTORS INTERACT. Living organism, Energy- sun,Land forms, Glacier ice
  • #7 Important 5 components to understand climate models 1. Solar Radiation (absorbed by the atmosphere and sea) 2. Dynamics (movement of energy/heat and mass by winds) 3. Surface processes (effects of ice, snow, vegetation, albedo, and moisture interchanges) 4. Chemistry (Chemical composition of atmosphere and interactions, e.g. CO2 exchanges between sea, land and atmosphere) 5. Resolution in both time and space (the time step of the model and horizontal & vertical scales resolved) (Source: McGuffie and Henderson-Sellers, 2005)
  • #11 Any information that is presented at spatial scales finer than 100 kilometers x 100 kilometers and temporal scales finer than monthly values has undergone a process called downscaling.
  • #13 Climate models generate a nearly complete picture of the Earth’s climate, including thousands of different variables across hourly, daily and monthly timeframes. produce an estimate of “climate sensitivity”. That is, they calculate how sensitive the Earth is to increases in greenhouse gas concentrations,
  • #14 RCMs are tools used to achieve high-resolution climate data from coarsely resolved GCMs.
  • #16 Climate models must be evaluated very critically by the scientists the average of all models can be more accurate than most individual models
  • #17 that explore alternative development pathways in terms of population and GDP growth, energy use, land use changes, fossil fuel use, etc., and resulting GHG emissions (IPCC 2000). All climate models use scenarios grouped into four scenario families (A1, A2, B1 and B2
  • #18 Global surface temperature change for the end of the 21st century is likely to exceed 1.5°C relative to 1850 for all scenarios.
  • #20 GCM model responses : All GCMs are tested to ensure that they correctly model previous palaeoclimatological conditions to the present day. However, although they often agree on general trends for a given scenario, they may predict moderately different responses over time Consequently, climate scientists tend to use several different models and scenarios for any given set of predictions or plans.
  • #21 The ocean acidification is one of the clearest signals of the anthropogenic climate change. A spatial distribution of the change is also found.
  • #22 Global mean sea level will continue to rise during the 21st century even under mitigation scenarios
  • #23 Limiting climate change will require substantial and sustained reductions of greenhouse gas emissions
  • #25 Baseline (1961 – 1990) Climatology
  • #26 Baseline (1961 – 1990) Climatology
  • #27 Annual average of rainfall over Sri Lanka has been decreased by about 7%, during 1961 to 1990 period compared to 1931 to 1960 period.
  • #28 The rate of increase of mean annual air temperature for the 1961-1990 period is in the order of 0.016 0C per year.
  • #29 Projected June Rainfall increases with HadCM3 under A2 Scenario. The increments are much more higher on the western slopes of the central hills (windward side) compared to leeward side.
  • #30 Projected Mean Temperature increases under different scenarios for different GCM models with varying magnitudes.
  • #32 depending on the type of cloud and the time of day scientists use “parameterisations” (see above) that represent the average effects