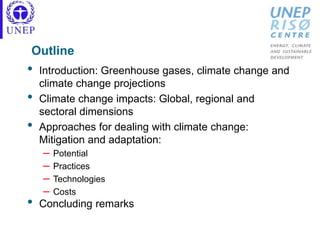
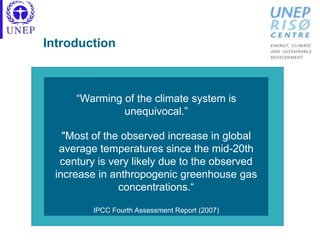
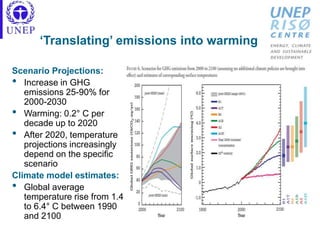
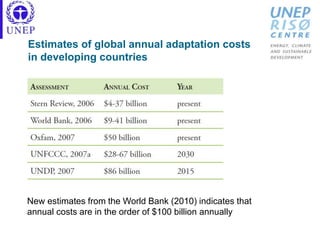
SlideShare a Scribd company logo
Climate Change:
The Current State of Knowledge
Secretariat Presentation of the WTO-UNEP Trade and
Climate Change Report, WTO, Geneva, 16 February 2010
Outline
• Introduction: Greenhouse gases, climate change and
climate change projections
• Climate change impacts: Global, regional and
sectoral dimensions
• Approaches for dealing with climate change:
Mitigation and adaptation:
– Potential
– Practices
– Technologies
– Costs
• Concluding remarks
Introduction
“Warming of the climate system is
unequivocal.”
"Most of the observed increase in global
average temperatures since the mid-20th
century is very likely due to the observed
increase in anthropogenic greenhouse gas
concentrations.“
IPCC Fourth Assessment Report (2007)
Climate versus weather
• Climate: A statistical description of the mean and
variability of temperature, precipitation, wind, etc.
over a period of time ranging from months to
thousands or millions of years
• Weather: The present condition of the above
elements, typically over periods up to two weeks
• Climate change: A change in the state of the mean
and/or variability of these elements that can be
identified statistically and that persists over a longer
period, typically decades or longer.
Greenhouse gas (GHG) emissions and
global warming
• Sharp increase in the emissions of GHGs and their
concentration in the earth’s atmosphere since the
onset of industrialisation
• GHGs cause heat from the sun to be retained in the
atmosphere contributing to global warming and CC
• Atmospheric concentration of CO2 increased by 36%
over the past 250 years
• More than 60% of this increase has taken place in
the last 50 years
Current contribution to global warming of
major GHGs
Carbon dioxide, mainly from burning of fossil fules and
deforestation: 77%
Methane, mainly from land-use and agriculture changes:
14%
Nitrous oxide (agriculture), ozone (e.g. vehicles), and
halocarbons and other industrial process gases: 9%
‘Translating’ emissions into warming
• Predictions of future climate change and its likely impacts
are based on projections of greenhouse gas emissions
and climate model estimation of associated impacts
• IPCC scenarios provided in the Special Report on
Emission Scenarios (SRES) in 2000, present most
frequently used baselines for climate change projections:
– Four different ‘families’ of storylines provide a wide range of
possible future emissions up to 2100 that can be used as
baselines for climate modelling and economic analyses of
climate change.
– Each storyline and corresponding scenario has different
assumptions about technologies and energy sources/use,
rate of economic growth, governance structures, etc.
‘Translating’ emissions into warming
Scenario Projections:
• Increase in GHG
emissions 25-90% for
2000-2030
• Warming: 0.2° C per
decade up to 2020
• After 2020, temperature
projections increasingly
depend on the specific
scenario
Climate model estimates:
• Global average
temperature rise from 1.4
to 6.4° C between 1990
and 2100
CC is a concentration problem as well as an
emission problem
• Many greenhouse gases remain in the atmosphere for
very long periods
• Time lag between the moment of emission and the new
equilibrium of the climate system
• World Bank (2008) estimate: Global warming
of around 2°C is probably unavoidable by now
• The corresponding best estimate from the
IPCC (2007) is 1.8°C
→ Global warming will continue to affect the
natural systems of the earth for several hundred
years, even if greenhouse gas emissions were
substantially reduced or ceased altogether today
Increased certainty on the links between
warming and impacts
• Improved analyses of temperature records
• Use of new computer models to estimate variability and
climate system responses to both natural and man-made
causes
• Increased understanding of climate processes enabling
incorporation of more detailed information:
– Sea-ice dynamics
– Ocean heat transport
– Water vapour
→ Greater certainty that the links observed between
warming and its impacts are reliable
Global, regional, and sectoral dimensions
Observed and projected climate change
impacts
Observed temperature changes
• Global average temperatures and the rate of change have
increased over the past 150 years :
– The global average surface temperature increased by about
0.74°C between 1906 and 2005,
– The warming trend per decade has been almost twice as
high for the last 50 years compared to the trend for the past
100 years
– From 1976 to 2007, the rate of temperature change was
three times higher than the rate for the past 100 years
• Measurements from weather balloons and satellites
indicate that warming rates in the atmospheric
temperature are similar to those observed in surface
temperature
Model projections of surface warming and
regional differences
Changes in precipitation
Observed changes:
• Significant increases:
– Northern Europe
– Northern and central Asia
– Eastern parts of North and
South America
• Decreases:
– Parts of southern Asia
– The Mediterranean
– The Sahel
– Southern Africa
Projected changes:
• Substantial increases in
annual mean precipitation:
– Most high latitude regions
– Eastern Africa
– Central Asia
• Substantial decreases:
– The Mediterranean region
– The Caribbean region
– Sub-tropical regions
Climate variability and extreme events
• Frequency and intensity of extreme weather events
are observed and are projected to increase even with
small temperature increases
• Heavy precipitation events projected to have potential
negative impacts on trade through disruption to
infrastructure and as a result of may not be limited to
direct damage to agricultural outputs
• Climate variability and extreme events exacerbate
the general impacts of climate change in specific
locations at specific points in time
Sea level rise and changes in snow, ice and
frozen ground
• Sea level rise projections vary significantly depending
on climate models and assumptions
• Changes in sea ice may lead to availability of new
shipping routes with significant implications for
transport and exploitation of resources, including
fossil fuels
• Changes in permafrost and increasing ground
instability has implications for transport, industry and
infrastructure
Examples of projected sectoral CC impacts
Examples of projected regional CC impacts
Africa Significant water shortages; lower agricultural production; hunger and
malnutrition; increase in arid and semi-arid lands; sea-level rise affecting
low lying coastal areas and populations
Asia Decreased freshwater availability; flooding in heavily populated mega-
deltas, etc.; endemic morbidity and mortality from increase in diarrhoeal
diseases; additional pressure on environment and natural resources
Australia and
New Zealand
Significant loss of biodiversity; water security problems; decreased
agricultural and forestry production; ongoing coastal development not
climate proofed
Europe Inland flash floods; coastal flooding and erosion; glacier retreat; reduced
snow cover with negative impacts on winter tourism; extensive species
loss; severe impacts for Southern Europe (droughts, etc.)
Latin America Decreases in crop and livestock productivity; changes to tropical forests
and vegetation; increase in population at risk of hunger; changes in
precipitation patterns and glacier melting posing severe problems
North
America
Decreased snowpack in western mountains, winter flooding and reduced
summer flows; first increased agricultural yields in some regions;
challenges for crops close to temperature thresholds; heat waves
Approaches for dealing with climate
change: Mitigation and Adaptation
Avoiding the unmanageable
and
Managing the unavoidable
UNCSD 2007
Mitigation: Avoiding the unmanageable
• Mitigation is defined by the IPCC as technological
change and substitution that reduce resource inputs
and emissions per unit of output
• Requires implementation of policies and measures to
reduce greenhouse gas emissions and/or enhance
carbon sinks
Trends in GHG emissions
• Global GHG emissions have increased by 100% from
1970s to 2005
• GHG emissions projected to increase another 80%
by 2050 if there are no significant changes to current
policies
• CO2 emissions are the fastest growing and annual
growth rates have increased from 1.1% in the 1990s
to more than 3.0% in 2000-2004
→ Current trends in GHG emissions indicate that we
are heading towards the higher end of the IPCC
scenarios
Trends in the structure of GHG emissions
• Industrialised countries bear main responsibility for past
emissions and current atmospheric concentrations of GHGs
• Emissions per capita in industrialized countries are around four
times higher than those in developing countries’
• CO2 intensity of developing countries > industrialized country –
Indicating a significant potential for efficiency gains
• Annual energy-related carbon dioxide emissions from non-
OECD countries now surpass emissions from OECD countries.
• Total annual GHG emissions of industrialized countries and
developing countries are now roughly the same
• 8 out of the top 20 GHG emitting countries are DCs
• Developing countries account for roughly 2/3 of the flow of new
emissions
• Average annual increase in emissions for 2005-2030 projected
at 2.5% for non-OECD countries and 0.5% for OECD countries
→ Any effective response to climate change must
include both industrialised and developing countries
Global flow of GHG emissions by sector
and end-use Activity
Source: Baumert et al. (2005)
Mitigation options and potential
• Significant emission reductions requires exploiting mitigation
potentials across all sectors - involving a broad range of
technologies
• Key options for mitigation include:
– Using energy more efficiently to reduce the emissions from fossil
fuel use
– Switching to zero- or low-carbon energy technologies
– Reducing deforestation
– Introducing improved farming practices and waste treatment
• Deployment of existing technologies and technologies currently
under development would enable realisation even of ambitious
emission targets
Stabilisation targets and associated cost
estimates
Two stabilization targets widely discussed and analysed:
• Limiting increases in temperature to 2°C (corresponding to
a GHG concentration range of 445-490 parts per million)
to avoid dangerous anthropogenic interference with the
climate system
– Advocated e.g. by the EU
• Limiting increases in temperature to approximately 3°C,
corresponding to a stabilisation of CO2 levels in the
atmosphere at around twice the pre-industrial level
– More extensively studied in science, and suggested by the
IPCC as an upper threshold for avoiding dangerous human
interference with the climate system
Mitigation and cost implications of the two
stabilisation targets
• 2°C target:
– Emissions reduction: 50-85% relative to 2000 level by 2050
– Macro-economic costs: annual reduction in global GDP of
more than 3% (IPCC)
• 3°C target:
– Emissions reduction: 30% lover to 5% higher than emission
levels in 2000 by 2050
– Macro-economic costs: annual reduction in global GDP of
0.2-2.5% (IPCC); 1% (Stern Review)
Carbon prices
• Carbon pricing: Equalising the marginal cost of CO2
emission reductions for all sources of emissions by
introducing a price per tonne of CO2 -equivalent GHG
emissions reduced
• Enables comparison of emission reduction potentials
for sectors and technologies at various carbon prices
• Creates incentives to undertake research and
development and to innovations in energy-saving and
climate-friendly technologies
Mitigation potentials by sector and as a
function of carbon prices, I
• Building sector: Largest potential for GHG emission
reductions, much at low cost. Technologies include
energy efficiency; improved cooking stoves; solar
heating; and, efficient lighting and appliances.
• Energy supply sector: High potential and increasing with
carbon prices up to 50 USD. Technologies include:
Improved supply and distribution efficiency; fuel-
switching from coal to gas; nuclear power; renewable
heat and power sources; combined heat and power;
early applications of Carbon Capture and Storage
• Industrial sector: High potential that increases with
carbon prices. Technologies include efficient end-use
equipment; heat and power recovery; material recycling
and substitution; carbon Capture and Storage
Mitigation potentials by sector and as a
function of carbon prices, II
• Agriculture and forestry: High potential at all levels of
carbon prices. Available technologies include
Improved crop, livestock, forest and land
management and cultivation techniques; restoration
of cultivated peaty soils and degraded lands;
improved nitrogen fertilizer application techniques;
dedicated energy crops to replace fossil fuel use;
improved energy efficiency; afforestation; reduced
deforestation
• Transport and waste sector: GHG emission reduction
potential not very responsive to carbon price
increases. Technologies include fuel-efficient, hybrid
and cleaner diesel vehicles; biofuels; shifts from road
transport to rail and public transport systems; non-
motorized transport; land use and transport planning.
Global GHG abatement cost curve
Source: McKinsey & Companys Global GHG Abatement Cost Curve v2.0
Adaptation: Managing the unavoidable
• Adaptation is defined by the IPCC as an “adjustment
in natural or human systems in response to actual or
expected climatic stimuli or their effects, which
moderates harm or exploits beneficial opportunities.”
• Effective options for adaptation depend on specific
geographical and climate risk factors as well as on
socio-economic, institutional, political and financial
circumstances
Typology of adaptation technologies
• Hard technologies: tools, equipment, physical
facilities, etc.
• Soft technologies: management, behavioral changes,
knowledge to use tools and machinery.
• “Org-ware”: institutional framework or organisation
required to implement the technology.
• Sectors commonly used: freshwater resources,
forests and ecosystems, agriculture, coastal systems,
industry, and health
Differences between adaptation and
mitigation technologies
• Climate adaptation is often the continuation of an ongoing
process where the same techniques have been used for
generations (e.g. houses on stilts)
• Few technologies are specifically designed for adaptation, rather
they respond to broader sustainable development needs (e.g.
improved water quality)
• Adaptation technologies are often less capital intensive, suitable
to small-scale interventions and local variations and context
• The effects/outcomes of adaptation cannot be measured by a
single indicator (such as reduction in CO2-equivalent
emissions), and are interlinked with broader development issues
• Transfers of adaptation technologies does not necessarily follow
a north-south approach of equipment and practices.
Technologies may already be in place but face barriers to
implementation and use
Adaptation costs
• Consensus that the costs of adaptation will generally be
smaller than the benefits, and that climate change impacts
and the associated need for adaptation will increase the
cost of, and potential for, economic development in
developing countries
• Few adaptation cost and benefit estimates have been
carried out to date, but more studies are becoming
available, particularly for specific adaptation options at
regional or project level
• Global adaptation cost figures are limited and the
assumptions about climate change impacts and
adaptation activities and technologies underlying their
derivation still coarse
Estimates of global annual adaptation costs
in developing countries
New estimates from the World Bank (2010) indicates that
annual costs are in the order of $100 billion annually
Concluding remarks
• Scientific evidence on climate change and its impacts is
conclusive
• Climate change is a concentration problem as well as an
emission problem and both mitigation and adaptation is
needed in an effective response
• Any effective mitigation response strategy must include
both industrialised and developing countries
• Copenhagen…Good COP or Bad COP?
– Never have so many heads of state given such priority to the issue
– COP 15 moved climate change to the relevant level of political
engagement: Issues go beyond environmental aspects and affect
key economic development, trade and equity questions

More Related Content

Similar to envi..green

Fifth Assessment Report - Working Group I
Fifth Assessment Report - Working Group IFifth Assessment Report - Working Group I
Fifth Assessment Report - Working Group I
Intergovernmental Panel on Climate Change
 
Turn Down The Heat: Why a 4C Warmer World Must Be Avoided
Turn Down The Heat: Why a 4C Warmer World Must Be AvoidedTurn Down The Heat: Why a 4C Warmer World Must Be Avoided
Turn Down The Heat: Why a 4C Warmer World Must Be Avoided
The Climate Institute
 
Variable weather n changing climate gateway2 complete Sec 3 Sec 4
Variable weather n changing climate gateway2 complete Sec 3 Sec 4Variable weather n changing climate gateway2 complete Sec 3 Sec 4
Variable weather n changing climate gateway2 complete Sec 3 Sec 4
critter33
 
Climate Change Impacts Overview Delhi April 06_David Warrilo.ppt
Climate Change Impacts Overview Delhi April 06_David Warrilo.pptClimate Change Impacts Overview Delhi April 06_David Warrilo.ppt
Climate Change Impacts Overview Delhi April 06_David Warrilo.ppt
FahadAli189139
 
Implications of Climate Change
Implications of Climate ChangeImplications of Climate Change
Implications of Climate Change
Tanmay Srivastava
 
Environmental Risk
Environmental RiskEnvironmental Risk
Environmental Risk
Michel Rochette
 
Climate Change 2007 AM slides
Climate Change 2007 AM slidesClimate Change 2007 AM slides
Climate Change 2007 AM slides
nationalrural
 
Climate change.pptx
Climate change.pptxClimate change.pptx
Climate change.pptx
Aparna492851
 
Climate change
Climate change  Climate change
Academia - SESSION 1: Findings of the Special Report on Global Warming of 1.5 °C
Academia - SESSION 1: Findings of the Special Report on Global Warming of 1.5 °CAcademia - SESSION 1: Findings of the Special Report on Global Warming of 1.5 °C
Academia - SESSION 1: Findings of the Special Report on Global Warming of 1.5 °C
ipcc-media
 
Variable weather n changing climate gateway2 complete slides
Variable weather n changing climate gateway2 complete slidesVariable weather n changing climate gateway2 complete slides
Variable weather n changing climate gateway2 complete slides
critter33
 
IPCC Summary (sep 23)
IPCC Summary  (sep 23)IPCC Summary  (sep 23)
IPCC Summary (sep 23)
Cassia Moraes
 
General intro on European Climate Change and CID’s (guided by Factsheet Europe)
General intro on European Climate Change and CID’s (guided by Factsheet Europe)General intro on European Climate Change and CID’s (guided by Factsheet Europe)
General intro on European Climate Change and CID’s (guided by Factsheet Europe)
ipcc-media
 
Impacts of Climate Change
Impacts of Climate ChangeImpacts of Climate Change
Impacts of Climate Change
ACX
 
Environment Management
Environment ManagementEnvironment Management
Environment Management
Prinson Rodrigues
 
Climate Change 2013 : The Physical Science Basis
Climate Change 2013 : The Physical Science BasisClimate Change 2013 : The Physical Science Basis
Climate Change 2013 : The Physical Science Basis
JLanka Technologies (Pvt) Limited
 
Wgiar5presentation1403
Wgiar5presentation1403Wgiar5presentation1403
Wgiar5presentation1403
Nicolás Stern
 
IPCC key messages from the Fifth Assessment Report (AR5) and from the Special...
IPCC key messages from the Fifth Assessment Report (AR5) and from the Special...IPCC key messages from the Fifth Assessment Report (AR5) and from the Special...
IPCC key messages from the Fifth Assessment Report (AR5) and from the Special...
ipcc-media
 
Global Climate Change
Global Climate ChangeGlobal Climate Change
Global Climate Change
SD Paul
 
Professor Silvio Nocera: The Issue of Greenhouse Gas Emissions in Transport P...
Professor Silvio Nocera: The Issue of Greenhouse Gas Emissions in Transport P...Professor Silvio Nocera: The Issue of Greenhouse Gas Emissions in Transport P...
Professor Silvio Nocera: The Issue of Greenhouse Gas Emissions in Transport P...
Econsult Solutions, Inc.
 

Similar to envi..green (20)

Fifth Assessment Report - Working Group I
Fifth Assessment Report - Working Group IFifth Assessment Report - Working Group I
Fifth Assessment Report - Working Group I
 
Turn Down The Heat: Why a 4C Warmer World Must Be Avoided
Turn Down The Heat: Why a 4C Warmer World Must Be AvoidedTurn Down The Heat: Why a 4C Warmer World Must Be Avoided
Turn Down The Heat: Why a 4C Warmer World Must Be Avoided
 
Variable weather n changing climate gateway2 complete Sec 3 Sec 4
Variable weather n changing climate gateway2 complete Sec 3 Sec 4Variable weather n changing climate gateway2 complete Sec 3 Sec 4
Variable weather n changing climate gateway2 complete Sec 3 Sec 4
 
Climate Change Impacts Overview Delhi April 06_David Warrilo.ppt
Climate Change Impacts Overview Delhi April 06_David Warrilo.pptClimate Change Impacts Overview Delhi April 06_David Warrilo.ppt
Climate Change Impacts Overview Delhi April 06_David Warrilo.ppt
 
Implications of Climate Change
Implications of Climate ChangeImplications of Climate Change
Implications of Climate Change
 
Environmental Risk
Environmental RiskEnvironmental Risk
Environmental Risk
 
Climate Change 2007 AM slides
Climate Change 2007 AM slidesClimate Change 2007 AM slides
Climate Change 2007 AM slides
 
Climate change.pptx
Climate change.pptxClimate change.pptx
Climate change.pptx
 
Climate change
Climate change  Climate change
Climate change
 
Academia - SESSION 1: Findings of the Special Report on Global Warming of 1.5 °C
Academia - SESSION 1: Findings of the Special Report on Global Warming of 1.5 °CAcademia - SESSION 1: Findings of the Special Report on Global Warming of 1.5 °C
Academia - SESSION 1: Findings of the Special Report on Global Warming of 1.5 °C
 
Variable weather n changing climate gateway2 complete slides
Variable weather n changing climate gateway2 complete slidesVariable weather n changing climate gateway2 complete slides
Variable weather n changing climate gateway2 complete slides
 
IPCC Summary (sep 23)
IPCC Summary  (sep 23)IPCC Summary  (sep 23)
IPCC Summary (sep 23)
 
General intro on European Climate Change and CID’s (guided by Factsheet Europe)
General intro on European Climate Change and CID’s (guided by Factsheet Europe)General intro on European Climate Change and CID’s (guided by Factsheet Europe)
General intro on European Climate Change and CID’s (guided by Factsheet Europe)
 
Impacts of Climate Change
Impacts of Climate ChangeImpacts of Climate Change
Impacts of Climate Change
 
Environment Management
Environment ManagementEnvironment Management
Environment Management
 
Climate Change 2013 : The Physical Science Basis
Climate Change 2013 : The Physical Science BasisClimate Change 2013 : The Physical Science Basis
Climate Change 2013 : The Physical Science Basis
 
Wgiar5presentation1403
Wgiar5presentation1403Wgiar5presentation1403
Wgiar5presentation1403
 
IPCC key messages from the Fifth Assessment Report (AR5) and from the Special...
IPCC key messages from the Fifth Assessment Report (AR5) and from the Special...IPCC key messages from the Fifth Assessment Report (AR5) and from the Special...
IPCC key messages from the Fifth Assessment Report (AR5) and from the Special...
 
Global Climate Change
Global Climate ChangeGlobal Climate Change
Global Climate Change
 
Professor Silvio Nocera: The Issue of Greenhouse Gas Emissions in Transport P...
Professor Silvio Nocera: The Issue of Greenhouse Gas Emissions in Transport P...Professor Silvio Nocera: The Issue of Greenhouse Gas Emissions in Transport P...
Professor Silvio Nocera: The Issue of Greenhouse Gas Emissions in Transport P...
 

More from LeaPearandaAngeles

Punnet square.ppt
Punnet square.pptPunnet square.ppt
Punnet square.ppt
LeaPearandaAngeles
 
Education Resources.pdf
Education Resources.pdfEducation Resources.pdf
Education Resources.pdf
LeaPearandaAngeles
 
philippineresources-180722123916.pptx
philippineresources-180722123916.pptxphilippineresources-180722123916.pptx
philippineresources-180722123916.pptx
LeaPearandaAngeles
 
uoh_genetic_lesson01_flowchartas_v2_tedl_dwc.pdf
uoh_genetic_lesson01_flowchartas_v2_tedl_dwc.pdfuoh_genetic_lesson01_flowchartas_v2_tedl_dwc.pdf
uoh_genetic_lesson01_flowchartas_v2_tedl_dwc.pdf
LeaPearandaAngeles
 
Biodiversity.ppt
Biodiversity.pptBiodiversity.ppt
Biodiversity.ppt
LeaPearandaAngeles
 
chapter4.ppt
chapter4.pptchapter4.ppt
chapter4.ppt
LeaPearandaAngeles
 
Ecology lesson.ppt
Ecology lesson.pptEcology lesson.ppt
Ecology lesson.ppt
LeaPearandaAngeles
 
what-is-a-gmo.ppt
what-is-a-gmo.pptwhat-is-a-gmo.ppt
what-is-a-gmo.ppt
LeaPearandaAngeles
 
GB2_PerfCheck.pptx
GB2_PerfCheck.pptxGB2_PerfCheck.pptx
GB2_PerfCheck.pptx
LeaPearandaAngeles
 
ELS_Bioenergetics.pptx
ELS_Bioenergetics.pptxELS_Bioenergetics.pptx
ELS_Bioenergetics.pptx
LeaPearandaAngeles
 
Molecular Polarity.ppt
Molecular Polarity.pptMolecular Polarity.ppt
Molecular Polarity.ppt
LeaPearandaAngeles
 
PS-mod
PS-modPS-mod
CLOSING PRAYER.pptx
CLOSING PRAYER.pptxCLOSING PRAYER.pptx
CLOSING PRAYER.pptx
LeaPearandaAngeles
 
Modules 3 and 4.pptx
Modules 3 and 4.pptxModules 3 and 4.pptx
Modules 3 and 4.pptx
LeaPearandaAngeles
 
Quiz4_PR1.pptx
Quiz4_PR1.pptxQuiz4_PR1.pptx
Quiz4_PR1.pptx
LeaPearandaAngeles
 
Quiz4_PR1.pptx
Quiz4_PR1.pptxQuiz4_PR1.pptx
Quiz4_PR1.pptx
LeaPearandaAngeles
 
Lesson8_PR1_2019.pptx
Lesson8_PR1_2019.pptxLesson8_PR1_2019.pptx
Lesson8_PR1_2019.pptx
LeaPearandaAngeles
 

More from LeaPearandaAngeles (17)

Punnet square.ppt
Punnet square.pptPunnet square.ppt
Punnet square.ppt
 
Education Resources.pdf
Education Resources.pdfEducation Resources.pdf
Education Resources.pdf
 
philippineresources-180722123916.pptx
philippineresources-180722123916.pptxphilippineresources-180722123916.pptx
philippineresources-180722123916.pptx
 
uoh_genetic_lesson01_flowchartas_v2_tedl_dwc.pdf
uoh_genetic_lesson01_flowchartas_v2_tedl_dwc.pdfuoh_genetic_lesson01_flowchartas_v2_tedl_dwc.pdf
uoh_genetic_lesson01_flowchartas_v2_tedl_dwc.pdf
 
Biodiversity.ppt
Biodiversity.pptBiodiversity.ppt
Biodiversity.ppt
 
chapter4.ppt
chapter4.pptchapter4.ppt
chapter4.ppt
 
Ecology lesson.ppt
Ecology lesson.pptEcology lesson.ppt
Ecology lesson.ppt
 
what-is-a-gmo.ppt
what-is-a-gmo.pptwhat-is-a-gmo.ppt
what-is-a-gmo.ppt
 
GB2_PerfCheck.pptx
GB2_PerfCheck.pptxGB2_PerfCheck.pptx
GB2_PerfCheck.pptx
 
ELS_Bioenergetics.pptx
ELS_Bioenergetics.pptxELS_Bioenergetics.pptx
ELS_Bioenergetics.pptx
 
Molecular Polarity.ppt
Molecular Polarity.pptMolecular Polarity.ppt
Molecular Polarity.ppt
 
PS-mod
PS-modPS-mod
PS-mod
 
CLOSING PRAYER.pptx
CLOSING PRAYER.pptxCLOSING PRAYER.pptx
CLOSING PRAYER.pptx
 
Modules 3 and 4.pptx
Modules 3 and 4.pptxModules 3 and 4.pptx
Modules 3 and 4.pptx
 
Quiz4_PR1.pptx
Quiz4_PR1.pptxQuiz4_PR1.pptx
Quiz4_PR1.pptx
 
Quiz4_PR1.pptx
Quiz4_PR1.pptxQuiz4_PR1.pptx
Quiz4_PR1.pptx
 
Lesson8_PR1_2019.pptx
Lesson8_PR1_2019.pptxLesson8_PR1_2019.pptx
Lesson8_PR1_2019.pptx
 

Recently uploaded

The debris of the ‘last major merger’ is dynamically young
The debris of the ‘last major merger’ is dynamically youngThe debris of the ‘last major merger’ is dynamically young
The debris of the ‘last major merger’ is dynamically young
Sérgio Sacani
 
Eukaryotic Transcription Presentation.pptx
Eukaryotic Transcription Presentation.pptxEukaryotic Transcription Presentation.pptx
Eukaryotic Transcription Presentation.pptx
RitabrataSarkar3
 
aziz sancar nobel prize winner: from mardin to nobel
aziz sancar nobel prize winner: from mardin to nobelaziz sancar nobel prize winner: from mardin to nobel
aziz sancar nobel prize winner: from mardin to nobel
İsa Badur
 
Thornton ESPP slides UK WW Network 4_6_24.pdf
Thornton ESPP slides UK WW Network 4_6_24.pdfThornton ESPP slides UK WW Network 4_6_24.pdf
Thornton ESPP slides UK WW Network 4_6_24.pdf
European Sustainable Phosphorus Platform
 
Comparing Evolved Extractive Text Summary Scores of Bidirectional Encoder Rep...
Comparing Evolved Extractive Text Summary Scores of Bidirectional Encoder Rep...Comparing Evolved Extractive Text Summary Scores of Bidirectional Encoder Rep...
Comparing Evolved Extractive Text Summary Scores of Bidirectional Encoder Rep...
University of Maribor
 
如何办理(uvic毕业证书)维多利亚大学毕业证本科学位证书原版一模一样
如何办理(uvic毕业证书)维多利亚大学毕业证本科学位证书原版一模一样如何办理(uvic毕业证书)维多利亚大学毕业证本科学位证书原版一模一样
如何办理(uvic毕业证书)维多利亚大学毕业证本科学位证书原版一模一样
yqqaatn0
 
Nucleic Acid-its structural and functional complexity.
Nucleic Acid-its structural and functional complexity.Nucleic Acid-its structural and functional complexity.
Nucleic Acid-its structural and functional complexity.
Nistarini College, Purulia (W.B) India
 
ESR spectroscopy in liquid food and beverages.pptx
ESR spectroscopy in liquid food and beverages.pptxESR spectroscopy in liquid food and beverages.pptx
ESR spectroscopy in liquid food and beverages.pptx
PRIYANKA PATEL
 
SAR of Medicinal Chemistry 1st by dk.pdf
SAR of Medicinal Chemistry 1st by dk.pdfSAR of Medicinal Chemistry 1st by dk.pdf
SAR of Medicinal Chemistry 1st by dk.pdf
KrushnaDarade1
 
molar-distalization in orthodontics-seminar.pptx
molar-distalization in orthodontics-seminar.pptxmolar-distalization in orthodontics-seminar.pptx
molar-distalization in orthodontics-seminar.pptx
Anagha Prasad
 
8.Isolation of pure cultures and preservation of cultures.pdf
8.Isolation of pure cultures and preservation of cultures.pdf8.Isolation of pure cultures and preservation of cultures.pdf
8.Isolation of pure cultures and preservation of cultures.pdf
by6843629
 
Travis Hills' Endeavors in Minnesota: Fostering Environmental and Economic Pr...
Travis Hills' Endeavors in Minnesota: Fostering Environmental and Economic Pr...Travis Hills' Endeavors in Minnesota: Fostering Environmental and Economic Pr...
Travis Hills' Endeavors in Minnesota: Fostering Environmental and Economic Pr...
Travis Hills MN
 
mô tả các thí nghiệm về đánh giá tác động dòng khí hóa sau đốt
mô tả các thí nghiệm về đánh giá tác động dòng khí hóa sau đốtmô tả các thí nghiệm về đánh giá tác động dòng khí hóa sau đốt
mô tả các thí nghiệm về đánh giá tác động dòng khí hóa sau đốt
HongcNguyn6
 
Remote Sensing and Computational, Evolutionary, Supercomputing, and Intellige...
Remote Sensing and Computational, Evolutionary, Supercomputing, and Intellige...Remote Sensing and Computational, Evolutionary, Supercomputing, and Intellige...
Remote Sensing and Computational, Evolutionary, Supercomputing, and Intellige...
University of Maribor
 
Oedema_types_causes_pathophysiology.pptx
Oedema_types_causes_pathophysiology.pptxOedema_types_causes_pathophysiology.pptx
Oedema_types_causes_pathophysiology.pptx
muralinath2
 
原版制作(carleton毕业证书)卡尔顿大学毕业证硕士文凭原版一模一样
原版制作(carleton毕业证书)卡尔顿大学毕业证硕士文凭原版一模一样原版制作(carleton毕业证书)卡尔顿大学毕业证硕士文凭原版一模一样
原版制作(carleton毕业证书)卡尔顿大学毕业证硕士文凭原版一模一样
yqqaatn0
 
Deep Behavioral Phenotyping in Systems Neuroscience for Functional Atlasing a...
Deep Behavioral Phenotyping in Systems Neuroscience for Functional Atlasing a...Deep Behavioral Phenotyping in Systems Neuroscience for Functional Atlasing a...
Deep Behavioral Phenotyping in Systems Neuroscience for Functional Atlasing a...
Ana Luísa Pinho
 
The use of Nauplii and metanauplii artemia in aquaculture (brine shrimp).pptx
The use of Nauplii and metanauplii artemia in aquaculture (brine shrimp).pptxThe use of Nauplii and metanauplii artemia in aquaculture (brine shrimp).pptx
The use of Nauplii and metanauplii artemia in aquaculture (brine shrimp).pptx
MAGOTI ERNEST
 
Applied Science: Thermodynamics, Laws & Methodology.pdf
Applied Science: Thermodynamics, Laws & Methodology.pdfApplied Science: Thermodynamics, Laws & Methodology.pdf
Applied Science: Thermodynamics, Laws & Methodology.pdf
University of Hertfordshire
 
The binding of cosmological structures by massless topological defects
The binding of cosmological structures by massless topological defectsThe binding of cosmological structures by massless topological defects
The binding of cosmological structures by massless topological defects
Sérgio Sacani
 

Recently uploaded (20)

The debris of the ‘last major merger’ is dynamically young
The debris of the ‘last major merger’ is dynamically youngThe debris of the ‘last major merger’ is dynamically young
The debris of the ‘last major merger’ is dynamically young
 
Eukaryotic Transcription Presentation.pptx
Eukaryotic Transcription Presentation.pptxEukaryotic Transcription Presentation.pptx
Eukaryotic Transcription Presentation.pptx
 
aziz sancar nobel prize winner: from mardin to nobel
aziz sancar nobel prize winner: from mardin to nobelaziz sancar nobel prize winner: from mardin to nobel
aziz sancar nobel prize winner: from mardin to nobel
 
Thornton ESPP slides UK WW Network 4_6_24.pdf
Thornton ESPP slides UK WW Network 4_6_24.pdfThornton ESPP slides UK WW Network 4_6_24.pdf
Thornton ESPP slides UK WW Network 4_6_24.pdf
 
Comparing Evolved Extractive Text Summary Scores of Bidirectional Encoder Rep...
Comparing Evolved Extractive Text Summary Scores of Bidirectional Encoder Rep...Comparing Evolved Extractive Text Summary Scores of Bidirectional Encoder Rep...
Comparing Evolved Extractive Text Summary Scores of Bidirectional Encoder Rep...
 
如何办理(uvic毕业证书)维多利亚大学毕业证本科学位证书原版一模一样
如何办理(uvic毕业证书)维多利亚大学毕业证本科学位证书原版一模一样如何办理(uvic毕业证书)维多利亚大学毕业证本科学位证书原版一模一样
如何办理(uvic毕业证书)维多利亚大学毕业证本科学位证书原版一模一样
 
Nucleic Acid-its structural and functional complexity.
Nucleic Acid-its structural and functional complexity.Nucleic Acid-its structural and functional complexity.
Nucleic Acid-its structural and functional complexity.
 
ESR spectroscopy in liquid food and beverages.pptx
ESR spectroscopy in liquid food and beverages.pptxESR spectroscopy in liquid food and beverages.pptx
ESR spectroscopy in liquid food and beverages.pptx
 
SAR of Medicinal Chemistry 1st by dk.pdf
SAR of Medicinal Chemistry 1st by dk.pdfSAR of Medicinal Chemistry 1st by dk.pdf
SAR of Medicinal Chemistry 1st by dk.pdf
 
molar-distalization in orthodontics-seminar.pptx
molar-distalization in orthodontics-seminar.pptxmolar-distalization in orthodontics-seminar.pptx
molar-distalization in orthodontics-seminar.pptx
 
8.Isolation of pure cultures and preservation of cultures.pdf
8.Isolation of pure cultures and preservation of cultures.pdf8.Isolation of pure cultures and preservation of cultures.pdf
8.Isolation of pure cultures and preservation of cultures.pdf
 
Travis Hills' Endeavors in Minnesota: Fostering Environmental and Economic Pr...
Travis Hills' Endeavors in Minnesota: Fostering Environmental and Economic Pr...Travis Hills' Endeavors in Minnesota: Fostering Environmental and Economic Pr...
Travis Hills' Endeavors in Minnesota: Fostering Environmental and Economic Pr...
 
mô tả các thí nghiệm về đánh giá tác động dòng khí hóa sau đốt
mô tả các thí nghiệm về đánh giá tác động dòng khí hóa sau đốtmô tả các thí nghiệm về đánh giá tác động dòng khí hóa sau đốt
mô tả các thí nghiệm về đánh giá tác động dòng khí hóa sau đốt
 
Remote Sensing and Computational, Evolutionary, Supercomputing, and Intellige...
Remote Sensing and Computational, Evolutionary, Supercomputing, and Intellige...Remote Sensing and Computational, Evolutionary, Supercomputing, and Intellige...
Remote Sensing and Computational, Evolutionary, Supercomputing, and Intellige...
 
Oedema_types_causes_pathophysiology.pptx
Oedema_types_causes_pathophysiology.pptxOedema_types_causes_pathophysiology.pptx
Oedema_types_causes_pathophysiology.pptx
 
原版制作(carleton毕业证书)卡尔顿大学毕业证硕士文凭原版一模一样
原版制作(carleton毕业证书)卡尔顿大学毕业证硕士文凭原版一模一样原版制作(carleton毕业证书)卡尔顿大学毕业证硕士文凭原版一模一样
原版制作(carleton毕业证书)卡尔顿大学毕业证硕士文凭原版一模一样
 
Deep Behavioral Phenotyping in Systems Neuroscience for Functional Atlasing a...
Deep Behavioral Phenotyping in Systems Neuroscience for Functional Atlasing a...Deep Behavioral Phenotyping in Systems Neuroscience for Functional Atlasing a...
Deep Behavioral Phenotyping in Systems Neuroscience for Functional Atlasing a...
 
The use of Nauplii and metanauplii artemia in aquaculture (brine shrimp).pptx
The use of Nauplii and metanauplii artemia in aquaculture (brine shrimp).pptxThe use of Nauplii and metanauplii artemia in aquaculture (brine shrimp).pptx
The use of Nauplii and metanauplii artemia in aquaculture (brine shrimp).pptx
 
Applied Science: Thermodynamics, Laws & Methodology.pdf
Applied Science: Thermodynamics, Laws & Methodology.pdfApplied Science: Thermodynamics, Laws & Methodology.pdf
Applied Science: Thermodynamics, Laws & Methodology.pdf
 
The binding of cosmological structures by massless topological defects
The binding of cosmological structures by massless topological defectsThe binding of cosmological structures by massless topological defects
The binding of cosmological structures by massless topological defects
 

envi..green

  • 1. Climate Change: The Current State of Knowledge Secretariat Presentation of the WTO-UNEP Trade and Climate Change Report, WTO, Geneva, 16 February 2010
  • 2. Outline • Introduction: Greenhouse gases, climate change and climate change projections • Climate change impacts: Global, regional and sectoral dimensions • Approaches for dealing with climate change: Mitigation and adaptation: – Potential – Practices – Technologies – Costs • Concluding remarks
  • 3. Introduction “Warming of the climate system is unequivocal.” "Most of the observed increase in global average temperatures since the mid-20th century is very likely due to the observed increase in anthropogenic greenhouse gas concentrations.“ IPCC Fourth Assessment Report (2007)
  • 4. Climate versus weather • Climate: A statistical description of the mean and variability of temperature, precipitation, wind, etc. over a period of time ranging from months to thousands or millions of years • Weather: The present condition of the above elements, typically over periods up to two weeks • Climate change: A change in the state of the mean and/or variability of these elements that can be identified statistically and that persists over a longer period, typically decades or longer.
  • 5. Greenhouse gas (GHG) emissions and global warming • Sharp increase in the emissions of GHGs and their concentration in the earth’s atmosphere since the onset of industrialisation • GHGs cause heat from the sun to be retained in the atmosphere contributing to global warming and CC • Atmospheric concentration of CO2 increased by 36% over the past 250 years • More than 60% of this increase has taken place in the last 50 years
  • 6. Current contribution to global warming of major GHGs Carbon dioxide, mainly from burning of fossil fules and deforestation: 77% Methane, mainly from land-use and agriculture changes: 14% Nitrous oxide (agriculture), ozone (e.g. vehicles), and halocarbons and other industrial process gases: 9%
  • 7. ‘Translating’ emissions into warming • Predictions of future climate change and its likely impacts are based on projections of greenhouse gas emissions and climate model estimation of associated impacts • IPCC scenarios provided in the Special Report on Emission Scenarios (SRES) in 2000, present most frequently used baselines for climate change projections: – Four different ‘families’ of storylines provide a wide range of possible future emissions up to 2100 that can be used as baselines for climate modelling and economic analyses of climate change. – Each storyline and corresponding scenario has different assumptions about technologies and energy sources/use, rate of economic growth, governance structures, etc.
  • 8. ‘Translating’ emissions into warming Scenario Projections: • Increase in GHG emissions 25-90% for 2000-2030 • Warming: 0.2° C per decade up to 2020 • After 2020, temperature projections increasingly depend on the specific scenario Climate model estimates: • Global average temperature rise from 1.4 to 6.4° C between 1990 and 2100
  • 9. CC is a concentration problem as well as an emission problem • Many greenhouse gases remain in the atmosphere for very long periods • Time lag between the moment of emission and the new equilibrium of the climate system • World Bank (2008) estimate: Global warming of around 2°C is probably unavoidable by now • The corresponding best estimate from the IPCC (2007) is 1.8°C → Global warming will continue to affect the natural systems of the earth for several hundred years, even if greenhouse gas emissions were substantially reduced or ceased altogether today
  • 10. Increased certainty on the links between warming and impacts • Improved analyses of temperature records • Use of new computer models to estimate variability and climate system responses to both natural and man-made causes • Increased understanding of climate processes enabling incorporation of more detailed information: – Sea-ice dynamics – Ocean heat transport – Water vapour → Greater certainty that the links observed between warming and its impacts are reliable
  • 11. Global, regional, and sectoral dimensions Observed and projected climate change impacts
  • 12. Observed temperature changes • Global average temperatures and the rate of change have increased over the past 150 years : – The global average surface temperature increased by about 0.74°C between 1906 and 2005, – The warming trend per decade has been almost twice as high for the last 50 years compared to the trend for the past 100 years – From 1976 to 2007, the rate of temperature change was three times higher than the rate for the past 100 years • Measurements from weather balloons and satellites indicate that warming rates in the atmospheric temperature are similar to those observed in surface temperature
  • 13. Model projections of surface warming and regional differences
  • 14. Changes in precipitation Observed changes: • Significant increases: – Northern Europe – Northern and central Asia – Eastern parts of North and South America • Decreases: – Parts of southern Asia – The Mediterranean – The Sahel – Southern Africa Projected changes: • Substantial increases in annual mean precipitation: – Most high latitude regions – Eastern Africa – Central Asia • Substantial decreases: – The Mediterranean region – The Caribbean region – Sub-tropical regions
  • 15. Climate variability and extreme events • Frequency and intensity of extreme weather events are observed and are projected to increase even with small temperature increases • Heavy precipitation events projected to have potential negative impacts on trade through disruption to infrastructure and as a result of may not be limited to direct damage to agricultural outputs • Climate variability and extreme events exacerbate the general impacts of climate change in specific locations at specific points in time
  • 16. Sea level rise and changes in snow, ice and frozen ground • Sea level rise projections vary significantly depending on climate models and assumptions • Changes in sea ice may lead to availability of new shipping routes with significant implications for transport and exploitation of resources, including fossil fuels • Changes in permafrost and increasing ground instability has implications for transport, industry and infrastructure
  • 17. Examples of projected sectoral CC impacts
  • 18. Examples of projected regional CC impacts Africa Significant water shortages; lower agricultural production; hunger and malnutrition; increase in arid and semi-arid lands; sea-level rise affecting low lying coastal areas and populations Asia Decreased freshwater availability; flooding in heavily populated mega- deltas, etc.; endemic morbidity and mortality from increase in diarrhoeal diseases; additional pressure on environment and natural resources Australia and New Zealand Significant loss of biodiversity; water security problems; decreased agricultural and forestry production; ongoing coastal development not climate proofed Europe Inland flash floods; coastal flooding and erosion; glacier retreat; reduced snow cover with negative impacts on winter tourism; extensive species loss; severe impacts for Southern Europe (droughts, etc.) Latin America Decreases in crop and livestock productivity; changes to tropical forests and vegetation; increase in population at risk of hunger; changes in precipitation patterns and glacier melting posing severe problems North America Decreased snowpack in western mountains, winter flooding and reduced summer flows; first increased agricultural yields in some regions; challenges for crops close to temperature thresholds; heat waves
  • 19. Approaches for dealing with climate change: Mitigation and Adaptation Avoiding the unmanageable and Managing the unavoidable UNCSD 2007
  • 20. Mitigation: Avoiding the unmanageable • Mitigation is defined by the IPCC as technological change and substitution that reduce resource inputs and emissions per unit of output • Requires implementation of policies and measures to reduce greenhouse gas emissions and/or enhance carbon sinks
  • 21. Trends in GHG emissions • Global GHG emissions have increased by 100% from 1970s to 2005 • GHG emissions projected to increase another 80% by 2050 if there are no significant changes to current policies • CO2 emissions are the fastest growing and annual growth rates have increased from 1.1% in the 1990s to more than 3.0% in 2000-2004 → Current trends in GHG emissions indicate that we are heading towards the higher end of the IPCC scenarios
  • 22. Trends in the structure of GHG emissions • Industrialised countries bear main responsibility for past emissions and current atmospheric concentrations of GHGs • Emissions per capita in industrialized countries are around four times higher than those in developing countries’ • CO2 intensity of developing countries > industrialized country – Indicating a significant potential for efficiency gains • Annual energy-related carbon dioxide emissions from non- OECD countries now surpass emissions from OECD countries. • Total annual GHG emissions of industrialized countries and developing countries are now roughly the same • 8 out of the top 20 GHG emitting countries are DCs • Developing countries account for roughly 2/3 of the flow of new emissions • Average annual increase in emissions for 2005-2030 projected at 2.5% for non-OECD countries and 0.5% for OECD countries → Any effective response to climate change must include both industrialised and developing countries
  • 23. Global flow of GHG emissions by sector and end-use Activity Source: Baumert et al. (2005)
  • 24. Mitigation options and potential • Significant emission reductions requires exploiting mitigation potentials across all sectors - involving a broad range of technologies • Key options for mitigation include: – Using energy more efficiently to reduce the emissions from fossil fuel use – Switching to zero- or low-carbon energy technologies – Reducing deforestation – Introducing improved farming practices and waste treatment • Deployment of existing technologies and technologies currently under development would enable realisation even of ambitious emission targets
  • 25. Stabilisation targets and associated cost estimates Two stabilization targets widely discussed and analysed: • Limiting increases in temperature to 2°C (corresponding to a GHG concentration range of 445-490 parts per million) to avoid dangerous anthropogenic interference with the climate system – Advocated e.g. by the EU • Limiting increases in temperature to approximately 3°C, corresponding to a stabilisation of CO2 levels in the atmosphere at around twice the pre-industrial level – More extensively studied in science, and suggested by the IPCC as an upper threshold for avoiding dangerous human interference with the climate system
  • 26. Mitigation and cost implications of the two stabilisation targets • 2°C target: – Emissions reduction: 50-85% relative to 2000 level by 2050 – Macro-economic costs: annual reduction in global GDP of more than 3% (IPCC) • 3°C target: – Emissions reduction: 30% lover to 5% higher than emission levels in 2000 by 2050 – Macro-economic costs: annual reduction in global GDP of 0.2-2.5% (IPCC); 1% (Stern Review)
  • 27. Carbon prices • Carbon pricing: Equalising the marginal cost of CO2 emission reductions for all sources of emissions by introducing a price per tonne of CO2 -equivalent GHG emissions reduced • Enables comparison of emission reduction potentials for sectors and technologies at various carbon prices • Creates incentives to undertake research and development and to innovations in energy-saving and climate-friendly technologies
  • 28. Mitigation potentials by sector and as a function of carbon prices, I • Building sector: Largest potential for GHG emission reductions, much at low cost. Technologies include energy efficiency; improved cooking stoves; solar heating; and, efficient lighting and appliances. • Energy supply sector: High potential and increasing with carbon prices up to 50 USD. Technologies include: Improved supply and distribution efficiency; fuel- switching from coal to gas; nuclear power; renewable heat and power sources; combined heat and power; early applications of Carbon Capture and Storage • Industrial sector: High potential that increases with carbon prices. Technologies include efficient end-use equipment; heat and power recovery; material recycling and substitution; carbon Capture and Storage
  • 29. Mitigation potentials by sector and as a function of carbon prices, II • Agriculture and forestry: High potential at all levels of carbon prices. Available technologies include Improved crop, livestock, forest and land management and cultivation techniques; restoration of cultivated peaty soils and degraded lands; improved nitrogen fertilizer application techniques; dedicated energy crops to replace fossil fuel use; improved energy efficiency; afforestation; reduced deforestation • Transport and waste sector: GHG emission reduction potential not very responsive to carbon price increases. Technologies include fuel-efficient, hybrid and cleaner diesel vehicles; biofuels; shifts from road transport to rail and public transport systems; non- motorized transport; land use and transport planning.
  • 30. Global GHG abatement cost curve Source: McKinsey & Companys Global GHG Abatement Cost Curve v2.0
  • 31. Adaptation: Managing the unavoidable • Adaptation is defined by the IPCC as an “adjustment in natural or human systems in response to actual or expected climatic stimuli or their effects, which moderates harm or exploits beneficial opportunities.” • Effective options for adaptation depend on specific geographical and climate risk factors as well as on socio-economic, institutional, political and financial circumstances
  • 32. Typology of adaptation technologies • Hard technologies: tools, equipment, physical facilities, etc. • Soft technologies: management, behavioral changes, knowledge to use tools and machinery. • “Org-ware”: institutional framework or organisation required to implement the technology. • Sectors commonly used: freshwater resources, forests and ecosystems, agriculture, coastal systems, industry, and health
  • 33. Differences between adaptation and mitigation technologies • Climate adaptation is often the continuation of an ongoing process where the same techniques have been used for generations (e.g. houses on stilts) • Few technologies are specifically designed for adaptation, rather they respond to broader sustainable development needs (e.g. improved water quality) • Adaptation technologies are often less capital intensive, suitable to small-scale interventions and local variations and context • The effects/outcomes of adaptation cannot be measured by a single indicator (such as reduction in CO2-equivalent emissions), and are interlinked with broader development issues • Transfers of adaptation technologies does not necessarily follow a north-south approach of equipment and practices. Technologies may already be in place but face barriers to implementation and use
  • 34. Adaptation costs • Consensus that the costs of adaptation will generally be smaller than the benefits, and that climate change impacts and the associated need for adaptation will increase the cost of, and potential for, economic development in developing countries • Few adaptation cost and benefit estimates have been carried out to date, but more studies are becoming available, particularly for specific adaptation options at regional or project level • Global adaptation cost figures are limited and the assumptions about climate change impacts and adaptation activities and technologies underlying their derivation still coarse
  • 35. Estimates of global annual adaptation costs in developing countries New estimates from the World Bank (2010) indicates that annual costs are in the order of $100 billion annually
  • 36. Concluding remarks • Scientific evidence on climate change and its impacts is conclusive • Climate change is a concentration problem as well as an emission problem and both mitigation and adaptation is needed in an effective response • Any effective mitigation response strategy must include both industrialised and developing countries • Copenhagen…Good COP or Bad COP? – Never have so many heads of state given such priority to the issue – COP 15 moved climate change to the relevant level of political engagement: Issues go beyond environmental aspects and affect key economic development, trade and equity questions