Download as PDF, PPTX


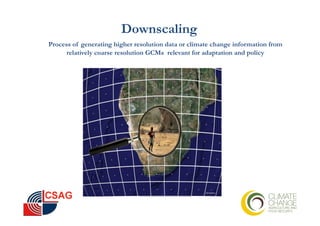

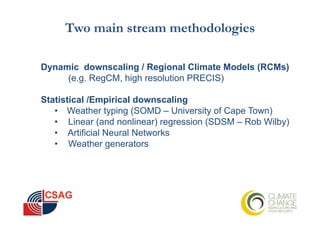


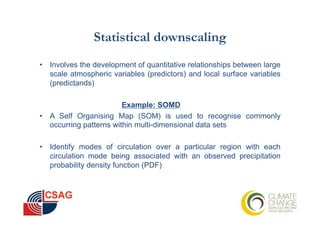


This document discusses downscaling of global climate model (GCM) data to provide higher resolution climate change projections relevant for adaptation planning. It describes two main downscaling methods: dynamic downscaling using regional climate models, and statistical/empirical downscaling using statistical relationships between large-scale predictors and local predictands. Both methods have pros and cons related to computational expense, dependence on GCM outputs, and ability to represent local weather phenomena. The document emphasizes that downscaled climate projections have uncertainties and limitations but provide the best available scientific information for decision-making around climate change impacts and adaptation.