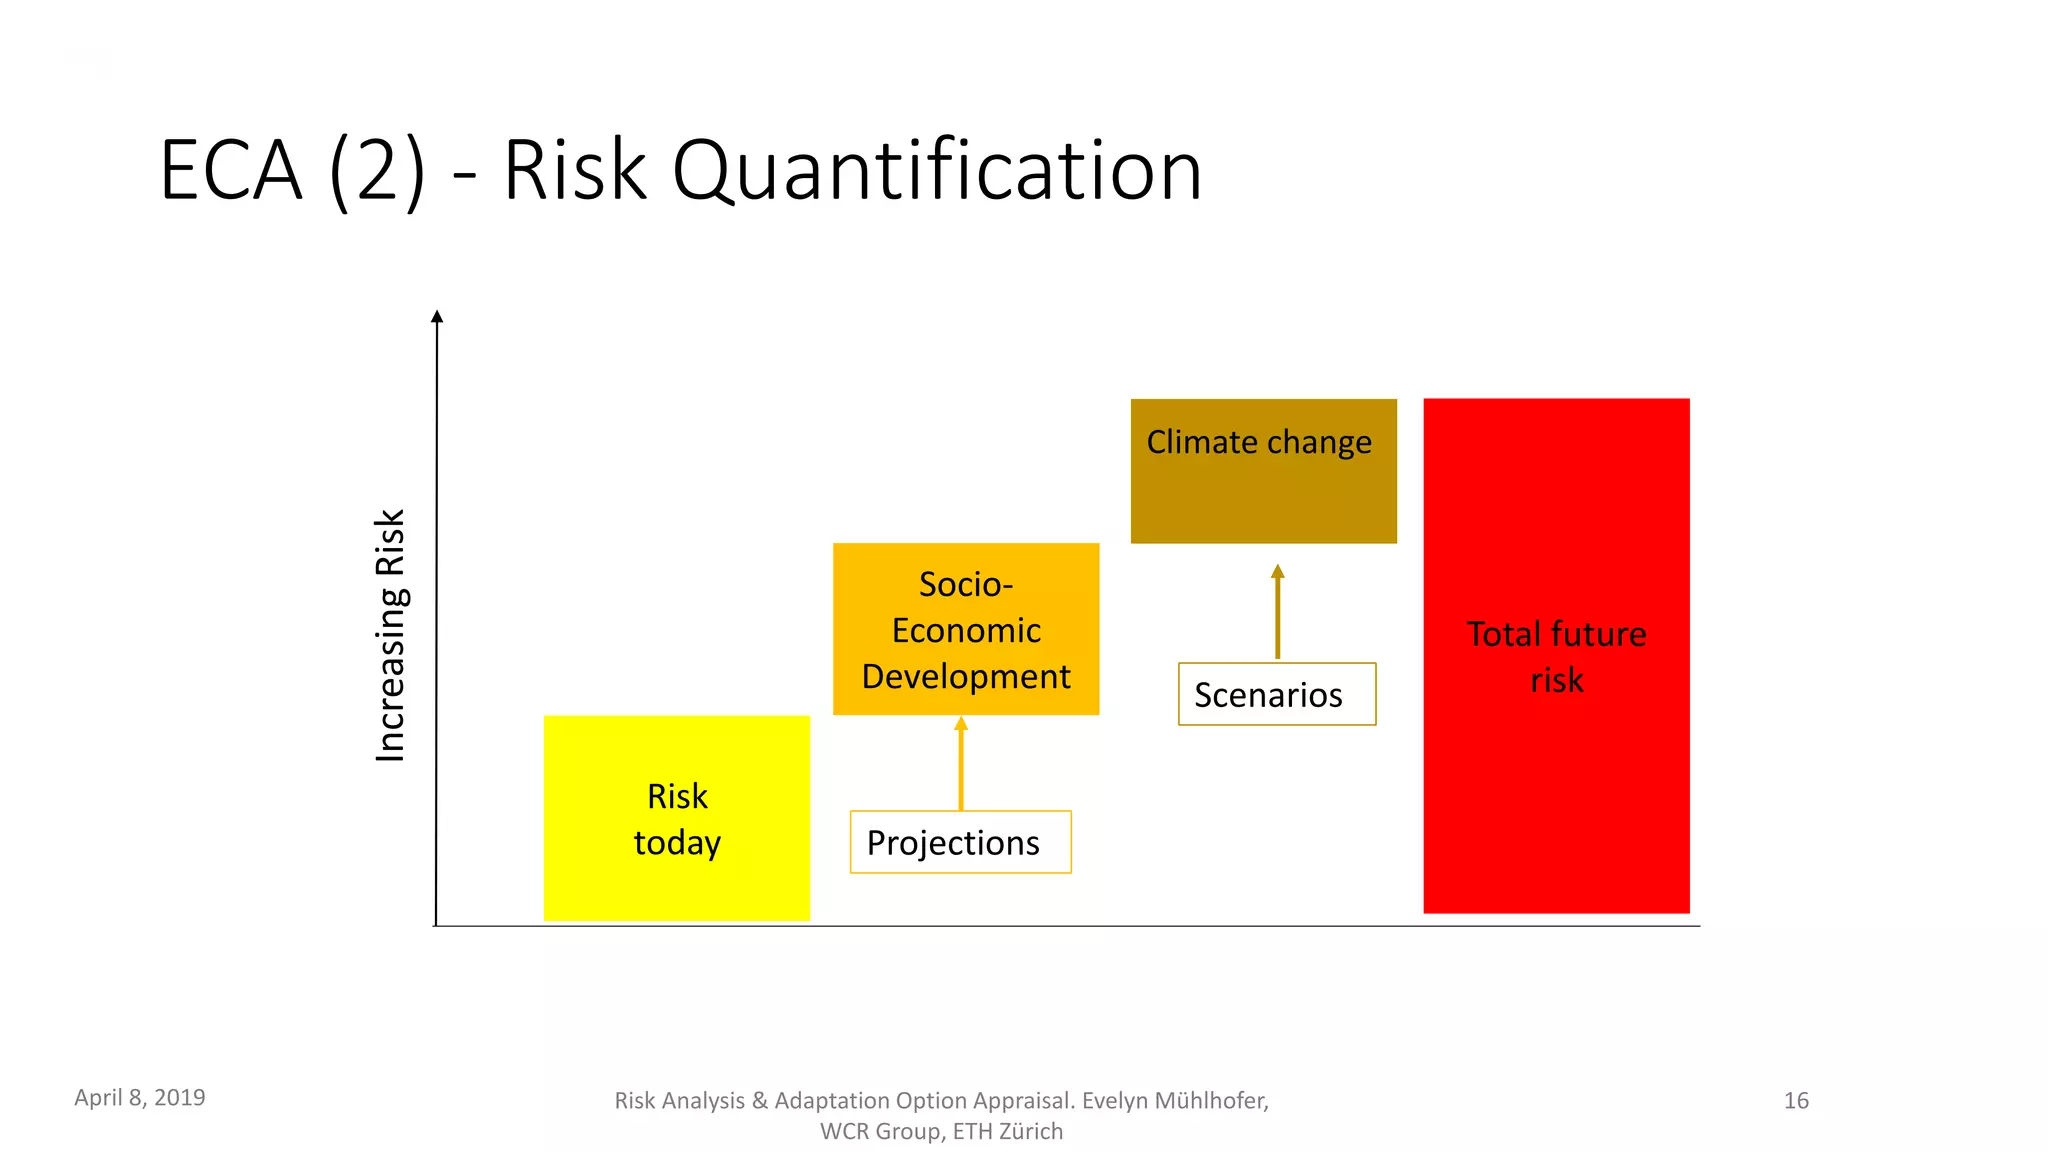
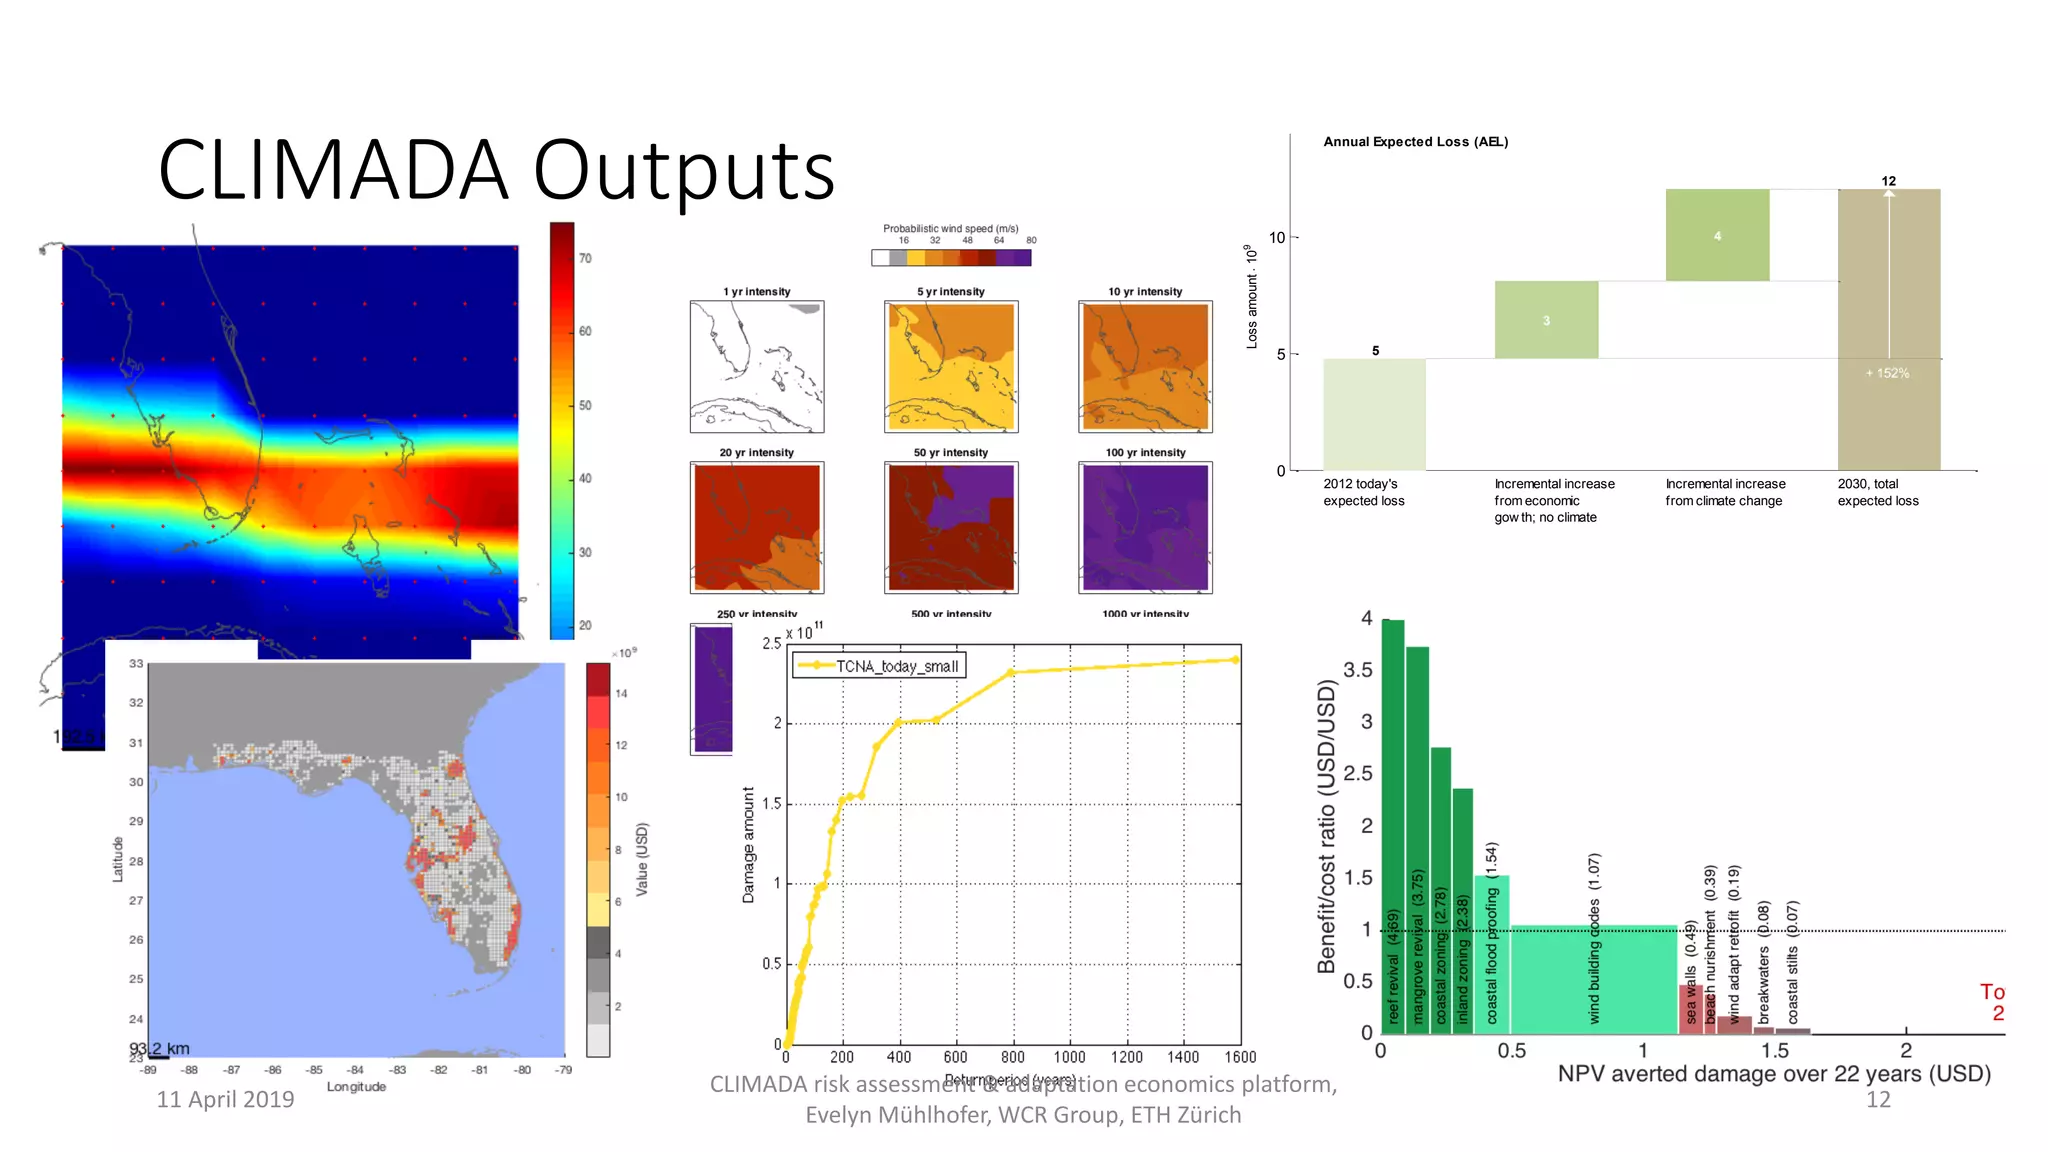
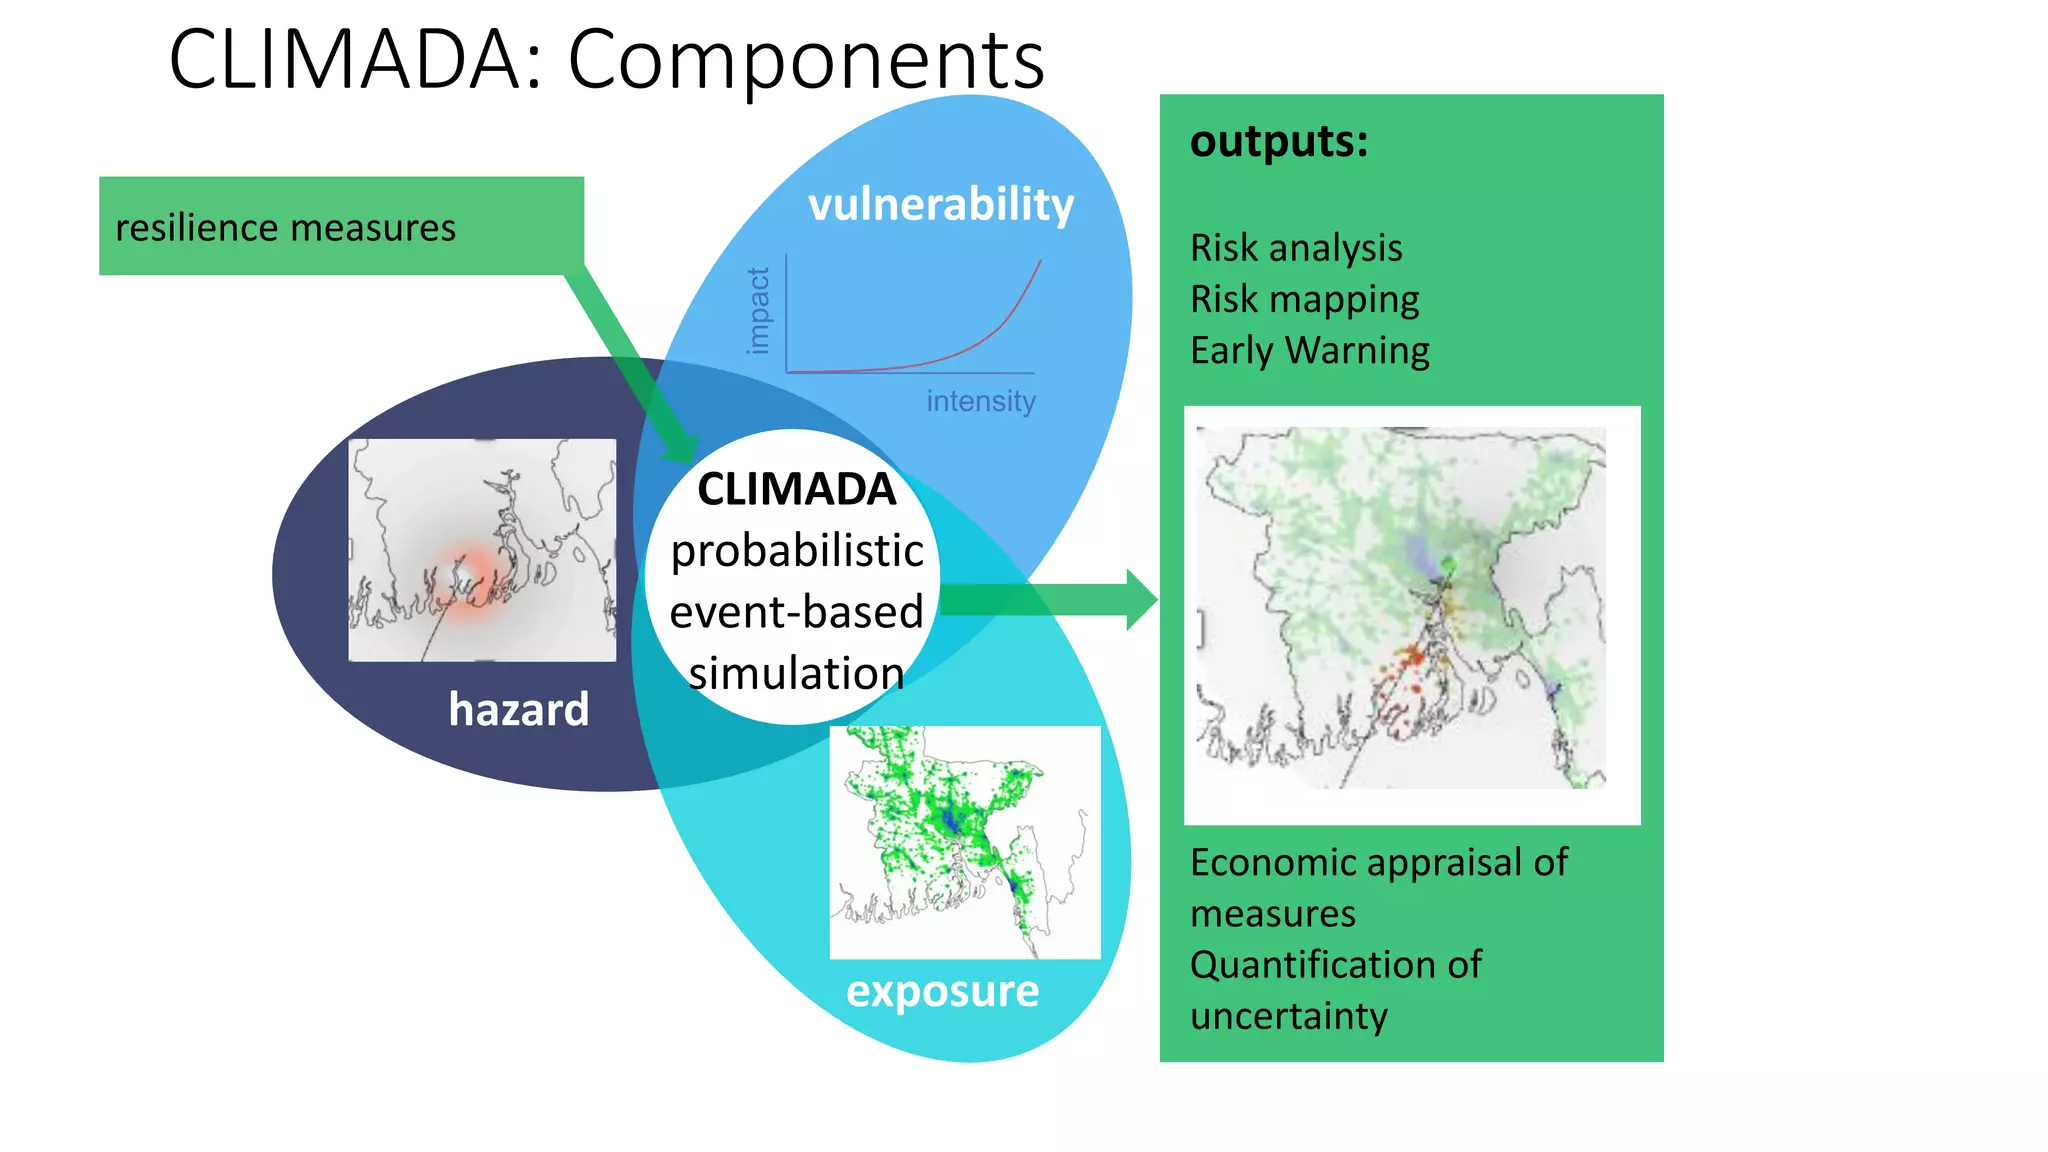
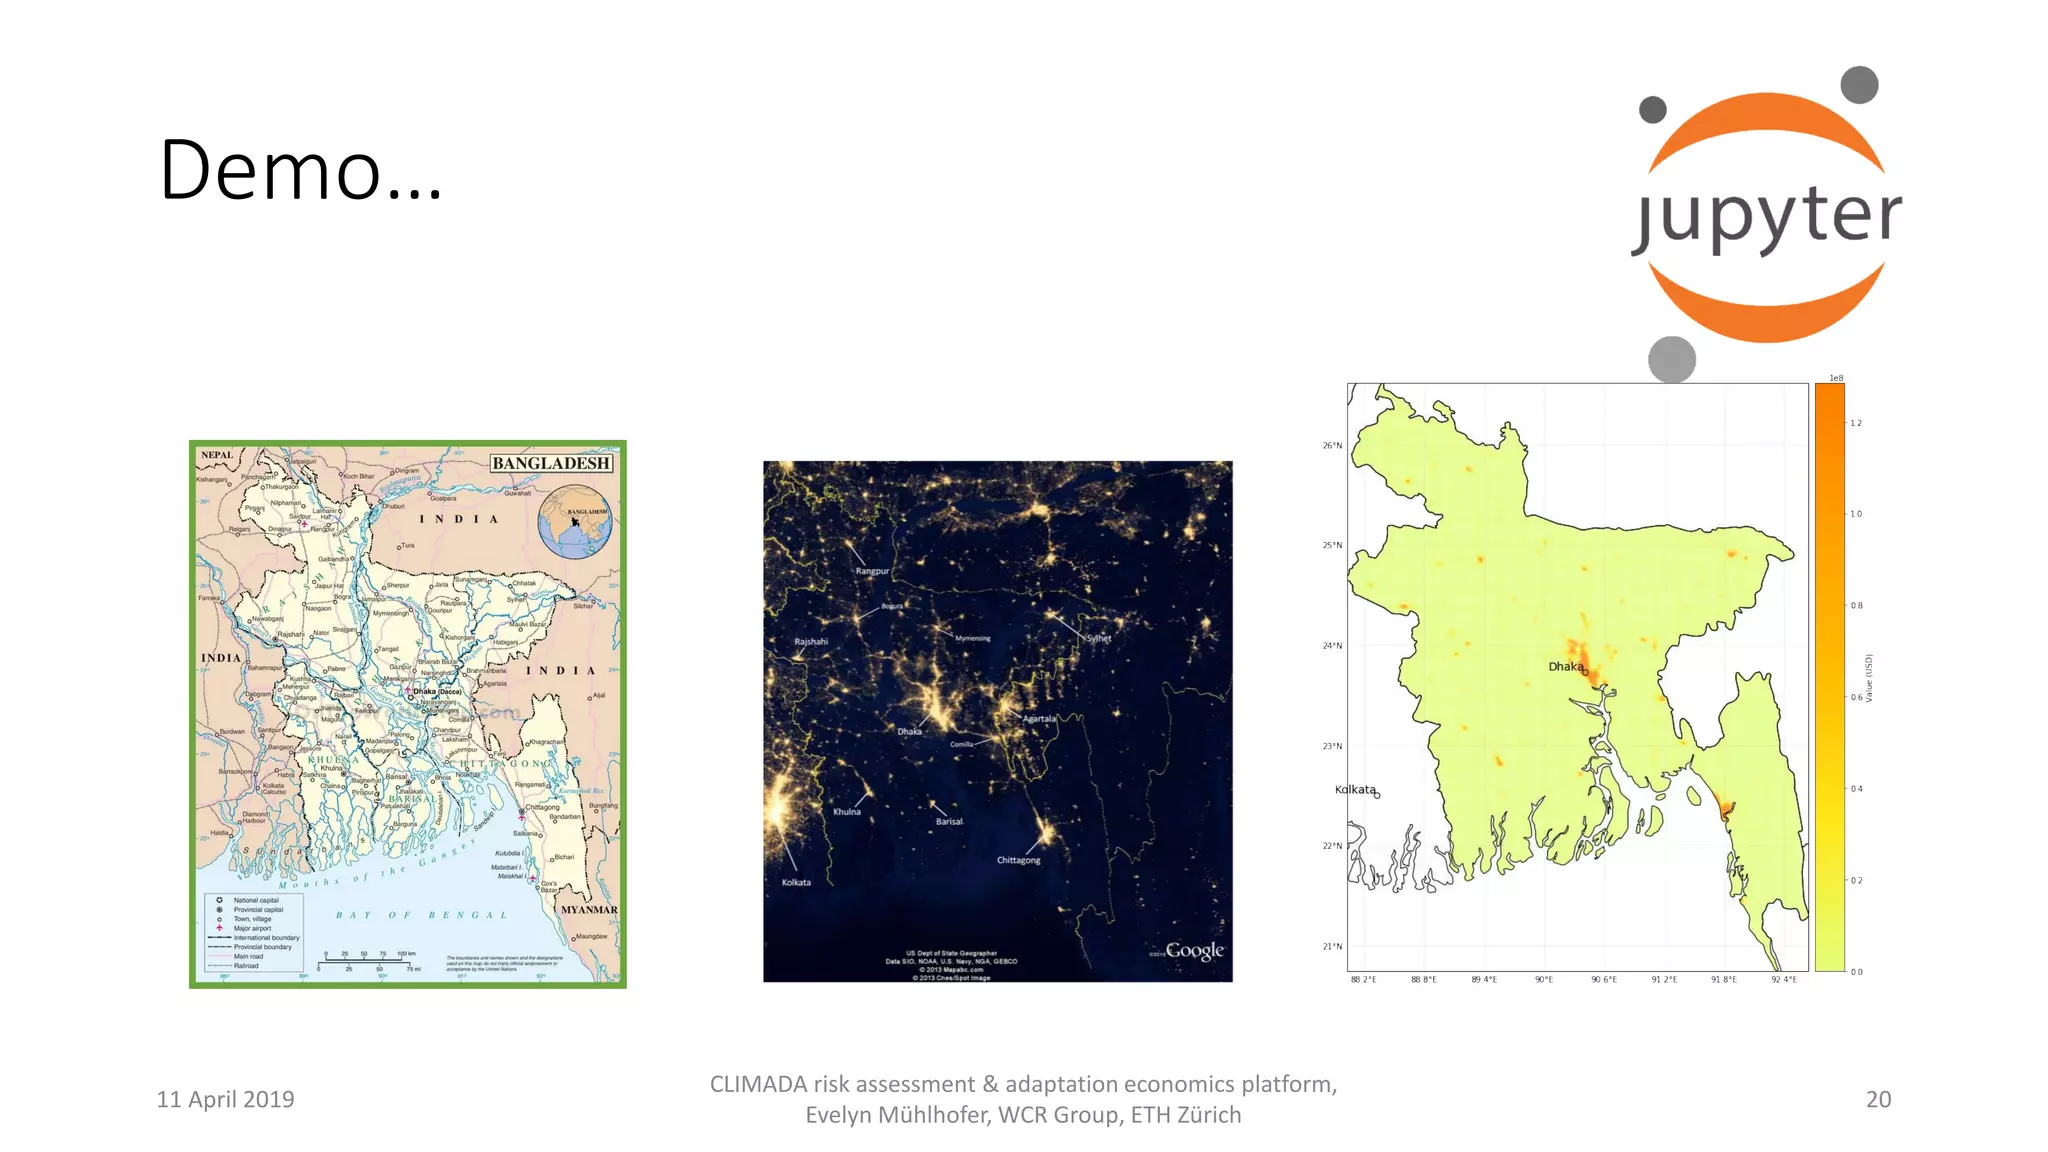
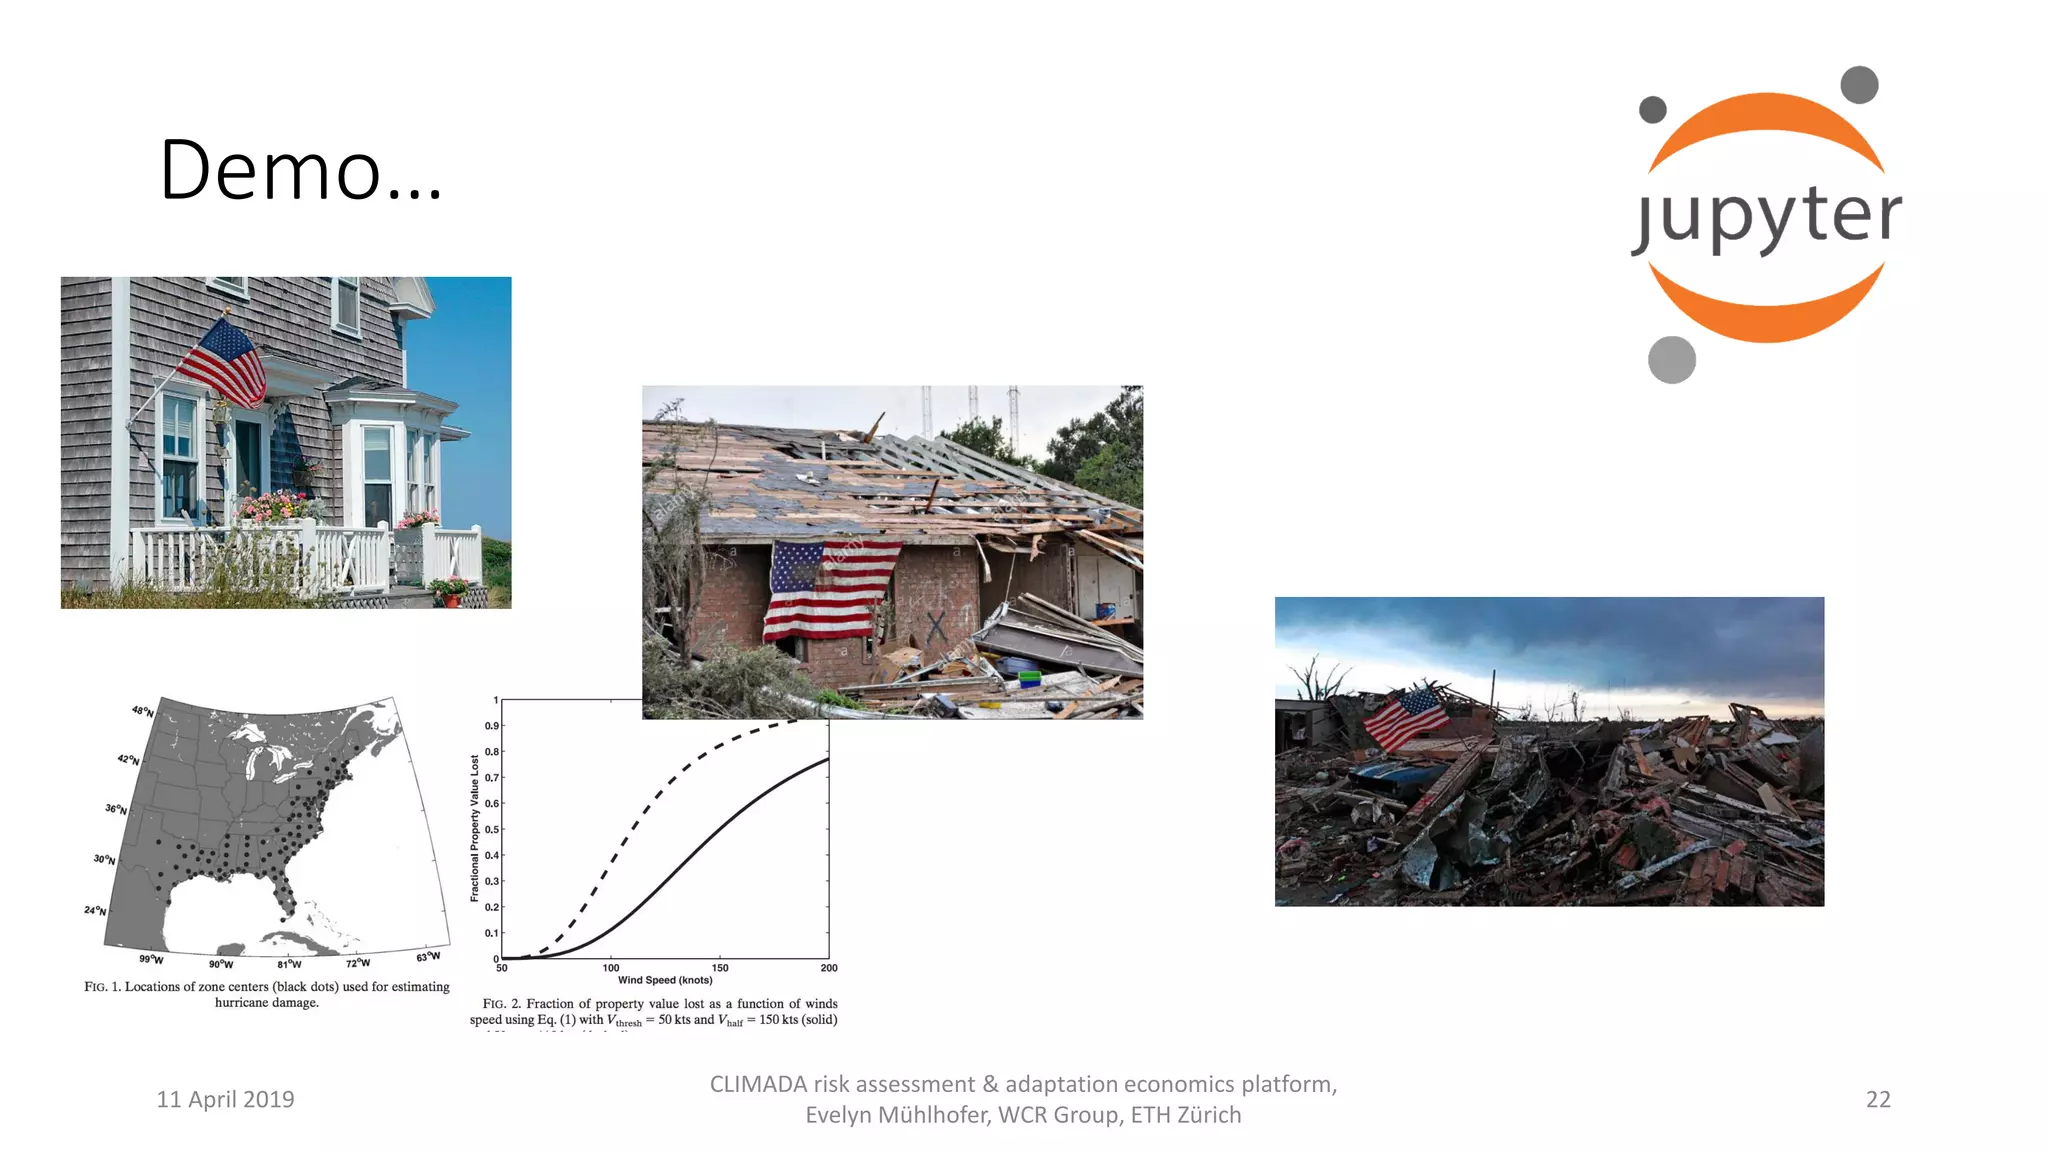
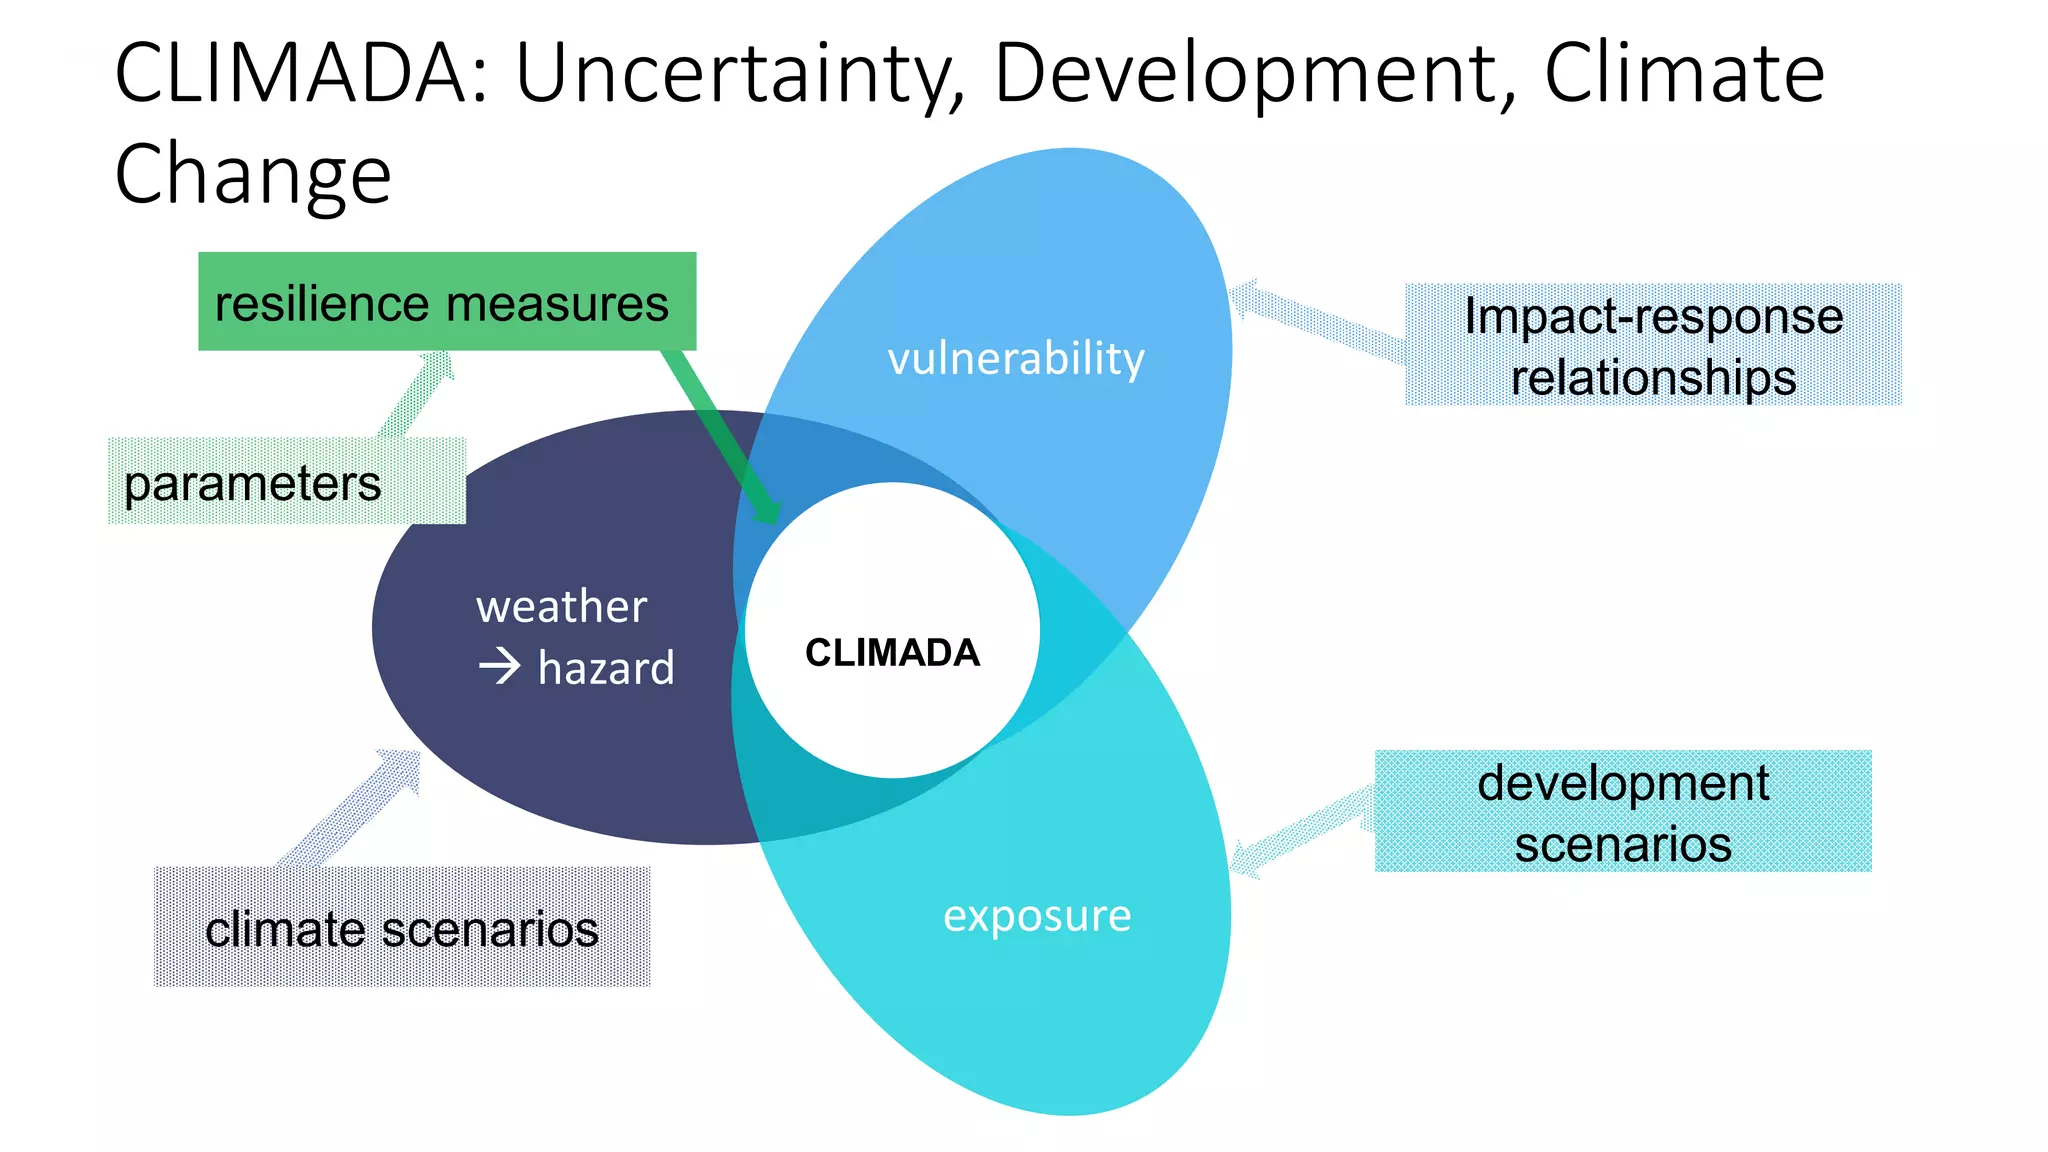
CLIMADA – an open-source and -access global
probabilistic risk modelling and
adaptation economics platform
NAP Expo: “Raising adaptation ambition by advancing National Adaptation Plans”
8 to 12 April 2019, Songdo, Republic of Korea
Evelyn Mühlhofer, Prof. Dr. David N. Bresch, Institute for Environmental Decisions, ETH Zurich/MeteoSwiss
www.wcr.ethz.ch, CLIMADA: https://github.com/davidnbresch/climada_python
Guyana: Flash flood
risk to a developing
urban area
Tanzan
ia
Tanzania: Drought
risk to health and
power generation
Samoa: Risk of sea level
rise to a small island
state
Florida: Hurricane risk to
public and private assets
Mali: Risk of climate
zone shift to agriculture
India: Drought risk to
agriculture
US Gulf Coast:
Hurricane risk to the
energy system
New York: Cyclones
and surge risk to a
metropolis
Hull, UK: Flood and
storm risk to urban
property
China: Drought risk
to agriculture
El Salvador: Flood
and landslide risk to
vulnerable people
Bangladesh: Flood risk
to a fast-developing city
Caribbean: Hurricane
risk to small islands
8x
THE WORLD BANK
>20 adaptation case studies worldwide
Overview
11 April 2019
CLIMADA risk assessment & adaptation economics platform,
Evelyn Mühlhofer, WCR Group, ETH Zürich
2
• Introduction
• Economics of Climate Adaptation
• Risk
• CLIMADA
• Outputs
• Core Components
• Input
• Hands-on demonstrations in Python: Example of Tropical Cyclone Risk in
Bangladesh
• Discussion
11 April 2019
CLIMADA risk assessment & adaptation economics platform,
Evelyn Mühlhofer, WCR Group, ETH Zürich
3
Introduction
11 April 2019
CLIMADA risk assessment & adaptation economics platform,
Evelyn Mühlhofer, WCR Group, ETH Zürich
4
“Provide decision makers on local to national scales with the facts and methods necessary to design and execute
an adaptation strategy to natural hazards in a changing climate, in a robust and replicable way”
Rigorous risk management approach to
(1) identify and …
(2) assess (quantify) risk today, additional risk due to socio-economic development and climate change
(3) Propose, appraise and prioritize a basket of adaptation measures to address weather and
climate risk on an economic basis (e.g. cost-benefit metric)
Supported by the open-source & -access CLIMADA simulation platform
https://github.com/CLIMADA-project/climada_python
Guidebook for Practitioners & Methodology:
www.kfw-entwicklungsbank.de/PDF/Download-Center/Materialien/2016_No6_Guidebook_Economics-of-Climate-Adaptation_EN.pdf
https://www.ethz.ch/content/dam/ethz/special-interest/usys/ied/wcr-dam/documents/Economics_of_Climate_Adaptation_ECA.pdf
Economics of Climate Adaptation (ECA)
ECA (2) - Risk Quantification
Risk
today
Total future
risk
Socio-
Economic
Development
Projections
Climate change
Scenarios
IncreasingRisk
April 8, 2019 Risk Analysis & Adaptation Option Appraisal. Evelyn Mühlhofer,
WCR Group, ETH Zürich
16
Climate change
ECA (2) - Risk Quantification
risk = hazard x
exposure x
vulnerability
(= probability x intensity)
General finding1:
40-60% of risk can be cost-effectively avoided up to 2030Total future
risk
Climate
adaptation
Residual
risk
• General finding: 40-60%
of risk can be cost-
effectively avoided up to
2030
• Further reduction only at
(excessively) high costs or
not at all
ECA (3) Economic Appraisal of Options
Reduced
Damage
ECA (3) - Economic Appraisal of Options
benefit/costratio(US$/US$)
Cumulated number of lives saved over timespan X
Climate
adaptation
Residual
risk
Reduced
Damage
Reduced
Damage
11 April 2019
CLIMADA risk assessment & adaptation economics platform,
Evelyn Mühlhofer, WCR Group, ETH Zürich
9
1. Problem definition, Goal
7. Implementation
6. Decision (?)
NO
NO
Criteria
met?
Problem
defined
correctly?
2. Decision criteria
3. Risk analysis
4. Identify options
Simulation
platform
8. Monitoring
5. Options appraisal
see e.g : Souvignet, Wieneke, Müller & Bresch, 2016: Economics of Climate Adaptation (ECA) - Guidebook for Practitioners. Materials on Development Financing, UNU, KfW.
https://www.kfw-entwicklungsbank.de/PDF/Download-Center/Materialien/2016_No6_Guidebook_Economics-of-Climate-Adaptation_EN.pdf Figure based upon IPCC und UKCIP
Decision Cycle, ECA and CLIMADA
CLIMADA
11 April 2019
CLIMADA risk assessment & adaptation economics platform,
Evelyn Mühlhofer, WCR Group, ETH Zürich
11
CLIMADA Outputs
0
5
10
15
5
3
4
12
Lossamount109
+ 152%
Annual Expected Loss (AEL)
2012 today's
expected loss
Incremental increase
from economic
gow th; no climate
change
Incremental increase
from climate change
2030, total
expected loss
USFL MiamiDadeBrow ardPalmBeach2012  TCNA hazard event set 2012
USFL MiamiDadeBrow ardPalmBeach2030  TCNA hazard event set 2012
USFL MiamiDadeBrow ardPalmBeach2030  climate change scenario based on TCNA hazard event set 2012
11 April 2019
CLIMADA risk assessment & adaptation economics platform,
Evelyn Mühlhofer, WCR Group, ETH Zürich
12
Screen Shot 2019-03-28 at 14.50.27
impact
intensity
CLIMADA
probabilistic
event-based
simulation
vulnerability
exposure
hazard
resilience measures
outputs:
Risk analysis
Risk mapping
Early Warning
Economic appraisal of
measures
Quantification of
uncertainty
CLIMADA: Components
CLIMADA: Open Access & Open Source
https://github.com/CLIMADA-project/climada_python and
https://climada-python.readthedocs.io/en/latest/install.html
11 April 2019
CLIMADA risk assessment & adaptation economics platform,
Evelyn Mühlhofer, WCR Group, ETH Zürich
14
Demo…
11 April 2019
CLIMADA risk assessment & adaptation economics platform,
Evelyn Mühlhofer, WCR Group, ETH Zürich
15
Exposures
Disc
Rates
Impact
Funcs
Measures
Hazard
excel
mat
pkl
CLIMADA: Workflow
11 April 2019
CLIMADA risk assessment & adaptation economics platform,
Evelyn Mühlhofer, WCR Group, ETH Zürich
16
CLIMADA: Hazard
Hazard Type Coverage Resolution
Tropical Cyclone global 10x10km and 1x1 km
European winter storms Europe 10x10km
Earthquake and Volcano global 10x10km and 1x1 km
Wildfire global 10x10km and 1x1 km
Flood (Rivers) global 1x1 km
Landslides global 1x1 km
Droughts global 10x10km and 1x1 km
Format: for each geo-coded point  frequency, intensity & time of event
Data sources: modular, default provides global open-source data
11 April 2019
CLIMADA risk assessment & adaptation economics platform,
Evelyn Mühlhofer, WCR Group, ETH Zürich
17
Demo…
11 April 2019
CLIMADA risk assessment & adaptation economics platform,
Evelyn Mühlhofer, WCR Group, ETH Zürich
18
2007 Super Clyclonic Storm SIDR
Damage: $1.7 billion (2007 USD)
Fatalities: 3,447–15,000
Highest 3-min sustained wind speed: 215 km/h
CLIMADA: Exposure
• LitPop
• night light intensities and gridded population count
• 1kmx1km
• BlackMarble
• night light intensities for a specific year
• 1kmx1km resolution
• Monetary asset values (non-financial wealth, GDP, ..)
• Population
11 April 2019
CLIMADA risk assessment & adaptation economics platform,
Evelyn Mühlhofer, WCR Group, ETH Zürich
19
Demo…
11 April 2019
CLIMADA risk assessment & adaptation economics platform,
Evelyn Mühlhofer, WCR Group, ETH Zürich
20
CLIMADA: Vulnerability
• Intensity-Impact relationship
• “Impact Functions”
11 April 2019
CLIMADA risk assessment & adaptation economics platform,
Evelyn Mühlhofer, WCR Group, ETH Zürich
21
Demo…
11 April 2019
CLIMADA risk assessment & adaptation economics platform,
Evelyn Mühlhofer, WCR Group, ETH Zürich
22
CLIMADA: Risk Quantification (I)
• “Risk” ~ “Impact” ~ “Expected Damage”
• Combination of all three elements – Exposure, Hazard, Vulnerability
• per year or per specified time frame, damage exceedance curve
11 April 2019
CLIMADA risk assessment & adaptation economics platform,
Evelyn Mühlhofer, WCR Group, ETH Zürich
23
Demo…
11 April 2019
CLIMADA risk assessment & adaptation economics platform,
Evelyn Mühlhofer, WCR Group, ETH Zürich
24
Expected Annual Damage today: (exemplary!) 6.887e+08 USD
CLIMADA: Risk Quantification (II)
• Total Future Risk =
• Risk today
• + Risk from socio-economic development
• + Risk from climate change
• From Today‘s to Future Risk
• Same procedure as before: Hazard, Exposure, Vulnerability
• Modifications:
• Change Exposure (population / asset values)
• Change Hazard Set (frequency / intensity)
11 April 2019
CLIMADA risk assessment & adaptation economics platform,
Evelyn Mühlhofer, WCR Group, ETH Zürich
25
CLIMADA: Adaptation Measure
Parametrization
• Modifies Hazard
• Frequency
• Intensity
• Modifies Impact Function
• Shift
• Reduction
• Cut-off
11 April 2019
CLIMADA risk assessment & adaptation economics platform,
Evelyn Mühlhofer, WCR Group, ETH Zürich
26
CLIMADA: Adaptation Measure
Parametrization - Example
• Building Code in Miami, FL:
• Houses must be built to withstand wind intensities up to 140 mph
(62.5 m/s)
• Targets Impact function: Cut-off
11 April 2019
CLIMADA risk assessment & adaptation economics platform,
Evelyn Mühlhofer, WCR Group, ETH Zürich
27
Demo…
11 April 2019
CLIMADA risk assessment & adaptation economics platform,
Evelyn Mühlhofer, WCR Group, ETH Zürich
28
CLIMADA: Adaptation Measure Appraisal
• Same procedure as before: Hazard, Exposure, Vulnerability
• Comparison of damage: total risk before & after modifications
• Weighting against implementation costs
 Cost-Benefit metrics
11 April 2019
CLIMADA risk assessment & adaptation economics platform,
Evelyn Mühlhofer, WCR Group, ETH Zürich
29
Uncertainty, Development, Climate Change
11 April 2019
CLIMADA risk assessment & adaptation economics platform,
Evelyn Mühlhofer, WCR Group, ETH Zürich
30
CLIMADA
vulnerability
exposure
weather
 hazard
development
scenarios
climate scenarios
Impact-response
relationships
CLIMADA: Uncertainty, Development, Climate
Change
resilience measures
parameters
Discussion
11 April 2019
CLIMADA risk assessment & adaptation economics platform,
Evelyn Mühlhofer, WCR Group, ETH Zürich
32
• Questions?
• Utility?
• Expertise?
• Input & Output data?
• Alternatives?
• Experience?
11 April 2019
CLIMADA risk assessment & adaptation economics platform,
Evelyn Mühlhofer, WCR Group, ETH Zürich
33
Back-up
11 April 2019
CLIMADA risk assessment & adaptation economics platform,
Evelyn Mühlhofer, WCR Group, ETH Zürich
34
Risk assessment (2)
Cost-benefit analysis (3)
Roadmap
Aligning risk appetite with development priorities
Incorporating further criteria to cost-benefit ratio
(Re-)prioritizing risk reduction and transfer measures
Integrating into NAP and related planning documents
Develop a roadmap including priority initiatives
Using this roadmap and business case for funding discussions
Speed-up implementation with additional funding; strengthen resilience
The Business Case for Adaptation (2) + (3)
Risk
today
Socio-
Economic
Developm
ent
Total
future
risk
Climate
change
CLIMADA
Architecture
in Python
Note:
Illustrative
purpose; does
not correspond
to the most up-
to-date
architecture in
detail
Note on inputs – the user defines it all!
▪ Links to many databases, easiest interface via Excel
▪ Expects data to be geo-encoded
▪ Garbage in – garbage out, i.e. climada supports data cleaning, but does not do it on its own ;-)
 All documented in https://github.com/davidnbresch/climada/blob/master/docs/climada_manual.pdf
CLIMADA
CLIMADA
Architecture
in Python
What skills & data are required?
Level of skills needed by field
of expertise
From: Materials on
Development Financing:
Economics of Climate
Adaptation (ECA) -
Guidebook for Practitioners,
KfW Development Bank
April 8, 2019
Risk Analysis & Adaptation Option Appraisal. Evelyn Mühlhofer,
WCR Group, ETH Zürich
39
Development
Tools
• libraries (python 3.6):
• numpy
• scipy
• matplotlib, cartopy
• xarray
• pandas
• scikit-learn
• h5py, netcdf4
• pathos
• Pint
• ...
11 April 2019
CLIMADA risk assessment & adaptation economics platform,
Evelyn Mühlhofer, WCR Group, ETH Zürich
40
Deployment
• package manager: pip, conda
• virtual environment: conda, virtualenv, pipenv
• packaging: setuptools
• version control:
• GitHub
• fork to GitLab at MeteoSwiss
• coding rules:
• pylint
11 April 2019
CLIMADA risk assessment & adaptation economics platform,
Evelyn Mühlhofer, WCR Group, ETH Zürich
41
Tutorials / Manual
• In Jupyter Notebook currently available:
• Hazard (1x general / 1x Tropical Cylcones)
• Exposure (1x general / 1x LitPop /1x BlackMarble)
• Impact Functions
• Manual in written text form
• KfW ECA Guidebook
11 April 2019
CLIMADA risk assessment & adaptation economics platform,
Evelyn Mühlhofer, WCR Group, ETH Zürich
42
Useful Data SourcesWe do mention key sources in the respective climada modules, but some data we came across is worth mentioning in more general terms.
• http://www.naturalearthdata.com and directly http://www.naturalearthdata.com/downloads: global shape files (see e.g. climada_shaperead and the
module country_risk). One will likely need the MATLAB mapping toolbox to ease working with these files. Could be used to either improve hazard sets
(e.g. using location of reefs in surge model…) or assets.
• http://download.geofabrik.de: highly detailed shape files for most countries (e.g. more than 1.5 mio shapes of building’s outlines in Switzerland).
Could be used in conjunction with climada module country_risk to further refine the asset base. See also http://www.openstreetmap.org/about,
https://mapzen.com and http://planet.openstreetmap.org
• Also www.diva-gis.org/gdata and www.diva-gis.org/Data for GIS data almost any country and also www.eea.europa.eu/data-and-maps/data/urban-
atlas
• GIS data for Seychelles https://www.webgis.gov.sc/map_default.phtml
• SRTM elevation data (3-arc seconds resolution ~90m) http://srtm.csi.cgiar.org/SELECTION/inputCoord.asp and generally http://srtm.csi.cgiar.org
• Hydrosheds, based on SRTM, manipulated for river routing http://hydrosheds.cr.usgs.gov/index.php
• http://www.geoportal.org/web/guest/geo_home_stp
• https://www.drought.gov/drought/content/products-current-drought-and-monitoring-drought-indicators/palmer-drought-severity-index
• http://beta.sedac.ciesin.columbia.edu/data/collection/gpw-v4/sets/browse population density, water bodies, admin center points with population
estimates (http://beta.sedac.ciesin.columbia.edu/data/set/gpw-v4-admin-unit-center-points-population-estimates)
• https://search.earthdata.nasa.gov earth data search
• https://datahub.io/ open data sets of various kinds
• http://databank.worldbank.org/data/home.aspx macroeconomic data
• http://databank.worldbank.org/data/reports.aspx?source=subnational-population sub-national population (admin1)
• http://www.trademap.org/Index.aspx trade statistics
11 April 2019
CLIMADA risk assessment & adaptation economics platform,
Evelyn Mühlhofer, WCR Group, ETH Zürich
43
• http://www.cger.nies.go.jp/gcp/population-and-gdp.html population and GDP
• http://data.footprintnetwork.org global country-level data on footprint etc.
• https://hazards.fema.gov/femaportal/wps/portal/NFHLWMSkmzdownload FEMA, US
• http://www.nws.noaa.gov/gis/shapepage.htm NOAA shape files (mainly US)
• http://www.mapcruzin.com/free-netherlands-arcgis-maps-shapefiles.htm NLD shape files, http://www.mapcruzin.com/do-it-
yourself-gis-maps-shapefiles/ mainly US and http://www.mapcruzin.com/free-world-country-arcgis-maps-shapefiles.htm global
• http://floodobservatory.colorado.edu floods
• https://freegisdata.rtwilson.com good global overview of free GIS data
• https://www.census.gov/geo/maps-data/data/cbf/cbf_msa.html US census
• https://data.oecd.org/gdp/real-gdp-forecast.htm OECD GDP past and future
• http://colorbrewer2.org good color scales to print well etc.
• http://www.reefbase.org global coral reef data, good preview via http://www.reefbase.org/gis_maps/default.aspx
• http://datadryad.org/resource/doi:10.5061/dryad.dk1j0 Gridded global datasets for GDP and Human Development Index over
1990-2015
• http://maps.elie.ucl.ac.be/CCI/viewer/ land cover map, resolution 10arcsec (300m)
• http://www.globallandcover.com/GLC30Download/index.aspx 30m land cover map
• See also e.g. http://data.geocomm.com/catalog
• https://pmm.nasa.gov/applications/global-landslide-model landslide model/map
• http://ghsl.jrc.ec.europa.eu/data.php global human settlement layer
• Models
• http://www.hrc-lab.org Hydrologic Research Center, (local) flood model
11 April 2019
CLIMADA risk assessment & adaptation economics platform,
Evelyn Mühlhofer, WCR Group, ETH Zürich
44
Contact
Prof. Dr. David N. Bresch
Head of the Weather and Climate Risks Group
dbresch@ethz.ch
Dr. Grabiela Aznar Siguan
Senior Researcher, Implementation of CLIMADA Python
gabriela.aznar@usys.ethz.ch
Evelyn Mühlhofer
Research Associate
evelyn.muehlhofer@usys.ethz.ch
11 April 2019
CLIMADA risk assessment & adaptation economics platform,
Evelyn Mühlhofer, WCR Group, ETH Zürich
45
References
Images
p. 18 Wikipedia
p. 20 Maps of Bangladesh Blogspot (http://maps-of-bangladesh.blogspot.com/ ) ; World-Map
(http://ontheworldmap.com/bangladesh/large-detailed-map-of-bangladesh-with-cities.html )
p. 22 Getty Images; K. Emanuel (2011) Global Warming Effects on U.S. Hurricane Damage.
p. 27 SEVENTH INTERNATIONAL WORKSHOP ON TROPICAL CYCLONES
(https://www.wmo.int/pages/prog/arep/wwrp/tmr/otherfileformats/documents/4_2.pdf )
11 April 2019
CLIMADA risk assessment & adaptation economics platform,
Evelyn Mühlhofer, WCR Group, ETH Zürich
46

6.3.1 CLIMADA model demo

  • 1.
    CLIMADA – anopen-source and -access global probabilistic risk modelling and adaptation economics platform NAP Expo: “Raising adaptation ambition by advancing National Adaptation Plans” 8 to 12 April 2019, Songdo, Republic of Korea Evelyn Mühlhofer, Prof. Dr. David N. Bresch, Institute for Environmental Decisions, ETH Zurich/MeteoSwiss www.wcr.ethz.ch, CLIMADA: https://github.com/davidnbresch/climada_python
  • 2.
    Guyana: Flash flood riskto a developing urban area Tanzan ia Tanzania: Drought risk to health and power generation Samoa: Risk of sea level rise to a small island state Florida: Hurricane risk to public and private assets Mali: Risk of climate zone shift to agriculture India: Drought risk to agriculture US Gulf Coast: Hurricane risk to the energy system New York: Cyclones and surge risk to a metropolis Hull, UK: Flood and storm risk to urban property China: Drought risk to agriculture El Salvador: Flood and landslide risk to vulnerable people Bangladesh: Flood risk to a fast-developing city Caribbean: Hurricane risk to small islands 8x THE WORLD BANK >20 adaptation case studies worldwide
  • 3.
    Overview 11 April 2019 CLIMADArisk assessment & adaptation economics platform, Evelyn Mühlhofer, WCR Group, ETH Zürich 2
  • 4.
    • Introduction • Economicsof Climate Adaptation • Risk • CLIMADA • Outputs • Core Components • Input • Hands-on demonstrations in Python: Example of Tropical Cyclone Risk in Bangladesh • Discussion 11 April 2019 CLIMADA risk assessment & adaptation economics platform, Evelyn Mühlhofer, WCR Group, ETH Zürich 3
  • 5.
    Introduction 11 April 2019 CLIMADArisk assessment & adaptation economics platform, Evelyn Mühlhofer, WCR Group, ETH Zürich 4
  • 6.
    “Provide decision makerson local to national scales with the facts and methods necessary to design and execute an adaptation strategy to natural hazards in a changing climate, in a robust and replicable way” Rigorous risk management approach to (1) identify and … (2) assess (quantify) risk today, additional risk due to socio-economic development and climate change (3) Propose, appraise and prioritize a basket of adaptation measures to address weather and climate risk on an economic basis (e.g. cost-benefit metric) Supported by the open-source & -access CLIMADA simulation platform https://github.com/CLIMADA-project/climada_python Guidebook for Practitioners & Methodology: www.kfw-entwicklungsbank.de/PDF/Download-Center/Materialien/2016_No6_Guidebook_Economics-of-Climate-Adaptation_EN.pdf https://www.ethz.ch/content/dam/ethz/special-interest/usys/ied/wcr-dam/documents/Economics_of_Climate_Adaptation_ECA.pdf Economics of Climate Adaptation (ECA)
  • 7.
    ECA (2) -Risk Quantification Risk today Total future risk Socio- Economic Development Projections Climate change Scenarios IncreasingRisk April 8, 2019 Risk Analysis & Adaptation Option Appraisal. Evelyn Mühlhofer, WCR Group, ETH Zürich 16
  • 8.
    Climate change ECA (2)- Risk Quantification risk = hazard x exposure x vulnerability (= probability x intensity)
  • 9.
    General finding1: 40-60% ofrisk can be cost-effectively avoided up to 2030Total future risk Climate adaptation Residual risk • General finding: 40-60% of risk can be cost- effectively avoided up to 2030 • Further reduction only at (excessively) high costs or not at all ECA (3) Economic Appraisal of Options Reduced Damage
  • 10.
    ECA (3) -Economic Appraisal of Options benefit/costratio(US$/US$) Cumulated number of lives saved over timespan X Climate adaptation Residual risk Reduced Damage Reduced Damage 11 April 2019 CLIMADA risk assessment & adaptation economics platform, Evelyn Mühlhofer, WCR Group, ETH Zürich 9
  • 11.
    1. Problem definition,Goal 7. Implementation 6. Decision (?) NO NO Criteria met? Problem defined correctly? 2. Decision criteria 3. Risk analysis 4. Identify options Simulation platform 8. Monitoring 5. Options appraisal see e.g : Souvignet, Wieneke, Müller & Bresch, 2016: Economics of Climate Adaptation (ECA) - Guidebook for Practitioners. Materials on Development Financing, UNU, KfW. https://www.kfw-entwicklungsbank.de/PDF/Download-Center/Materialien/2016_No6_Guidebook_Economics-of-Climate-Adaptation_EN.pdf Figure based upon IPCC und UKCIP Decision Cycle, ECA and CLIMADA
  • 12.
    CLIMADA 11 April 2019 CLIMADArisk assessment & adaptation economics platform, Evelyn Mühlhofer, WCR Group, ETH Zürich 11
  • 13.
    CLIMADA Outputs 0 5 10 15 5 3 4 12 Lossamount109 + 152% AnnualExpected Loss (AEL) 2012 today's expected loss Incremental increase from economic gow th; no climate change Incremental increase from climate change 2030, total expected loss USFL MiamiDadeBrow ardPalmBeach2012  TCNA hazard event set 2012 USFL MiamiDadeBrow ardPalmBeach2030  TCNA hazard event set 2012 USFL MiamiDadeBrow ardPalmBeach2030  climate change scenario based on TCNA hazard event set 2012 11 April 2019 CLIMADA risk assessment & adaptation economics platform, Evelyn Mühlhofer, WCR Group, ETH Zürich 12
  • 14.
    Screen Shot 2019-03-28at 14.50.27 impact intensity CLIMADA probabilistic event-based simulation vulnerability exposure hazard resilience measures outputs: Risk analysis Risk mapping Early Warning Economic appraisal of measures Quantification of uncertainty CLIMADA: Components
  • 15.
    CLIMADA: Open Access& Open Source https://github.com/CLIMADA-project/climada_python and https://climada-python.readthedocs.io/en/latest/install.html 11 April 2019 CLIMADA risk assessment & adaptation economics platform, Evelyn Mühlhofer, WCR Group, ETH Zürich 14
  • 16.
    Demo… 11 April 2019 CLIMADArisk assessment & adaptation economics platform, Evelyn Mühlhofer, WCR Group, ETH Zürich 15
  • 17.
    Exposures Disc Rates Impact Funcs Measures Hazard excel mat pkl CLIMADA: Workflow 11 April2019 CLIMADA risk assessment & adaptation economics platform, Evelyn Mühlhofer, WCR Group, ETH Zürich 16
  • 18.
    CLIMADA: Hazard Hazard TypeCoverage Resolution Tropical Cyclone global 10x10km and 1x1 km European winter storms Europe 10x10km Earthquake and Volcano global 10x10km and 1x1 km Wildfire global 10x10km and 1x1 km Flood (Rivers) global 1x1 km Landslides global 1x1 km Droughts global 10x10km and 1x1 km Format: for each geo-coded point  frequency, intensity & time of event Data sources: modular, default provides global open-source data 11 April 2019 CLIMADA risk assessment & adaptation economics platform, Evelyn Mühlhofer, WCR Group, ETH Zürich 17
  • 19.
    Demo… 11 April 2019 CLIMADArisk assessment & adaptation economics platform, Evelyn Mühlhofer, WCR Group, ETH Zürich 18 2007 Super Clyclonic Storm SIDR Damage: $1.7 billion (2007 USD) Fatalities: 3,447–15,000 Highest 3-min sustained wind speed: 215 km/h
  • 20.
    CLIMADA: Exposure • LitPop •night light intensities and gridded population count • 1kmx1km • BlackMarble • night light intensities for a specific year • 1kmx1km resolution • Monetary asset values (non-financial wealth, GDP, ..) • Population 11 April 2019 CLIMADA risk assessment & adaptation economics platform, Evelyn Mühlhofer, WCR Group, ETH Zürich 19
  • 21.
    Demo… 11 April 2019 CLIMADArisk assessment & adaptation economics platform, Evelyn Mühlhofer, WCR Group, ETH Zürich 20
  • 22.
    CLIMADA: Vulnerability • Intensity-Impactrelationship • “Impact Functions” 11 April 2019 CLIMADA risk assessment & adaptation economics platform, Evelyn Mühlhofer, WCR Group, ETH Zürich 21
  • 23.
    Demo… 11 April 2019 CLIMADArisk assessment & adaptation economics platform, Evelyn Mühlhofer, WCR Group, ETH Zürich 22
  • 24.
    CLIMADA: Risk Quantification(I) • “Risk” ~ “Impact” ~ “Expected Damage” • Combination of all three elements – Exposure, Hazard, Vulnerability • per year or per specified time frame, damage exceedance curve 11 April 2019 CLIMADA risk assessment & adaptation economics platform, Evelyn Mühlhofer, WCR Group, ETH Zürich 23
  • 25.
    Demo… 11 April 2019 CLIMADArisk assessment & adaptation economics platform, Evelyn Mühlhofer, WCR Group, ETH Zürich 24 Expected Annual Damage today: (exemplary!) 6.887e+08 USD
  • 26.
    CLIMADA: Risk Quantification(II) • Total Future Risk = • Risk today • + Risk from socio-economic development • + Risk from climate change • From Today‘s to Future Risk • Same procedure as before: Hazard, Exposure, Vulnerability • Modifications: • Change Exposure (population / asset values) • Change Hazard Set (frequency / intensity) 11 April 2019 CLIMADA risk assessment & adaptation economics platform, Evelyn Mühlhofer, WCR Group, ETH Zürich 25
  • 27.
    CLIMADA: Adaptation Measure Parametrization •Modifies Hazard • Frequency • Intensity • Modifies Impact Function • Shift • Reduction • Cut-off 11 April 2019 CLIMADA risk assessment & adaptation economics platform, Evelyn Mühlhofer, WCR Group, ETH Zürich 26
  • 28.
    CLIMADA: Adaptation Measure Parametrization- Example • Building Code in Miami, FL: • Houses must be built to withstand wind intensities up to 140 mph (62.5 m/s) • Targets Impact function: Cut-off 11 April 2019 CLIMADA risk assessment & adaptation economics platform, Evelyn Mühlhofer, WCR Group, ETH Zürich 27
  • 29.
    Demo… 11 April 2019 CLIMADArisk assessment & adaptation economics platform, Evelyn Mühlhofer, WCR Group, ETH Zürich 28
  • 30.
    CLIMADA: Adaptation MeasureAppraisal • Same procedure as before: Hazard, Exposure, Vulnerability • Comparison of damage: total risk before & after modifications • Weighting against implementation costs  Cost-Benefit metrics 11 April 2019 CLIMADA risk assessment & adaptation economics platform, Evelyn Mühlhofer, WCR Group, ETH Zürich 29
  • 31.
    Uncertainty, Development, ClimateChange 11 April 2019 CLIMADA risk assessment & adaptation economics platform, Evelyn Mühlhofer, WCR Group, ETH Zürich 30
  • 32.
  • 33.
    Discussion 11 April 2019 CLIMADArisk assessment & adaptation economics platform, Evelyn Mühlhofer, WCR Group, ETH Zürich 32
  • 34.
    • Questions? • Utility? •Expertise? • Input & Output data? • Alternatives? • Experience? 11 April 2019 CLIMADA risk assessment & adaptation economics platform, Evelyn Mühlhofer, WCR Group, ETH Zürich 33
  • 35.
    Back-up 11 April 2019 CLIMADArisk assessment & adaptation economics platform, Evelyn Mühlhofer, WCR Group, ETH Zürich 34
  • 36.
    Risk assessment (2) Cost-benefitanalysis (3) Roadmap Aligning risk appetite with development priorities Incorporating further criteria to cost-benefit ratio (Re-)prioritizing risk reduction and transfer measures Integrating into NAP and related planning documents Develop a roadmap including priority initiatives Using this roadmap and business case for funding discussions Speed-up implementation with additional funding; strengthen resilience The Business Case for Adaptation (2) + (3) Risk today Socio- Economic Developm ent Total future risk Climate change
  • 37.
    CLIMADA Architecture in Python Note: Illustrative purpose; does notcorrespond to the most up- to-date architecture in detail
  • 38.
    Note on inputs– the user defines it all! ▪ Links to many databases, easiest interface via Excel ▪ Expects data to be geo-encoded ▪ Garbage in – garbage out, i.e. climada supports data cleaning, but does not do it on its own ;-)  All documented in https://github.com/davidnbresch/climada/blob/master/docs/climada_manual.pdf CLIMADA
  • 39.
  • 40.
    What skills &data are required? Level of skills needed by field of expertise From: Materials on Development Financing: Economics of Climate Adaptation (ECA) - Guidebook for Practitioners, KfW Development Bank April 8, 2019 Risk Analysis & Adaptation Option Appraisal. Evelyn Mühlhofer, WCR Group, ETH Zürich 39
  • 41.
    Development Tools • libraries (python3.6): • numpy • scipy • matplotlib, cartopy • xarray • pandas • scikit-learn • h5py, netcdf4 • pathos • Pint • ... 11 April 2019 CLIMADA risk assessment & adaptation economics platform, Evelyn Mühlhofer, WCR Group, ETH Zürich 40
  • 42.
    Deployment • package manager:pip, conda • virtual environment: conda, virtualenv, pipenv • packaging: setuptools • version control: • GitHub • fork to GitLab at MeteoSwiss • coding rules: • pylint 11 April 2019 CLIMADA risk assessment & adaptation economics platform, Evelyn Mühlhofer, WCR Group, ETH Zürich 41
  • 43.
    Tutorials / Manual •In Jupyter Notebook currently available: • Hazard (1x general / 1x Tropical Cylcones) • Exposure (1x general / 1x LitPop /1x BlackMarble) • Impact Functions • Manual in written text form • KfW ECA Guidebook 11 April 2019 CLIMADA risk assessment & adaptation economics platform, Evelyn Mühlhofer, WCR Group, ETH Zürich 42
  • 44.
    Useful Data SourcesWedo mention key sources in the respective climada modules, but some data we came across is worth mentioning in more general terms. • http://www.naturalearthdata.com and directly http://www.naturalearthdata.com/downloads: global shape files (see e.g. climada_shaperead and the module country_risk). One will likely need the MATLAB mapping toolbox to ease working with these files. Could be used to either improve hazard sets (e.g. using location of reefs in surge model…) or assets. • http://download.geofabrik.de: highly detailed shape files for most countries (e.g. more than 1.5 mio shapes of building’s outlines in Switzerland). Could be used in conjunction with climada module country_risk to further refine the asset base. See also http://www.openstreetmap.org/about, https://mapzen.com and http://planet.openstreetmap.org • Also www.diva-gis.org/gdata and www.diva-gis.org/Data for GIS data almost any country and also www.eea.europa.eu/data-and-maps/data/urban- atlas • GIS data for Seychelles https://www.webgis.gov.sc/map_default.phtml • SRTM elevation data (3-arc seconds resolution ~90m) http://srtm.csi.cgiar.org/SELECTION/inputCoord.asp and generally http://srtm.csi.cgiar.org • Hydrosheds, based on SRTM, manipulated for river routing http://hydrosheds.cr.usgs.gov/index.php • http://www.geoportal.org/web/guest/geo_home_stp • https://www.drought.gov/drought/content/products-current-drought-and-monitoring-drought-indicators/palmer-drought-severity-index • http://beta.sedac.ciesin.columbia.edu/data/collection/gpw-v4/sets/browse population density, water bodies, admin center points with population estimates (http://beta.sedac.ciesin.columbia.edu/data/set/gpw-v4-admin-unit-center-points-population-estimates) • https://search.earthdata.nasa.gov earth data search • https://datahub.io/ open data sets of various kinds • http://databank.worldbank.org/data/home.aspx macroeconomic data • http://databank.worldbank.org/data/reports.aspx?source=subnational-population sub-national population (admin1) • http://www.trademap.org/Index.aspx trade statistics 11 April 2019 CLIMADA risk assessment & adaptation economics platform, Evelyn Mühlhofer, WCR Group, ETH Zürich 43
  • 45.
    • http://www.cger.nies.go.jp/gcp/population-and-gdp.html populationand GDP • http://data.footprintnetwork.org global country-level data on footprint etc. • https://hazards.fema.gov/femaportal/wps/portal/NFHLWMSkmzdownload FEMA, US • http://www.nws.noaa.gov/gis/shapepage.htm NOAA shape files (mainly US) • http://www.mapcruzin.com/free-netherlands-arcgis-maps-shapefiles.htm NLD shape files, http://www.mapcruzin.com/do-it- yourself-gis-maps-shapefiles/ mainly US and http://www.mapcruzin.com/free-world-country-arcgis-maps-shapefiles.htm global • http://floodobservatory.colorado.edu floods • https://freegisdata.rtwilson.com good global overview of free GIS data • https://www.census.gov/geo/maps-data/data/cbf/cbf_msa.html US census • https://data.oecd.org/gdp/real-gdp-forecast.htm OECD GDP past and future • http://colorbrewer2.org good color scales to print well etc. • http://www.reefbase.org global coral reef data, good preview via http://www.reefbase.org/gis_maps/default.aspx • http://datadryad.org/resource/doi:10.5061/dryad.dk1j0 Gridded global datasets for GDP and Human Development Index over 1990-2015 • http://maps.elie.ucl.ac.be/CCI/viewer/ land cover map, resolution 10arcsec (300m) • http://www.globallandcover.com/GLC30Download/index.aspx 30m land cover map • See also e.g. http://data.geocomm.com/catalog • https://pmm.nasa.gov/applications/global-landslide-model landslide model/map • http://ghsl.jrc.ec.europa.eu/data.php global human settlement layer • Models • http://www.hrc-lab.org Hydrologic Research Center, (local) flood model 11 April 2019 CLIMADA risk assessment & adaptation economics platform, Evelyn Mühlhofer, WCR Group, ETH Zürich 44
  • 46.
    Contact Prof. Dr. DavidN. Bresch Head of the Weather and Climate Risks Group dbresch@ethz.ch Dr. Grabiela Aznar Siguan Senior Researcher, Implementation of CLIMADA Python gabriela.aznar@usys.ethz.ch Evelyn Mühlhofer Research Associate evelyn.muehlhofer@usys.ethz.ch 11 April 2019 CLIMADA risk assessment & adaptation economics platform, Evelyn Mühlhofer, WCR Group, ETH Zürich 45
  • 47.
    References Images p. 18 Wikipedia p.20 Maps of Bangladesh Blogspot (http://maps-of-bangladesh.blogspot.com/ ) ; World-Map (http://ontheworldmap.com/bangladesh/large-detailed-map-of-bangladesh-with-cities.html ) p. 22 Getty Images; K. Emanuel (2011) Global Warming Effects on U.S. Hurricane Damage. p. 27 SEVENTH INTERNATIONAL WORKSHOP ON TROPICAL CYCLONES (https://www.wmo.int/pages/prog/arep/wwrp/tmr/otherfileformats/documents/4_2.pdf ) 11 April 2019 CLIMADA risk assessment & adaptation economics platform, Evelyn Mühlhofer, WCR Group, ETH Zürich 46