Download as PDF, PPTX

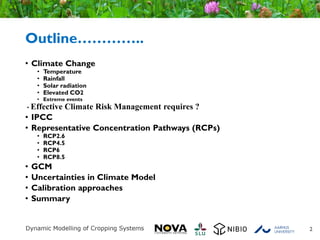
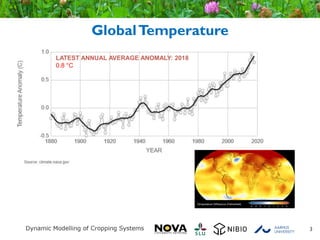
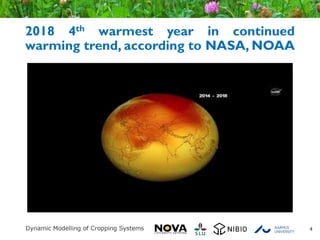
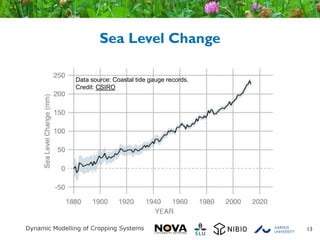
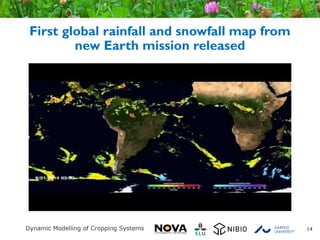
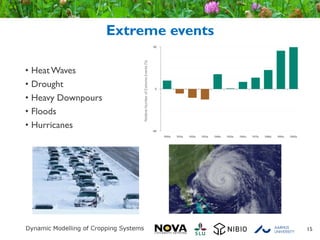
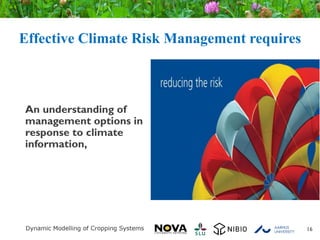
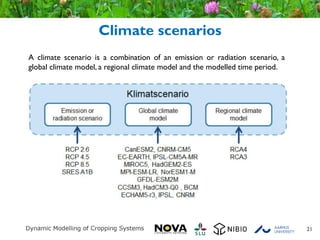
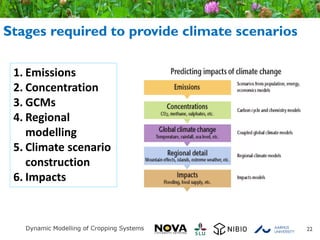
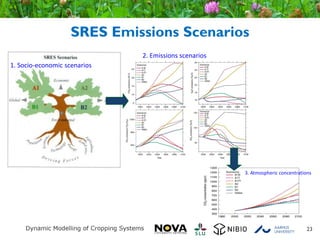
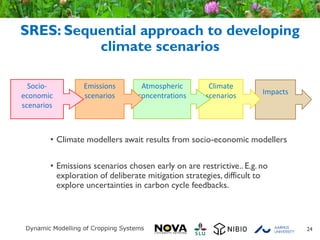
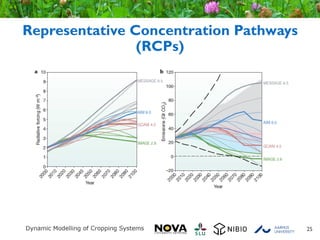
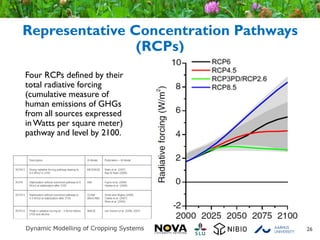
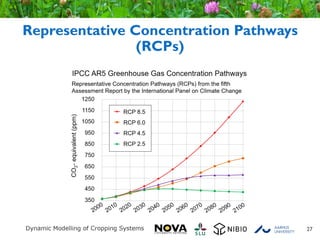
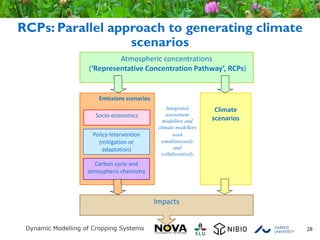
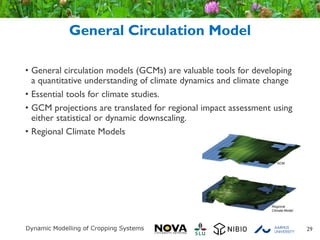
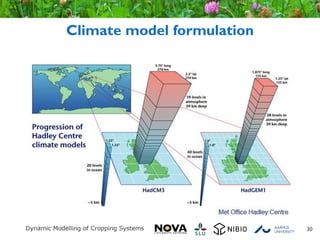
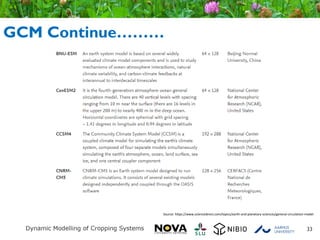
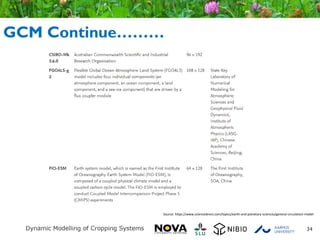
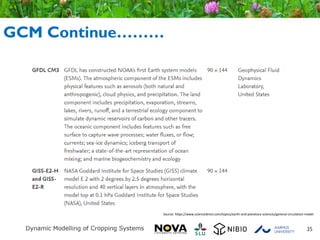
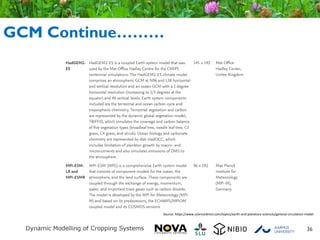
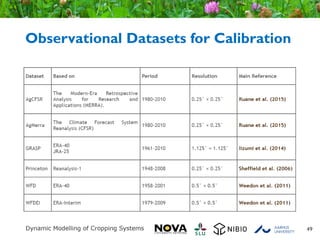


The document discusses climate change, focusing on temperature, rainfall, and extreme events while highlighting the importance of effective climate risk management. It emphasizes the role of General Circulation Models (GCMs) and Representative Concentration Pathways (RCPs) in understanding climate scenarios and the associated uncertainties. Furthermore, it outlines the need for calibration approaches to improve climate projections for impact assessments.


