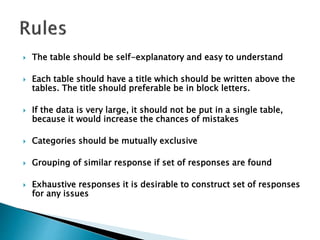
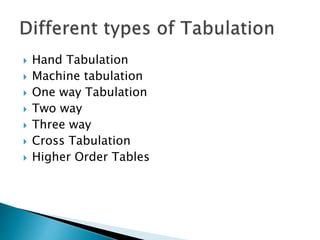
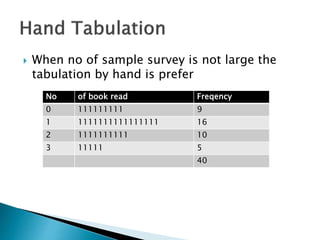
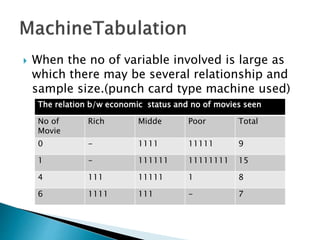
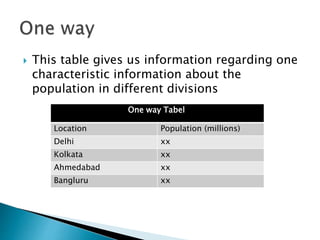
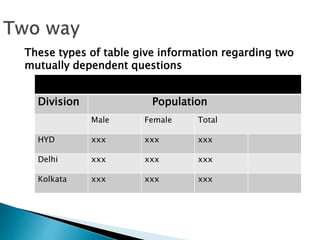
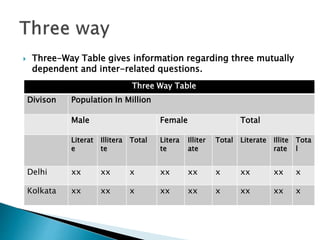
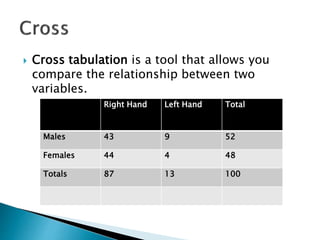
Tabulation is the systematic arrangement of statistical data in columns or rows to help explain problems under consideration. It prepares data for analysis and interpretation. There are different types of tabulation including one-way, two-way, three-way, and cross tabulation. Higher order tables provide information on multiple interrelated questions. Care must be taken in deciding tabulation methods based on the investigation scope and choosing clear, exhaustive, and mutually exclusive categories.
2. Data Tabulation intro
Usages
Rules
Types of data tabulation
Q/A
3. Tabulation is the systematic arrangement of
the statistical data in columns or rows. It
involves the orderly and systematic
presentation of numerical data in a form
designed to explain the problem under
consideration. Tabulation helps in drawing
the inference from the statistical figures.
4. Tabulation prepares the ground for analysis
and interpretation.
a suitable method must be decided carefully
taking into account the scope and objects of
the investigation, because it is very important
part of the statistical methods.
5. The table should be self-explanatory and easy to understand
Each table should have a title which should be written above the
tables. The title should preferable be in block letters.
If the data is very large, it should not be put in a single table,
because it would increase the chances of mistakes
Categories should be mutually exclusive
Grouping of similar response if set of responses are found
Exhaustive responses it is desirable to construct set of responses
for any issues
6. Hand Tabulation
Machine tabulation
One way Tabulation
Two way
Three way
Cross Tabulation
Higher Order Tables
7. When no of sample survey is not large the
tabulation by hand is prefer
No of book read Freqency
0 111111111 9
1 1111111111111111 16
2 1111111111 10
3 11111 5
40
8. When the no of variable involved is large as
which there may be several relationship and
sample size.(punch card type machine used)
The relation b/w economic status and no of movies seen
No of
Movie
Rich Midde Poor Total
0 - 1111 11111 9
1 - 111111 11111111 15
4 111 11111 1 8
6 1111 111 - 7
9. This table gives us information regarding one
characteristic information about the
population in different divisions
One way Tabel
Location Population (millions)
Delhi xx
Kolkata xx
Ahmedabad xx
Bangluru xx
10. These types of table give information regarding two
mutually dependent questions
Division Population
Male Female Total
HYD xxx xxx xxx
Delhi xxx xxx xxx
Kolkata xxx xxx xxx
11. Three-Way Table gives information regarding three mutually
dependent and inter-related questions.
Three Way Table
Divison Population In Million
Male Female Total
Literat
e
Illitera
te
Total Litera
te
Illiter
ate
Total Literate Illite
rate
Tota
l
Delhi xx xx x xx xx x xx xx x
Kolkata xx xx x xx xx x xx xx x
12. Cross tabulation is a tool that allows you
compare the relationship between two
variables.
Right Hand Left Hand Total
Males 43 9 52
Females 44 4 48
Totals 87 13 100
13. Higher order tables are those which provide
information about a large number of inter
related questions. Higher order tables may be
of four-way, five-way, six-way etc. Such kind
of tables are called manifold tables.