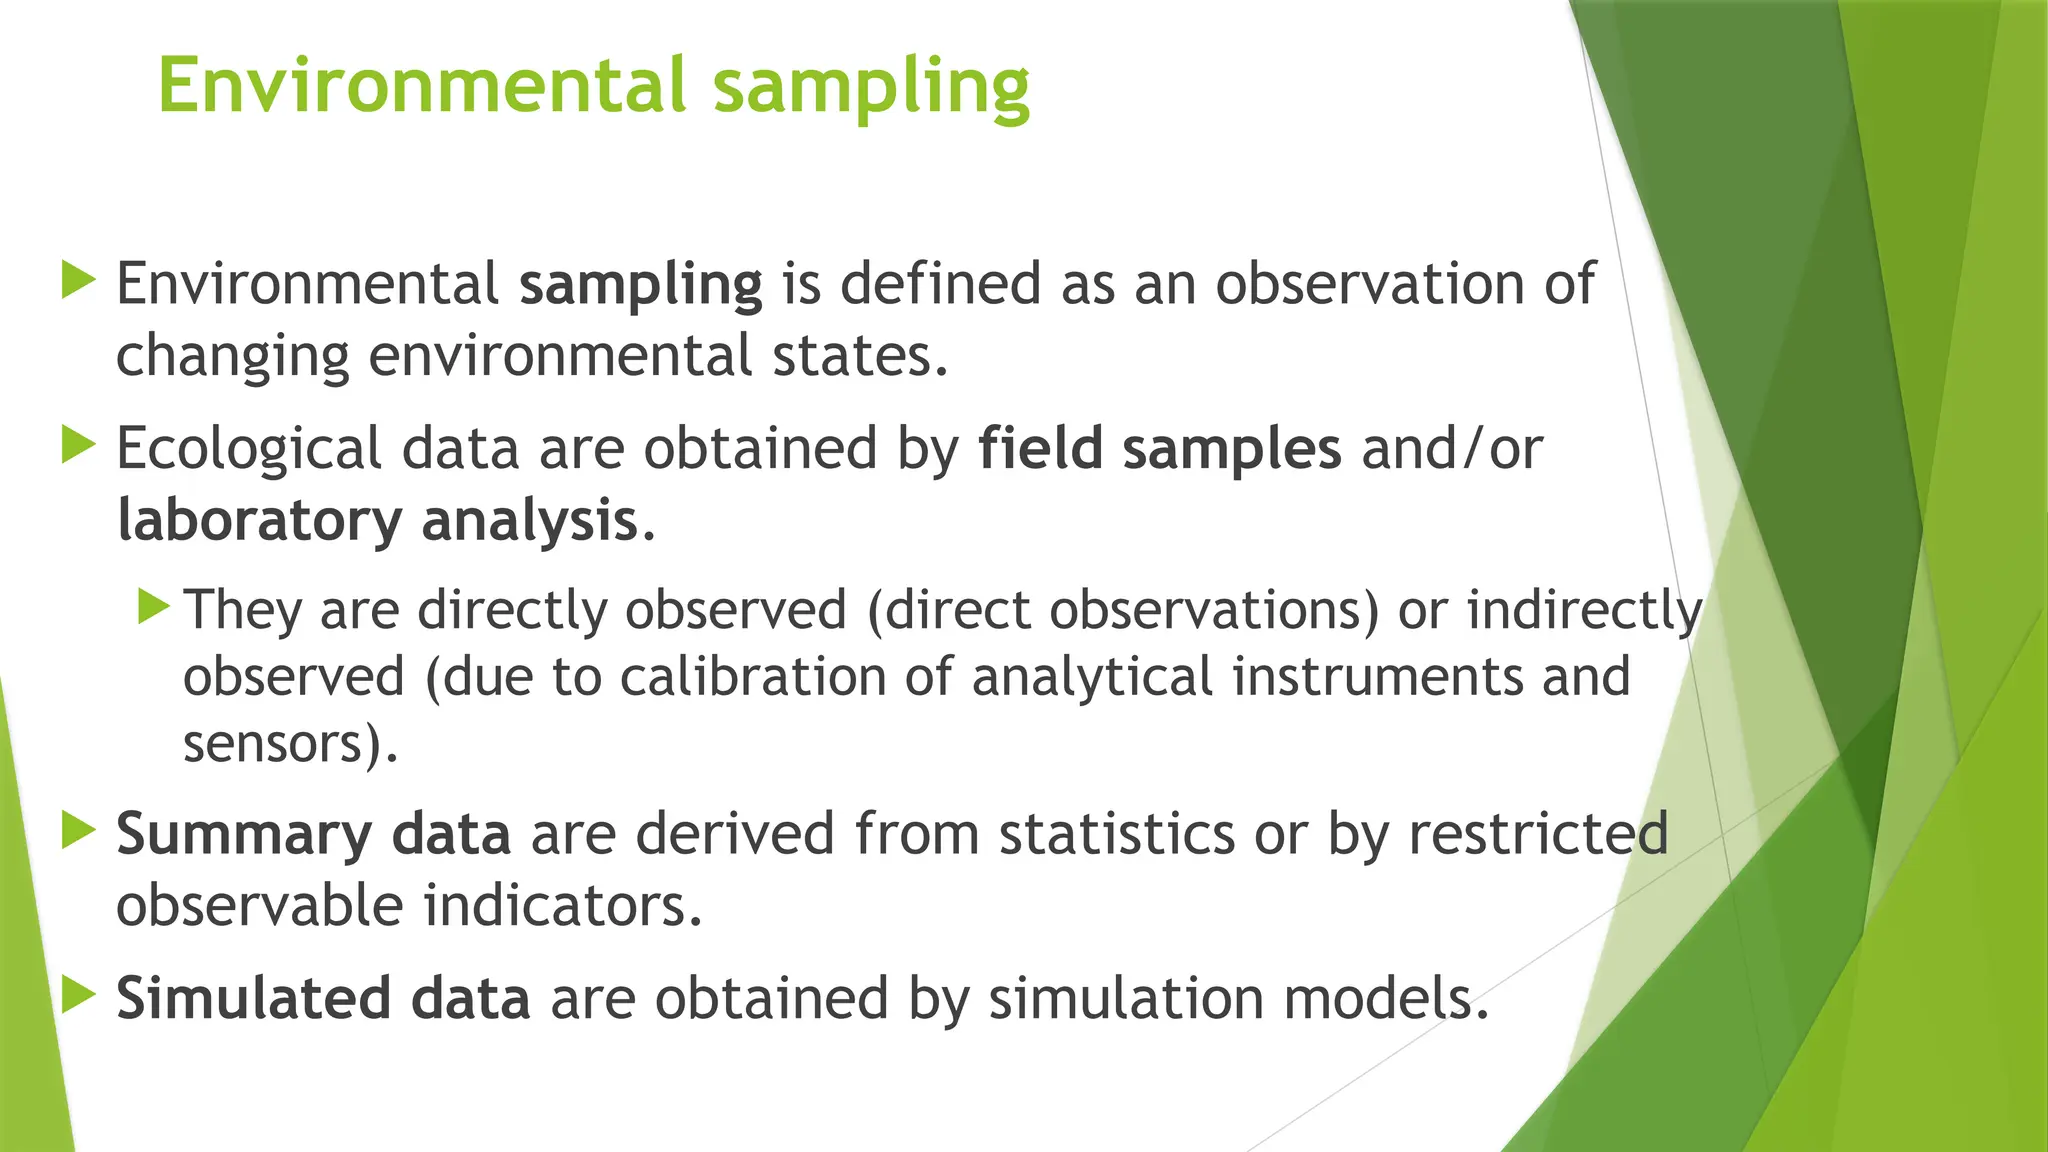
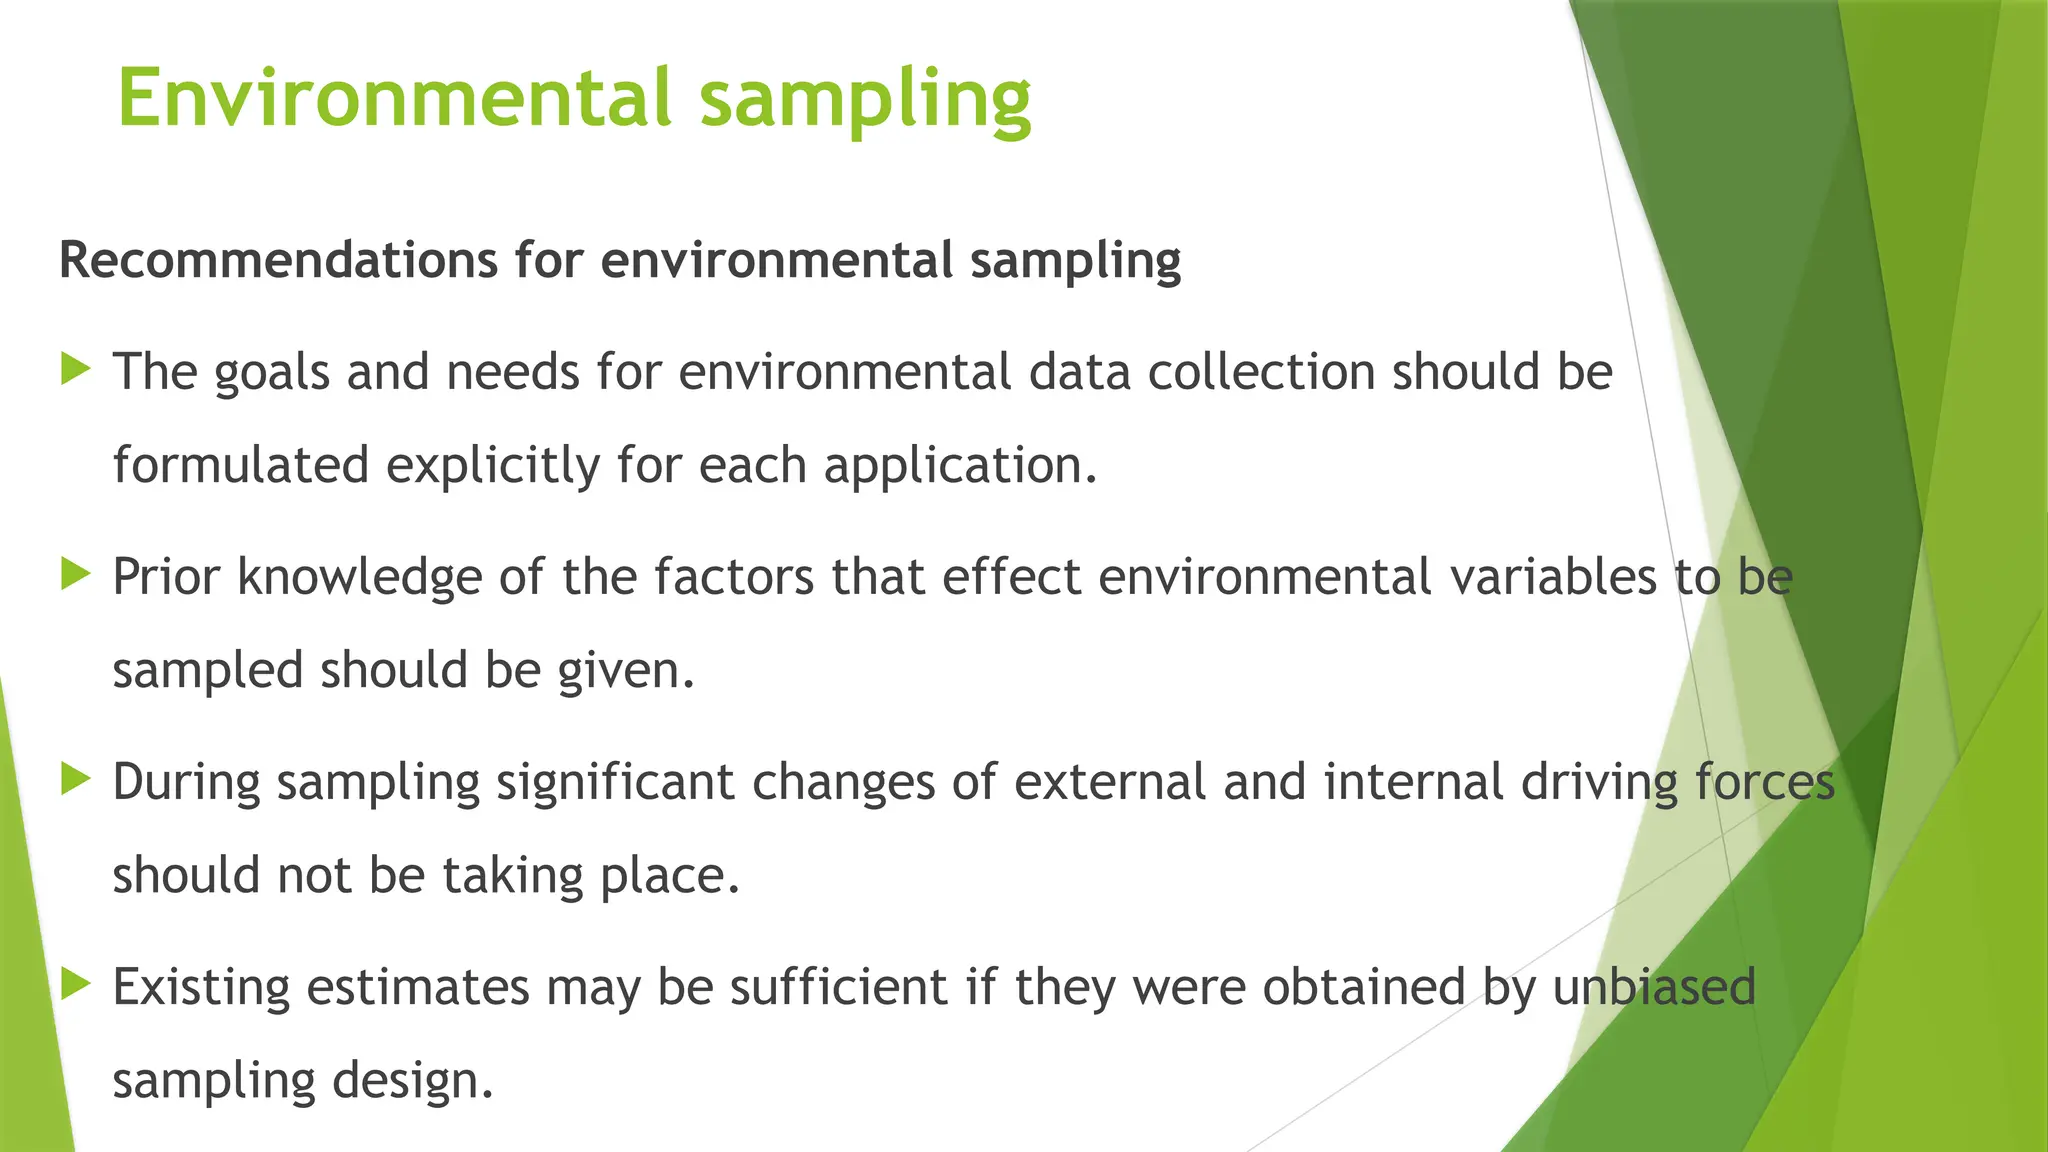
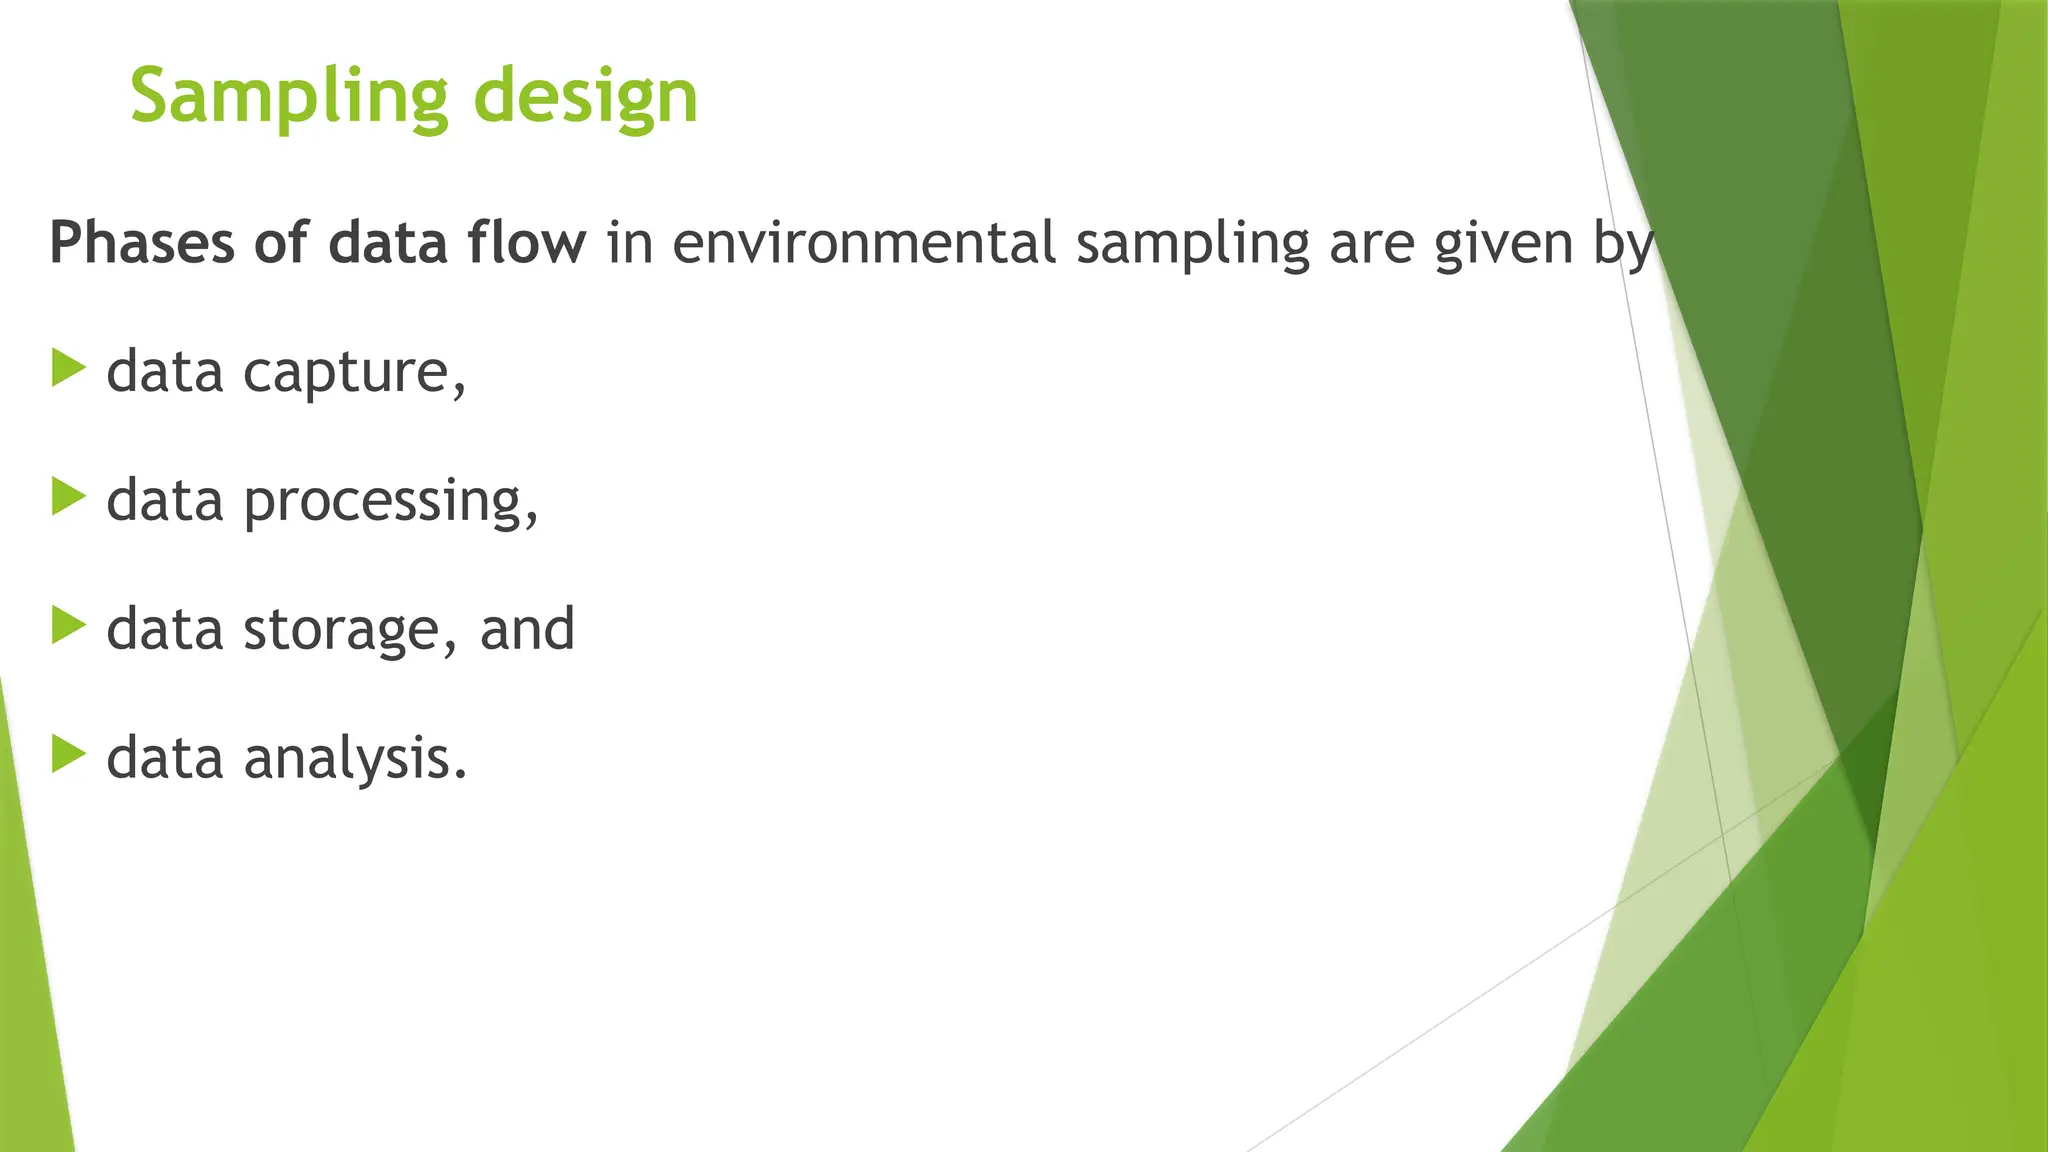
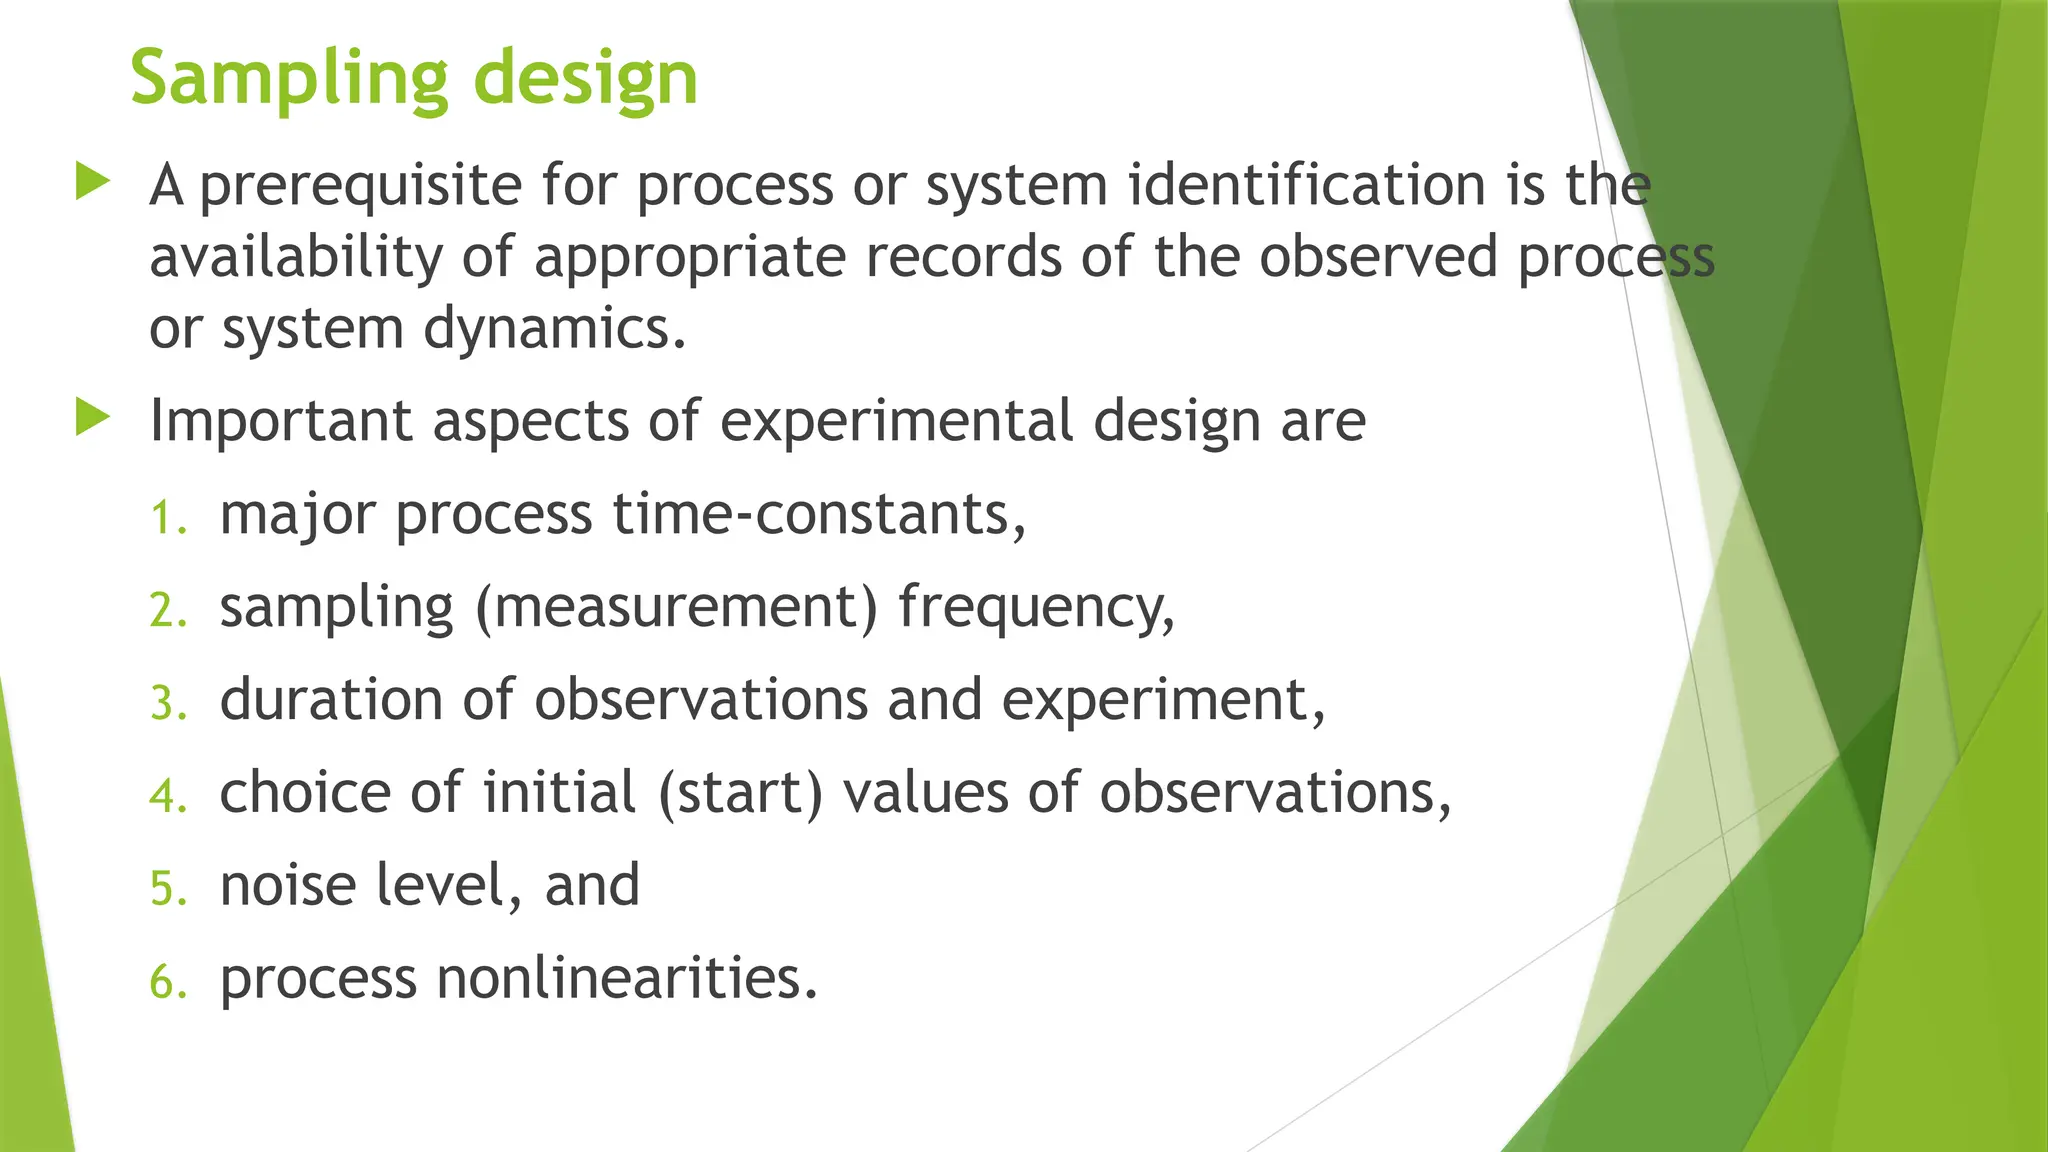
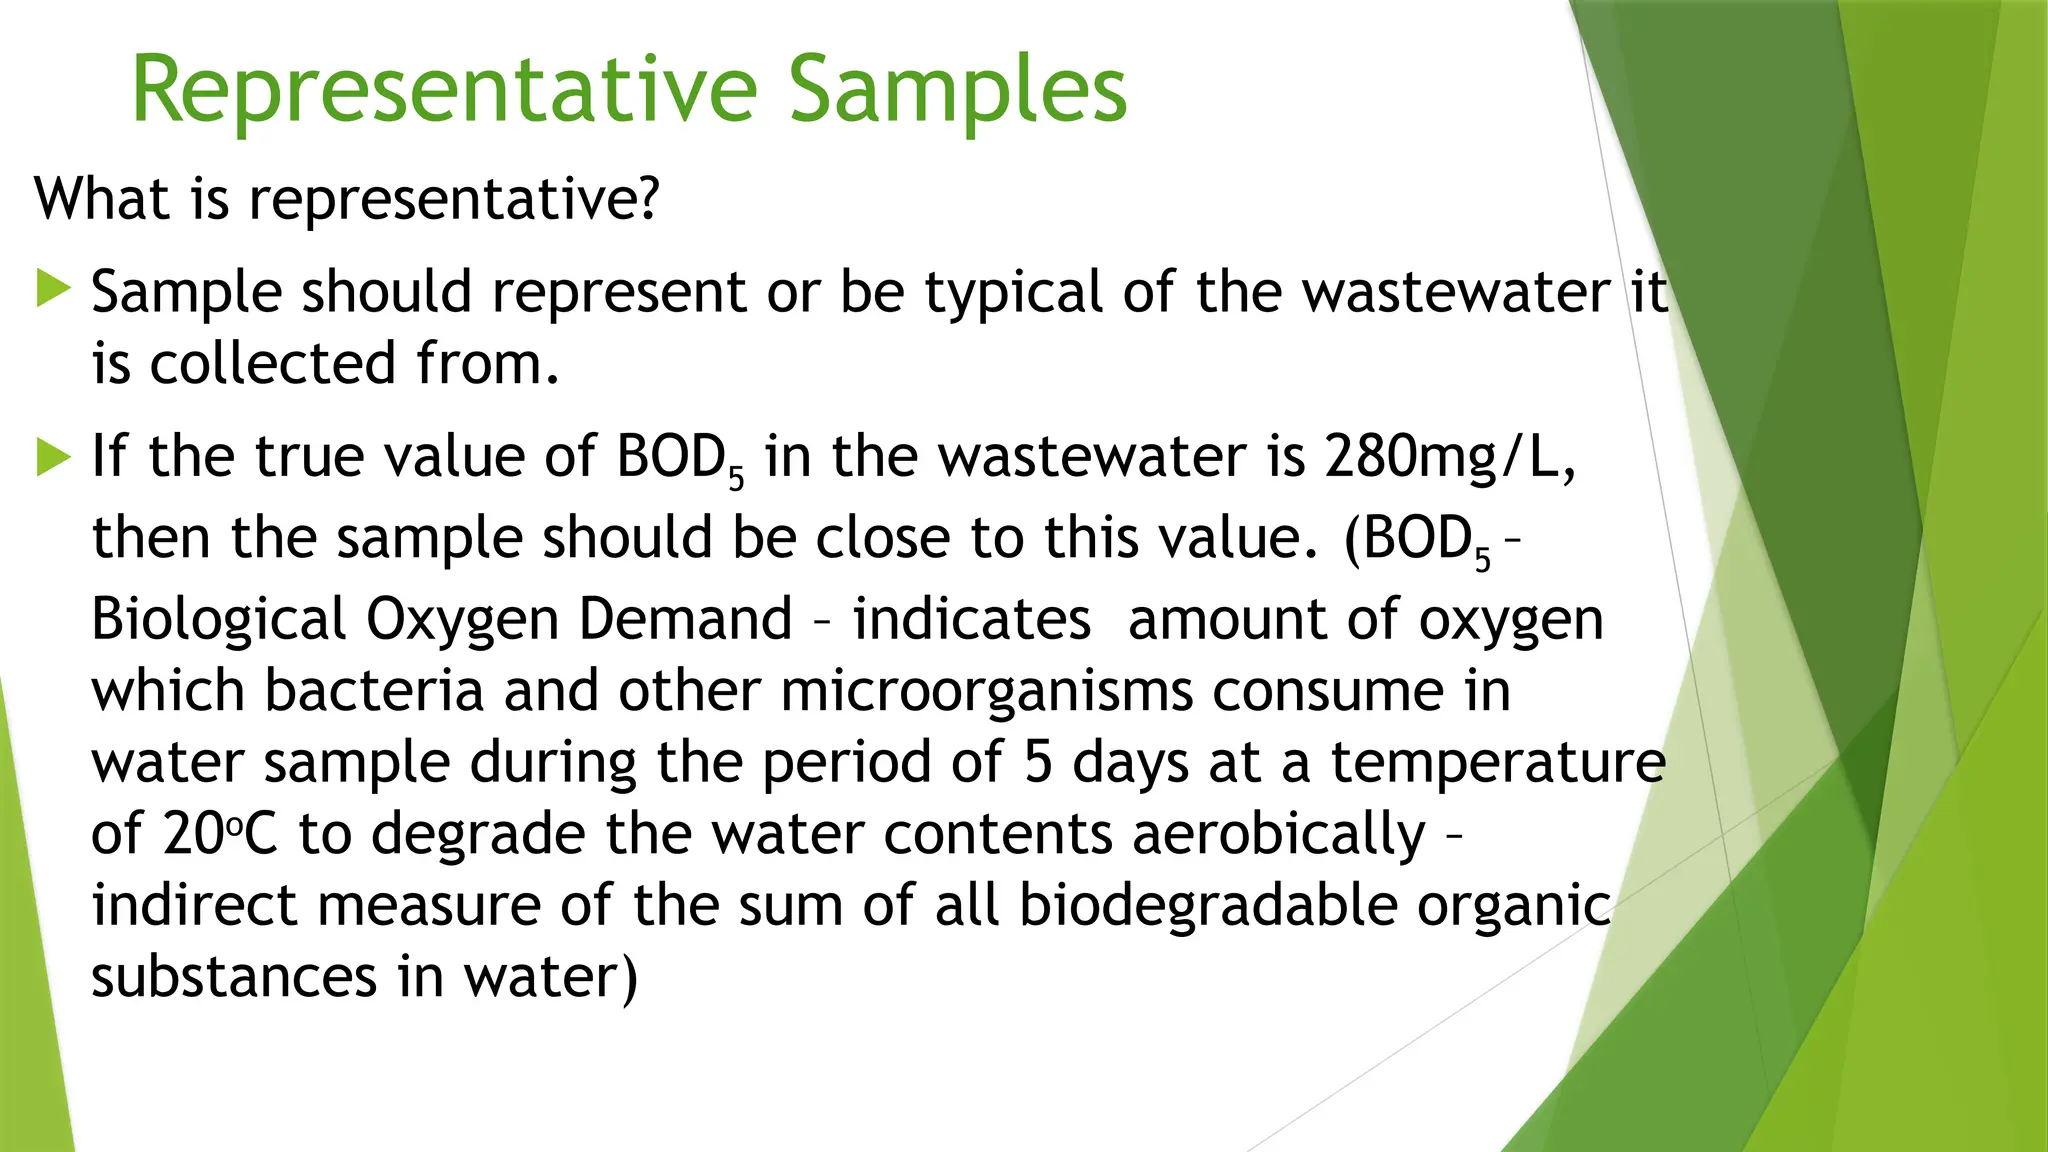
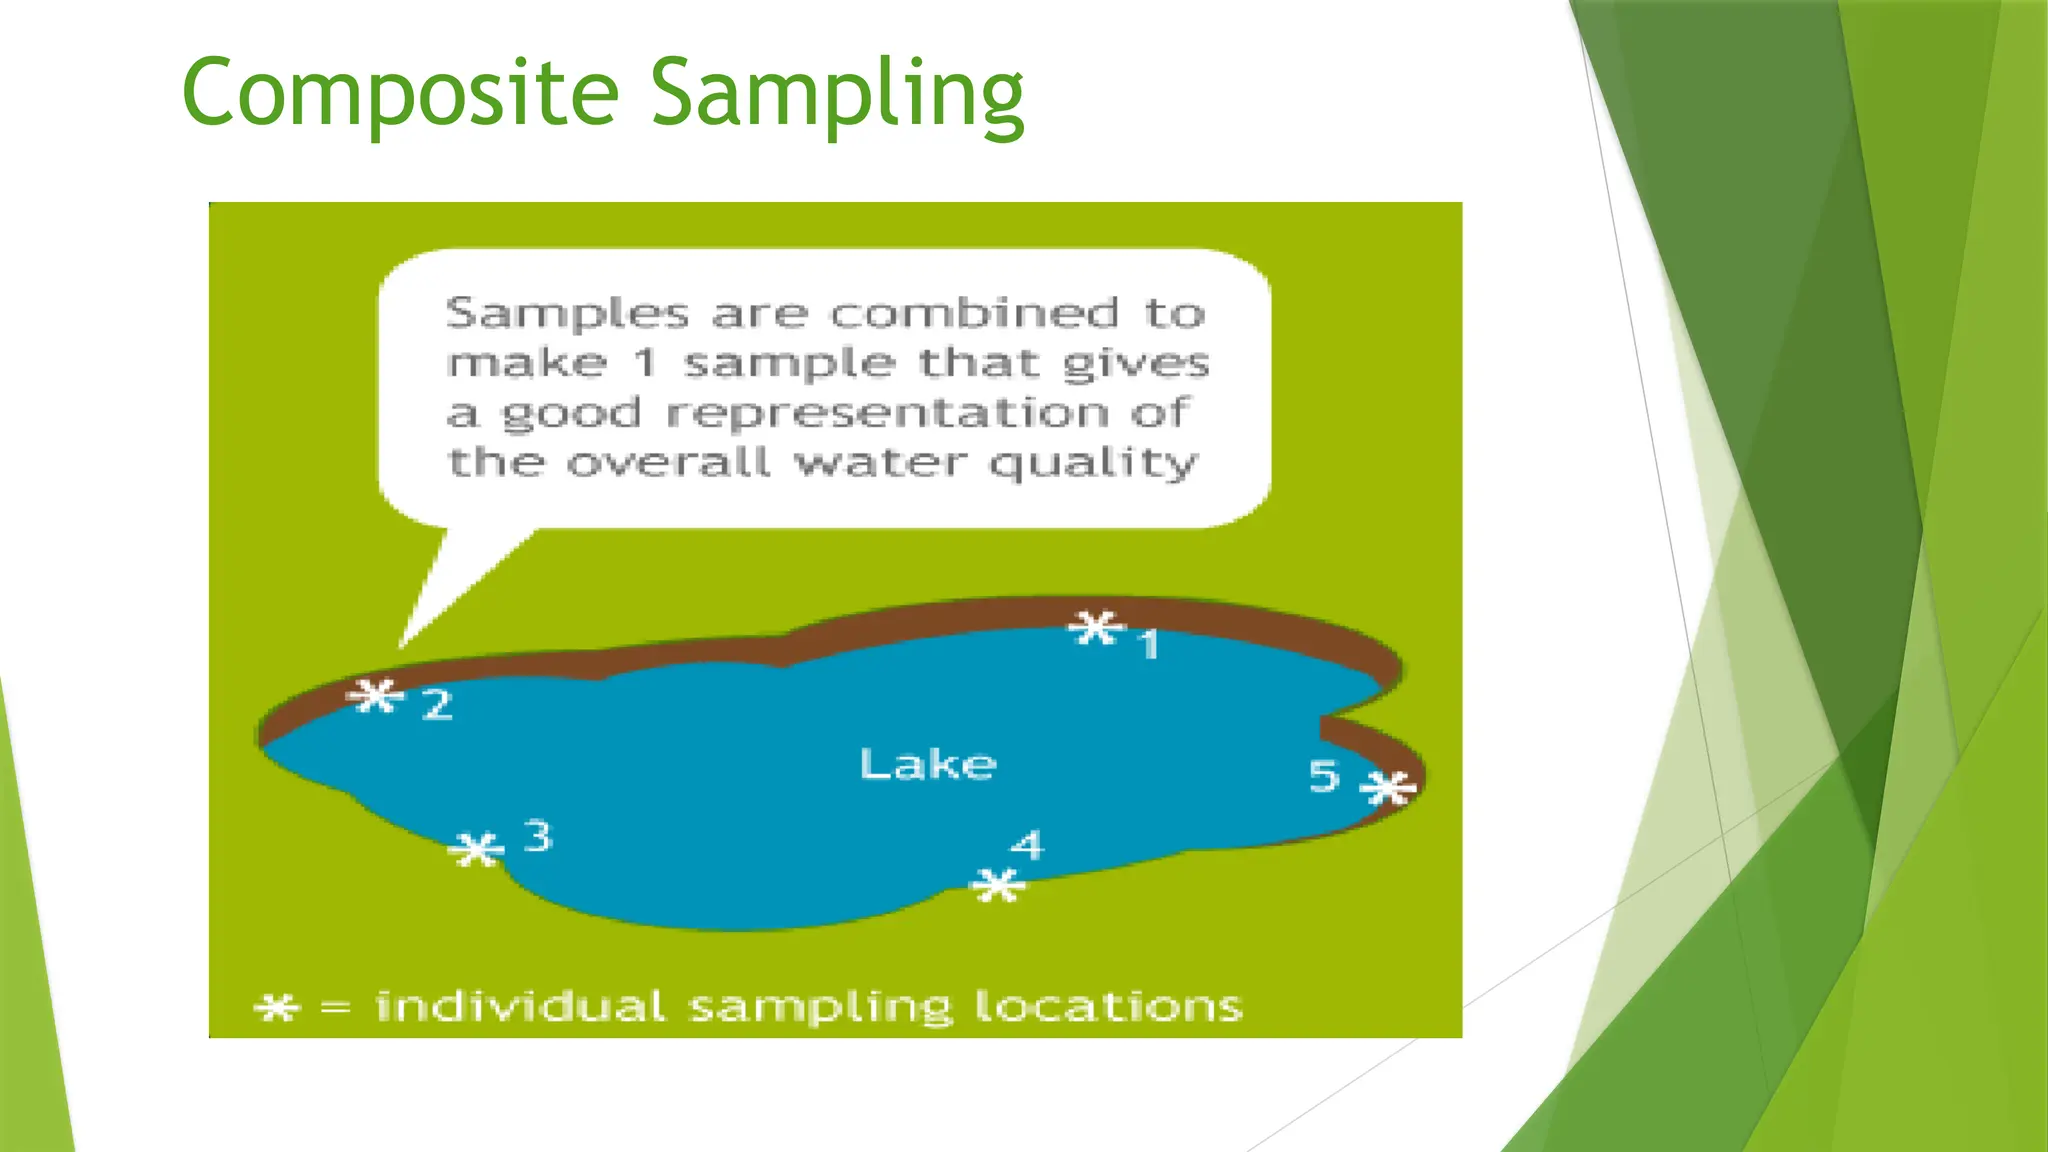
Environmental sampling
 Environmental sampling is defined as an observation of
changing environmental states.
 Ecological data are obtained by field samples and/or
laboratory analysis.
 They are directly observed (direct observations) or indirectly
observed (due to calibration of analytical instruments and
sensors).
 Summary data are derived from statistics or by restricted
observable indicators.
 Simulated data are obtained by simulation models.
Environmental sampling
Recommendations for environmental sampling
 The goals and needs for environmental data collection should be
formulated explicitly for each application.
 Prior knowledge of the factors that effect environmental variables to be
sampled should be given.
 During sampling significant changes of external and internal driving forces
should not be taking place.
 Existing estimates may be sufficient if they were obtained by unbiased
sampling design.
Sampling design
Phases of data flow in environmental sampling are given by
 data capture,
 data processing,
 data storage, and
 data analysis.
Sampling design
 A prerequisite for process or system identification is the
availability of appropriate records of the observed process
or system dynamics.
 Important aspects of experimental design are
1. major process time-constants,
2. sampling (measurement) frequency,
3. duration of observations and experiment,
4. choice of initial (start) values of observations,
5. noise level, and
6. process nonlinearities.
Sources of variability in sampling programs
Sources of variability in sampling programs are given by
 the variability caused by environmental factors (between sites and dates,or
between dates at the same sites),
 the variability caused by intrinsic factors between samples (same site and
same date),
 the variability caused by different chemical analytical methods (between
determination), and
 the variability caused by different chemical pre-treatments (same
determinations).
Samples vs. Populations
 The population is the total or all of the possible
answers we might get by sampling.
 We sample because we can’t count the whole
population.
Environmental sampling
 Proper sample technique is critical for good
analysis results. Trash in = Trash out.
Representative Samples
What is representative?
 Sample should represent or be typical of the wastewater it
is collected from.
 If the true value of BOD5 in the wastewater is 280mg/L,
then the sample should be close to this value. (BOD5 –
Biological Oxygen Demand – indicates amount of oxygen
which bacteria and other microorganisms consume in
water sample during the period of 5 days at a temperature
of 20o
C to degrade the water contents aerobically –
indirect measure of the sum of all biodegradable organic
substances in water)
Representative Samples
How do we know the sample is representative?
 Answer: Statistics
 Representative samples should be very close to
the mean value of the population.
 How do we know we are close to the
mean?
 Look at the sample standard deviation.
Population Characteristics
Sample Standard Deviation
 – x bar
 is the number of
degrees of freedom –
indicates the number
of independent results
that enter into the
computation of the
standard deviation.
 The standard deviation
tells us how spread out
the data are.
 If the mean is 20 and std
dev is 2, then 68% of all
measurements are
between 18 and 22.
Sample Containers and Preservation for
Common Parameters.
Grab Sampling
Grab Sampling
 Exactly what it sounds like. One sample collected
at a particular point and time.
 Reflects performance only at the point in time
that the sample was collected, and then only if
the sample was properly collected.
 May be used where population is not changing
suddenly or changing a great deal over time.
Grab Sampling
 Grab sampling allows the analysis of specific types of
unstable parameters such as pH, dissolved oxygen,
residual chlorine, Fecal coliform, nitrites and
temperature.
 Also applicable for estimating performance under a given
set of conditions.
 However, the most widely used indicators of treatment
plant performance, including CBOD5 (five day
carbonaceous biochemical oxygen demand), TSS (total
suspended solids) and TN (total nitrogen) require the use
of composite sampling techniques.
Composite Sampling
Composite Sampling
 Composite sampling involves taking a number of
small samples, called sub-samples.
 Multiple samples collected and added together to
make one sample.
 Time Composite.
 Space Composite.
 Flow Proportional Composite.
Composite Sampling
Composite Sampling
 Frequently used to estimate average values over a 24-hour
period.
BOD5 loading to aeration tanks.
Total suspended solids (TSS) leaving the wastewater
treatment plant (WWTP) in the effluent.
 Gives information over a longer period of time or space.
Composite Sampling
 Consideration must be given to sample handling
and storage during compositing.
 We don’t want the sample characteristics to
change while we are sampling.
 Refrigeration often used to slow activity.
 Chemicals may also be added as preservatives.
How to Composite
 Simple Composite – Add equal volumes of samples
collected from different times or locations. Mix
thoroughly.
 Flow Proportional Composite – Volume of each
subsample based on flow.
 Estimate total volume of sample required.
 Estimate total flow over sampling period.
 Calculate sample volume per flow.
Advantages of composite sampling
 One can select a large number of sample units to
ensure the desired sample support, so that the
results of the analysis will be sufficiently reliable.
 By compositing several individual samples into
fewer composites, one reduces the number of
analytical measurements so that a study can be
carried out without affecting the available
financial resources.
Disadvantages of composite sampling
 Compositing may dilute peak values of concern
 Therefore, if peak concentrations of analytes are
important, compositing should be supplemented with
grab samples taken at sites and times where high values
are suspected.
Remote surveillance
Remote surveillance
 The word ‘surveillance’ means to observe a specific
area or to monitor the activities of individual or a
group.

2. Environmental Sampling- Grab & composite.pptx

  • 1.
  • 2.
    Environmental sampling  Environmentalsampling is defined as an observation of changing environmental states.  Ecological data are obtained by field samples and/or laboratory analysis.  They are directly observed (direct observations) or indirectly observed (due to calibration of analytical instruments and sensors).  Summary data are derived from statistics or by restricted observable indicators.  Simulated data are obtained by simulation models.
  • 3.
    Environmental sampling Recommendations forenvironmental sampling  The goals and needs for environmental data collection should be formulated explicitly for each application.  Prior knowledge of the factors that effect environmental variables to be sampled should be given.  During sampling significant changes of external and internal driving forces should not be taking place.  Existing estimates may be sufficient if they were obtained by unbiased sampling design.
  • 4.
    Sampling design Phases ofdata flow in environmental sampling are given by  data capture,  data processing,  data storage, and  data analysis.
  • 5.
    Sampling design  Aprerequisite for process or system identification is the availability of appropriate records of the observed process or system dynamics.  Important aspects of experimental design are 1. major process time-constants, 2. sampling (measurement) frequency, 3. duration of observations and experiment, 4. choice of initial (start) values of observations, 5. noise level, and 6. process nonlinearities.
  • 6.
    Sources of variabilityin sampling programs Sources of variability in sampling programs are given by  the variability caused by environmental factors (between sites and dates,or between dates at the same sites),  the variability caused by intrinsic factors between samples (same site and same date),  the variability caused by different chemical analytical methods (between determination), and  the variability caused by different chemical pre-treatments (same determinations).
  • 7.
    Samples vs. Populations The population is the total or all of the possible answers we might get by sampling.  We sample because we can’t count the whole population.
  • 8.
    Environmental sampling  Propersample technique is critical for good analysis results. Trash in = Trash out.
  • 9.
    Representative Samples What isrepresentative?  Sample should represent or be typical of the wastewater it is collected from.  If the true value of BOD5 in the wastewater is 280mg/L, then the sample should be close to this value. (BOD5 – Biological Oxygen Demand – indicates amount of oxygen which bacteria and other microorganisms consume in water sample during the period of 5 days at a temperature of 20o C to degrade the water contents aerobically – indirect measure of the sum of all biodegradable organic substances in water)
  • 10.
    Representative Samples How dowe know the sample is representative?  Answer: Statistics  Representative samples should be very close to the mean value of the population.  How do we know we are close to the mean?  Look at the sample standard deviation.
  • 11.
  • 12.
    Sample Standard Deviation – x bar  is the number of degrees of freedom – indicates the number of independent results that enter into the computation of the standard deviation.  The standard deviation tells us how spread out the data are.  If the mean is 20 and std dev is 2, then 68% of all measurements are between 18 and 22.
  • 13.
    Sample Containers andPreservation for Common Parameters.
  • 14.
  • 15.
    Grab Sampling  Exactlywhat it sounds like. One sample collected at a particular point and time.  Reflects performance only at the point in time that the sample was collected, and then only if the sample was properly collected.  May be used where population is not changing suddenly or changing a great deal over time.
  • 16.
    Grab Sampling  Grabsampling allows the analysis of specific types of unstable parameters such as pH, dissolved oxygen, residual chlorine, Fecal coliform, nitrites and temperature.  Also applicable for estimating performance under a given set of conditions.  However, the most widely used indicators of treatment plant performance, including CBOD5 (five day carbonaceous biochemical oxygen demand), TSS (total suspended solids) and TN (total nitrogen) require the use of composite sampling techniques.
  • 17.
  • 18.
    Composite Sampling  Compositesampling involves taking a number of small samples, called sub-samples.  Multiple samples collected and added together to make one sample.  Time Composite.  Space Composite.  Flow Proportional Composite.
  • 19.
  • 20.
    Composite Sampling  Frequentlyused to estimate average values over a 24-hour period. BOD5 loading to aeration tanks. Total suspended solids (TSS) leaving the wastewater treatment plant (WWTP) in the effluent.  Gives information over a longer period of time or space.
  • 21.
    Composite Sampling  Considerationmust be given to sample handling and storage during compositing.  We don’t want the sample characteristics to change while we are sampling.  Refrigeration often used to slow activity.  Chemicals may also be added as preservatives.
  • 22.
    How to Composite Simple Composite – Add equal volumes of samples collected from different times or locations. Mix thoroughly.  Flow Proportional Composite – Volume of each subsample based on flow.  Estimate total volume of sample required.  Estimate total flow over sampling period.  Calculate sample volume per flow.
  • 23.
    Advantages of compositesampling  One can select a large number of sample units to ensure the desired sample support, so that the results of the analysis will be sufficiently reliable.  By compositing several individual samples into fewer composites, one reduces the number of analytical measurements so that a study can be carried out without affecting the available financial resources.
  • 24.
    Disadvantages of compositesampling  Compositing may dilute peak values of concern  Therefore, if peak concentrations of analytes are important, compositing should be supplemented with grab samples taken at sites and times where high values are suspected.
  • 25.
  • 26.
    Remote surveillance  Theword ‘surveillance’ means to observe a specific area or to monitor the activities of individual or a group.

Editor's Notes

  • #2 The goal of sampling is information mining about the frequency distribution of environmental data or about their probability distribution parameters.
  • #4 Phases of data flow in environmental sampling are given by data capture (e.g. observation, measuring, description), data processing (e.g. aggregation, identification, statistics), data storage (e.g. data bases, metadata, GIS), and data analysis (modelling, simulation, decision support systems, knowledge systems). For sampling design, basic knowledge on environmental processes should be given.
  • #5 Nonlitearity is a term used in statistics to describe a situation where there is not a straight-line or direct relationship between an independent variable and a dependent variable. Examples for sampling of environmental variables Water budget: Surface and groundwater inputs, outputs and changes; Chemical variables: Organic and inorganic substances, metabolites; Physical variables: External and internal driving forces; Biological variables: Uptake and conversion of nutrients and organic substances by plants and animals; Other variables as required
  • #11 Another parameter characterizing the normal distribution is the standard deviation. It describes how widespread the numbers are. Generally, 68% of values should be within 1 standard deviation from the mean, 95% within 2 standard deviations, and 99.7% within 3 standard deviations. The number of standard deviations from the mean is called the z-score. It may be the case that you know the variance but not the standard deviation of your distribution. However, it's easy to work out the latter by simply taking the square root of the variance.
  • #13 BOD pH less than 2 Holding time 24 hrs
  • #20 Flow Proportional Composite Sample means a sample consisting of portions of waste taken in proportion to the volume of flow of said wastes. Flow Proportional Composite Sample means a combination of individual samples of equal volume taken at equal intervals of flow without consideration of the time between individual samples. Flow Proportional Composite Sample means a combination of not less than ten individual samples of equal volumes of wastewater taken at equal increments of wastewater flow over a specified period of time; Permit samples are often flow proportional composites.