The document discusses graphing quadratic functions of the form f(x) = ax^2 + bx + c. The key points are:
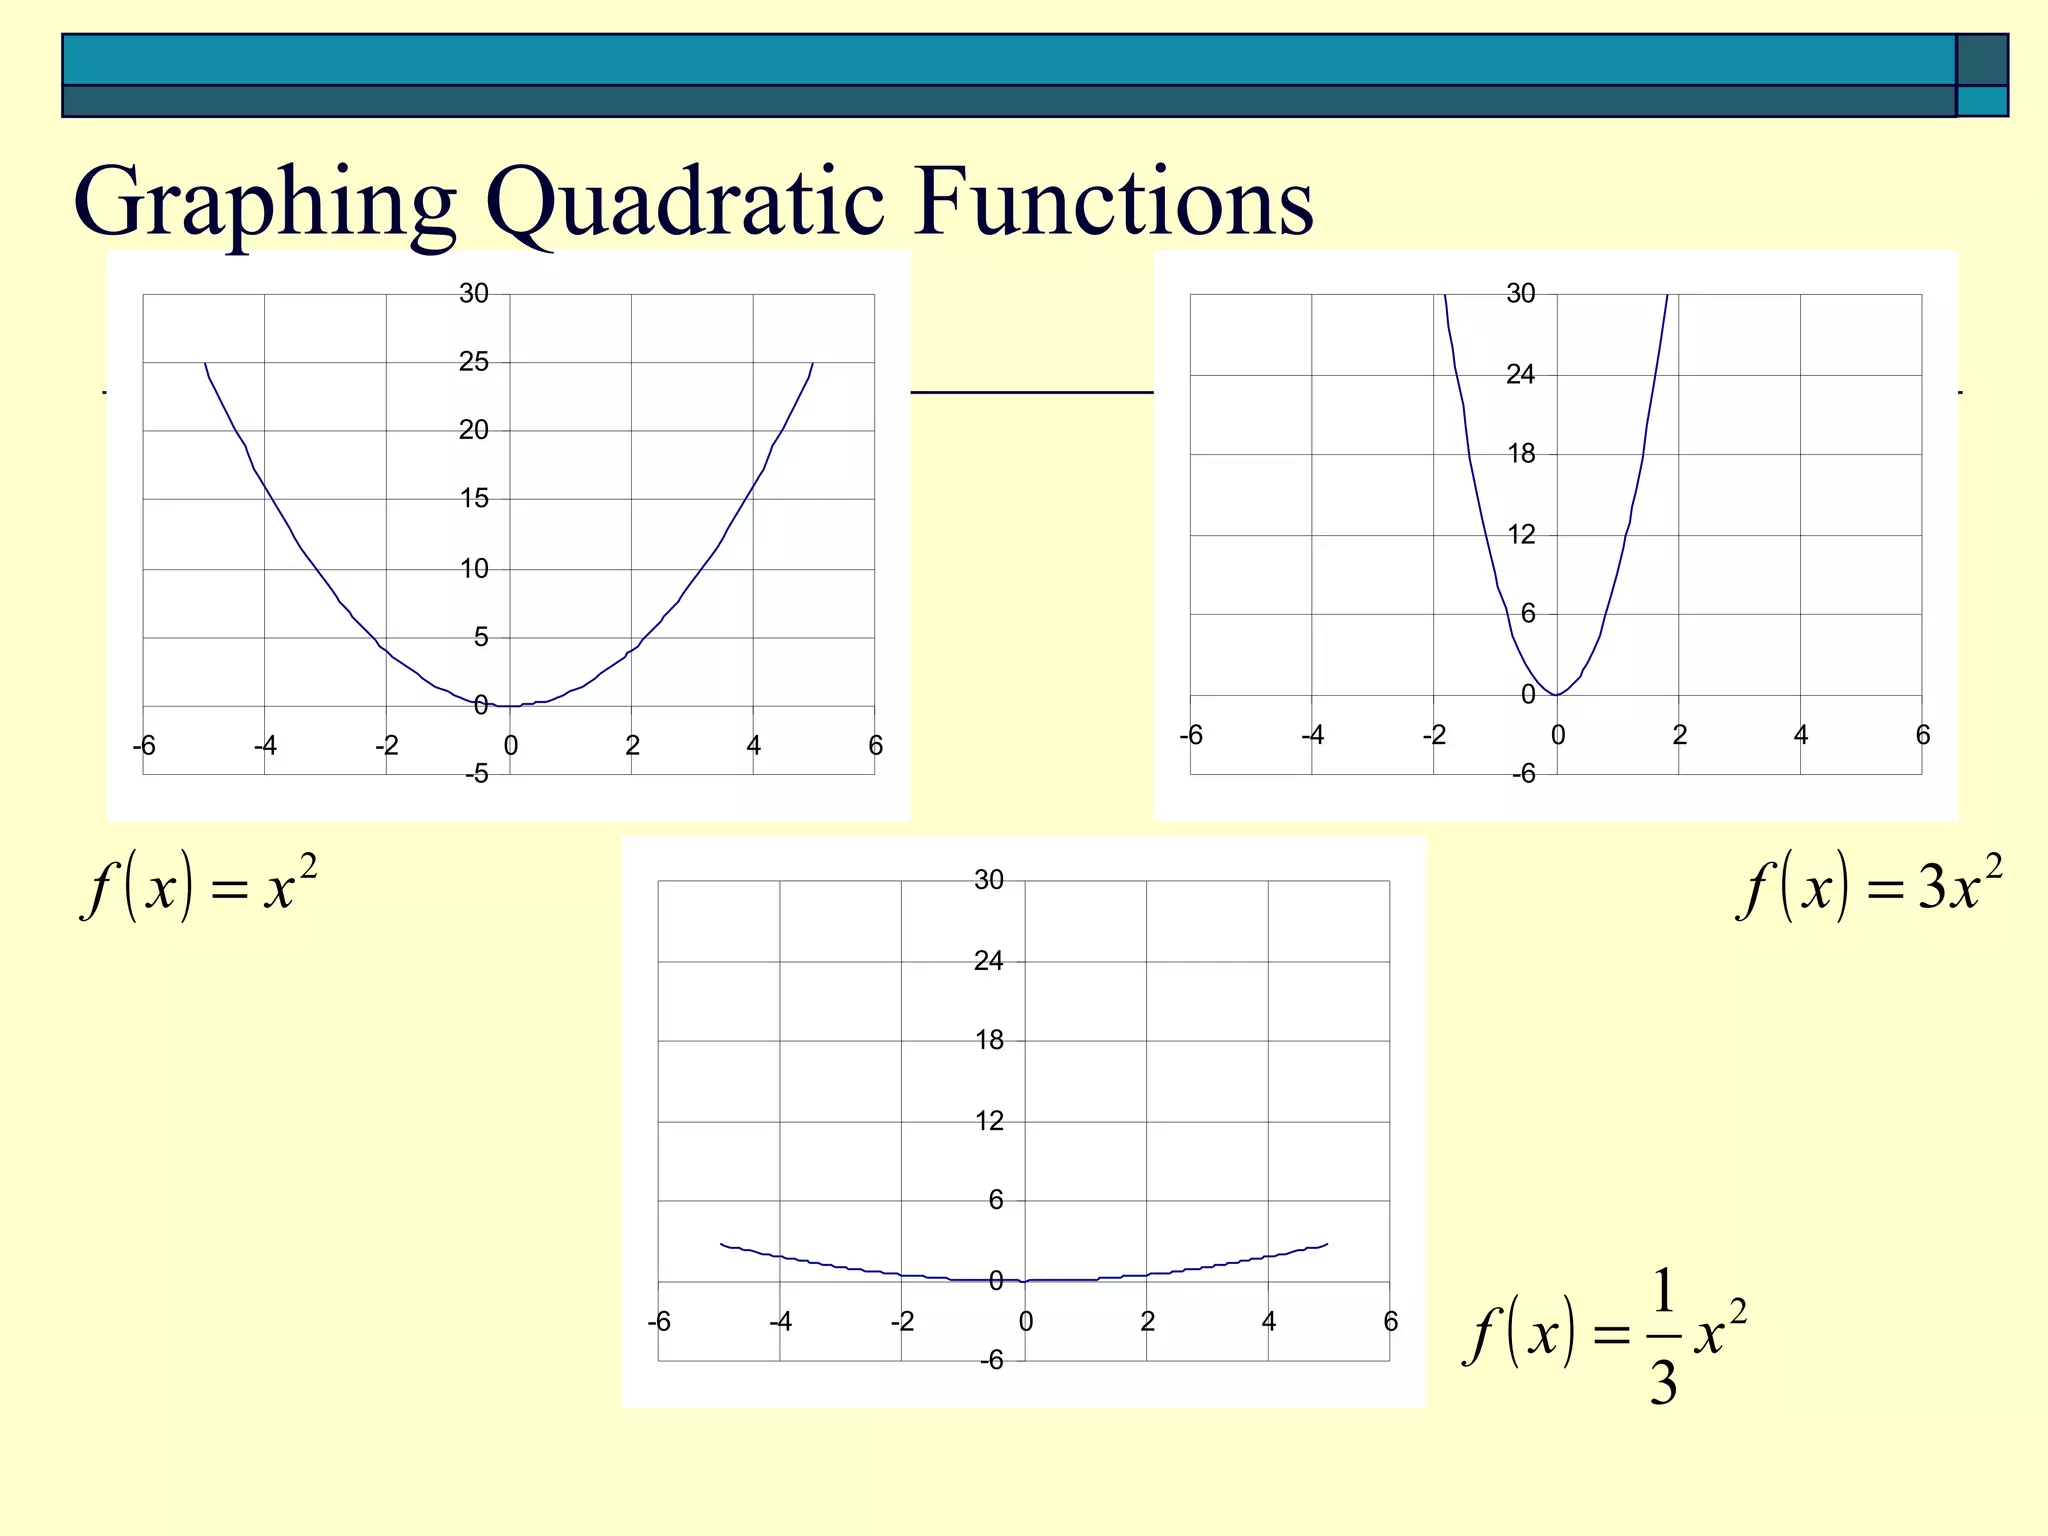
1) The graph of any quadratic function is a parabola.
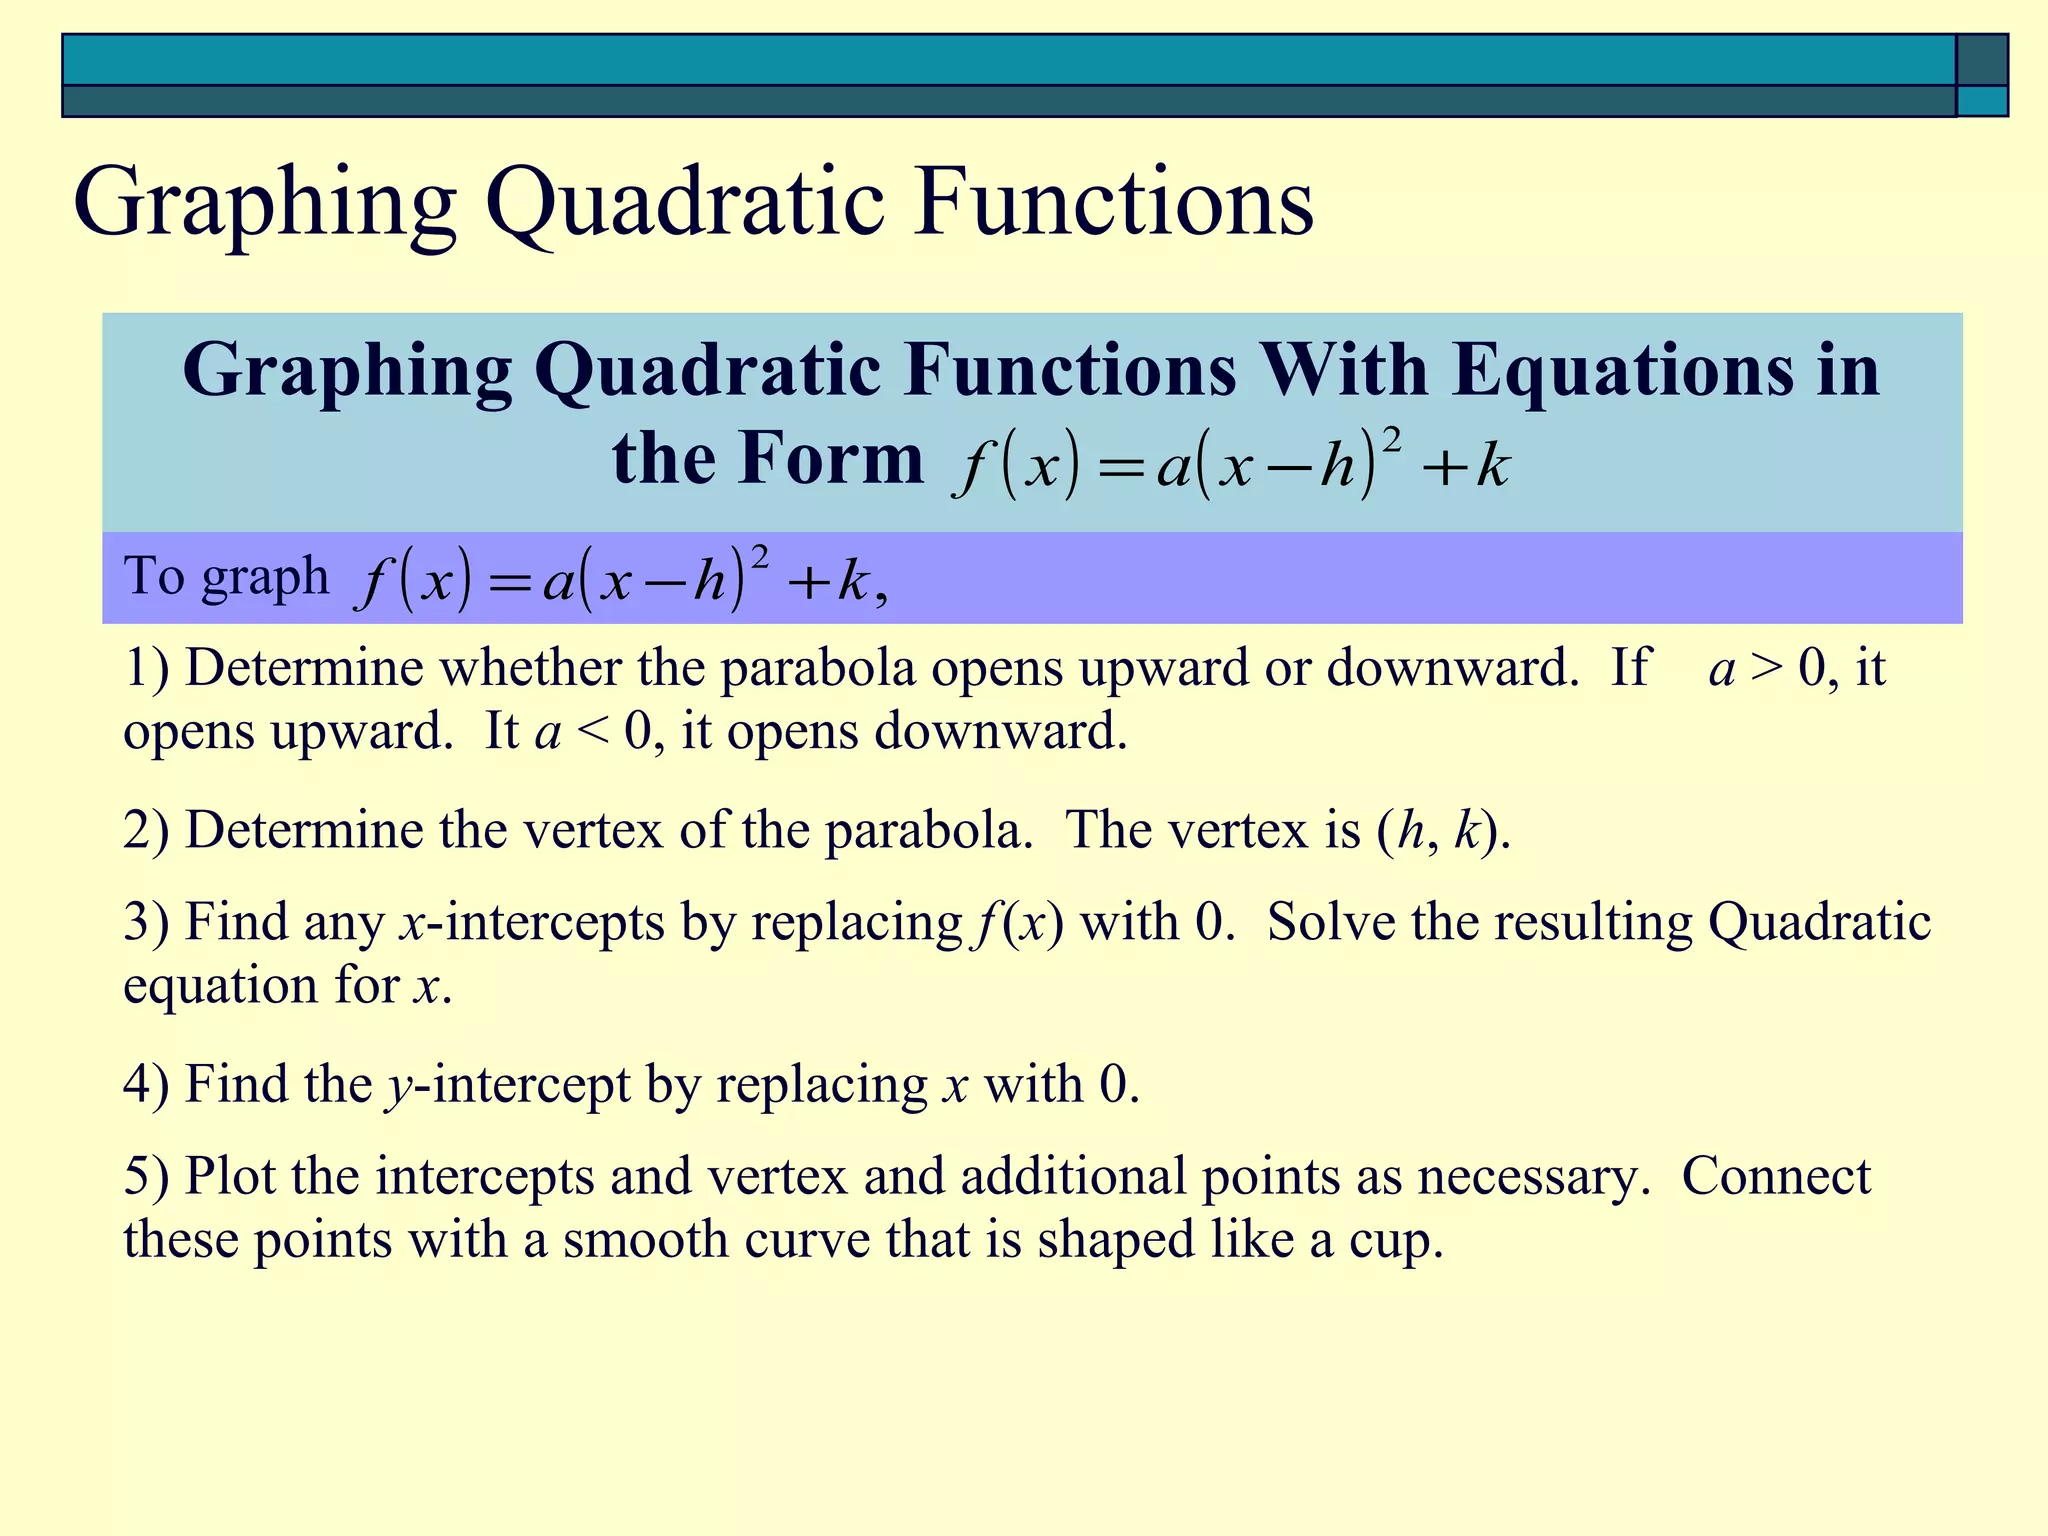
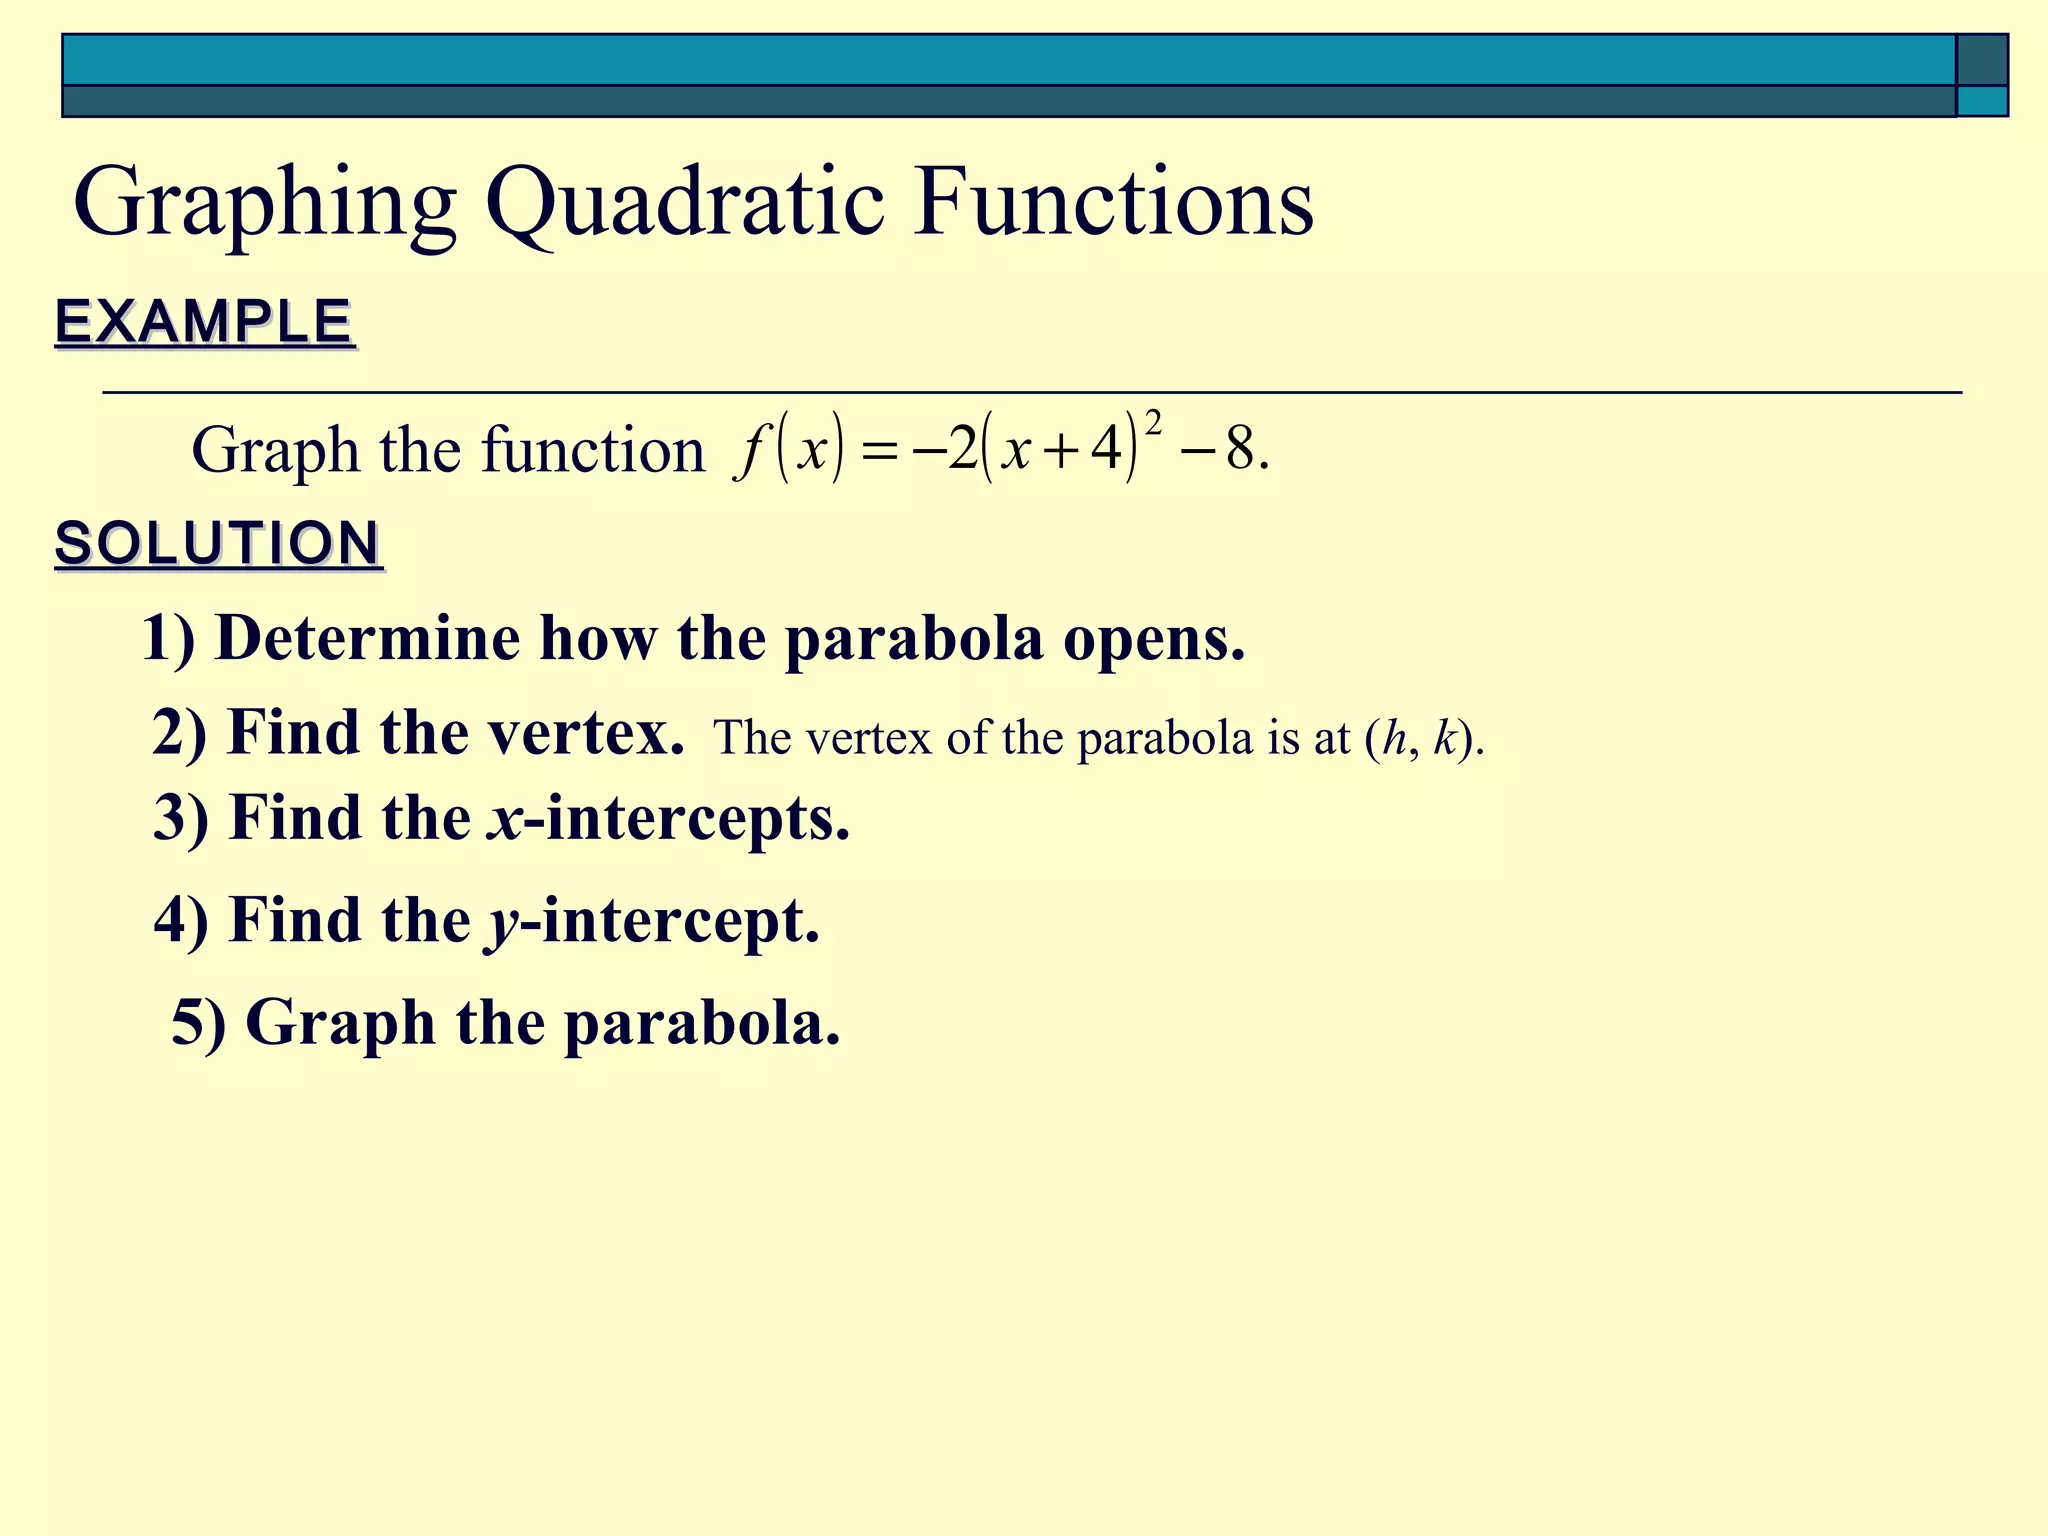
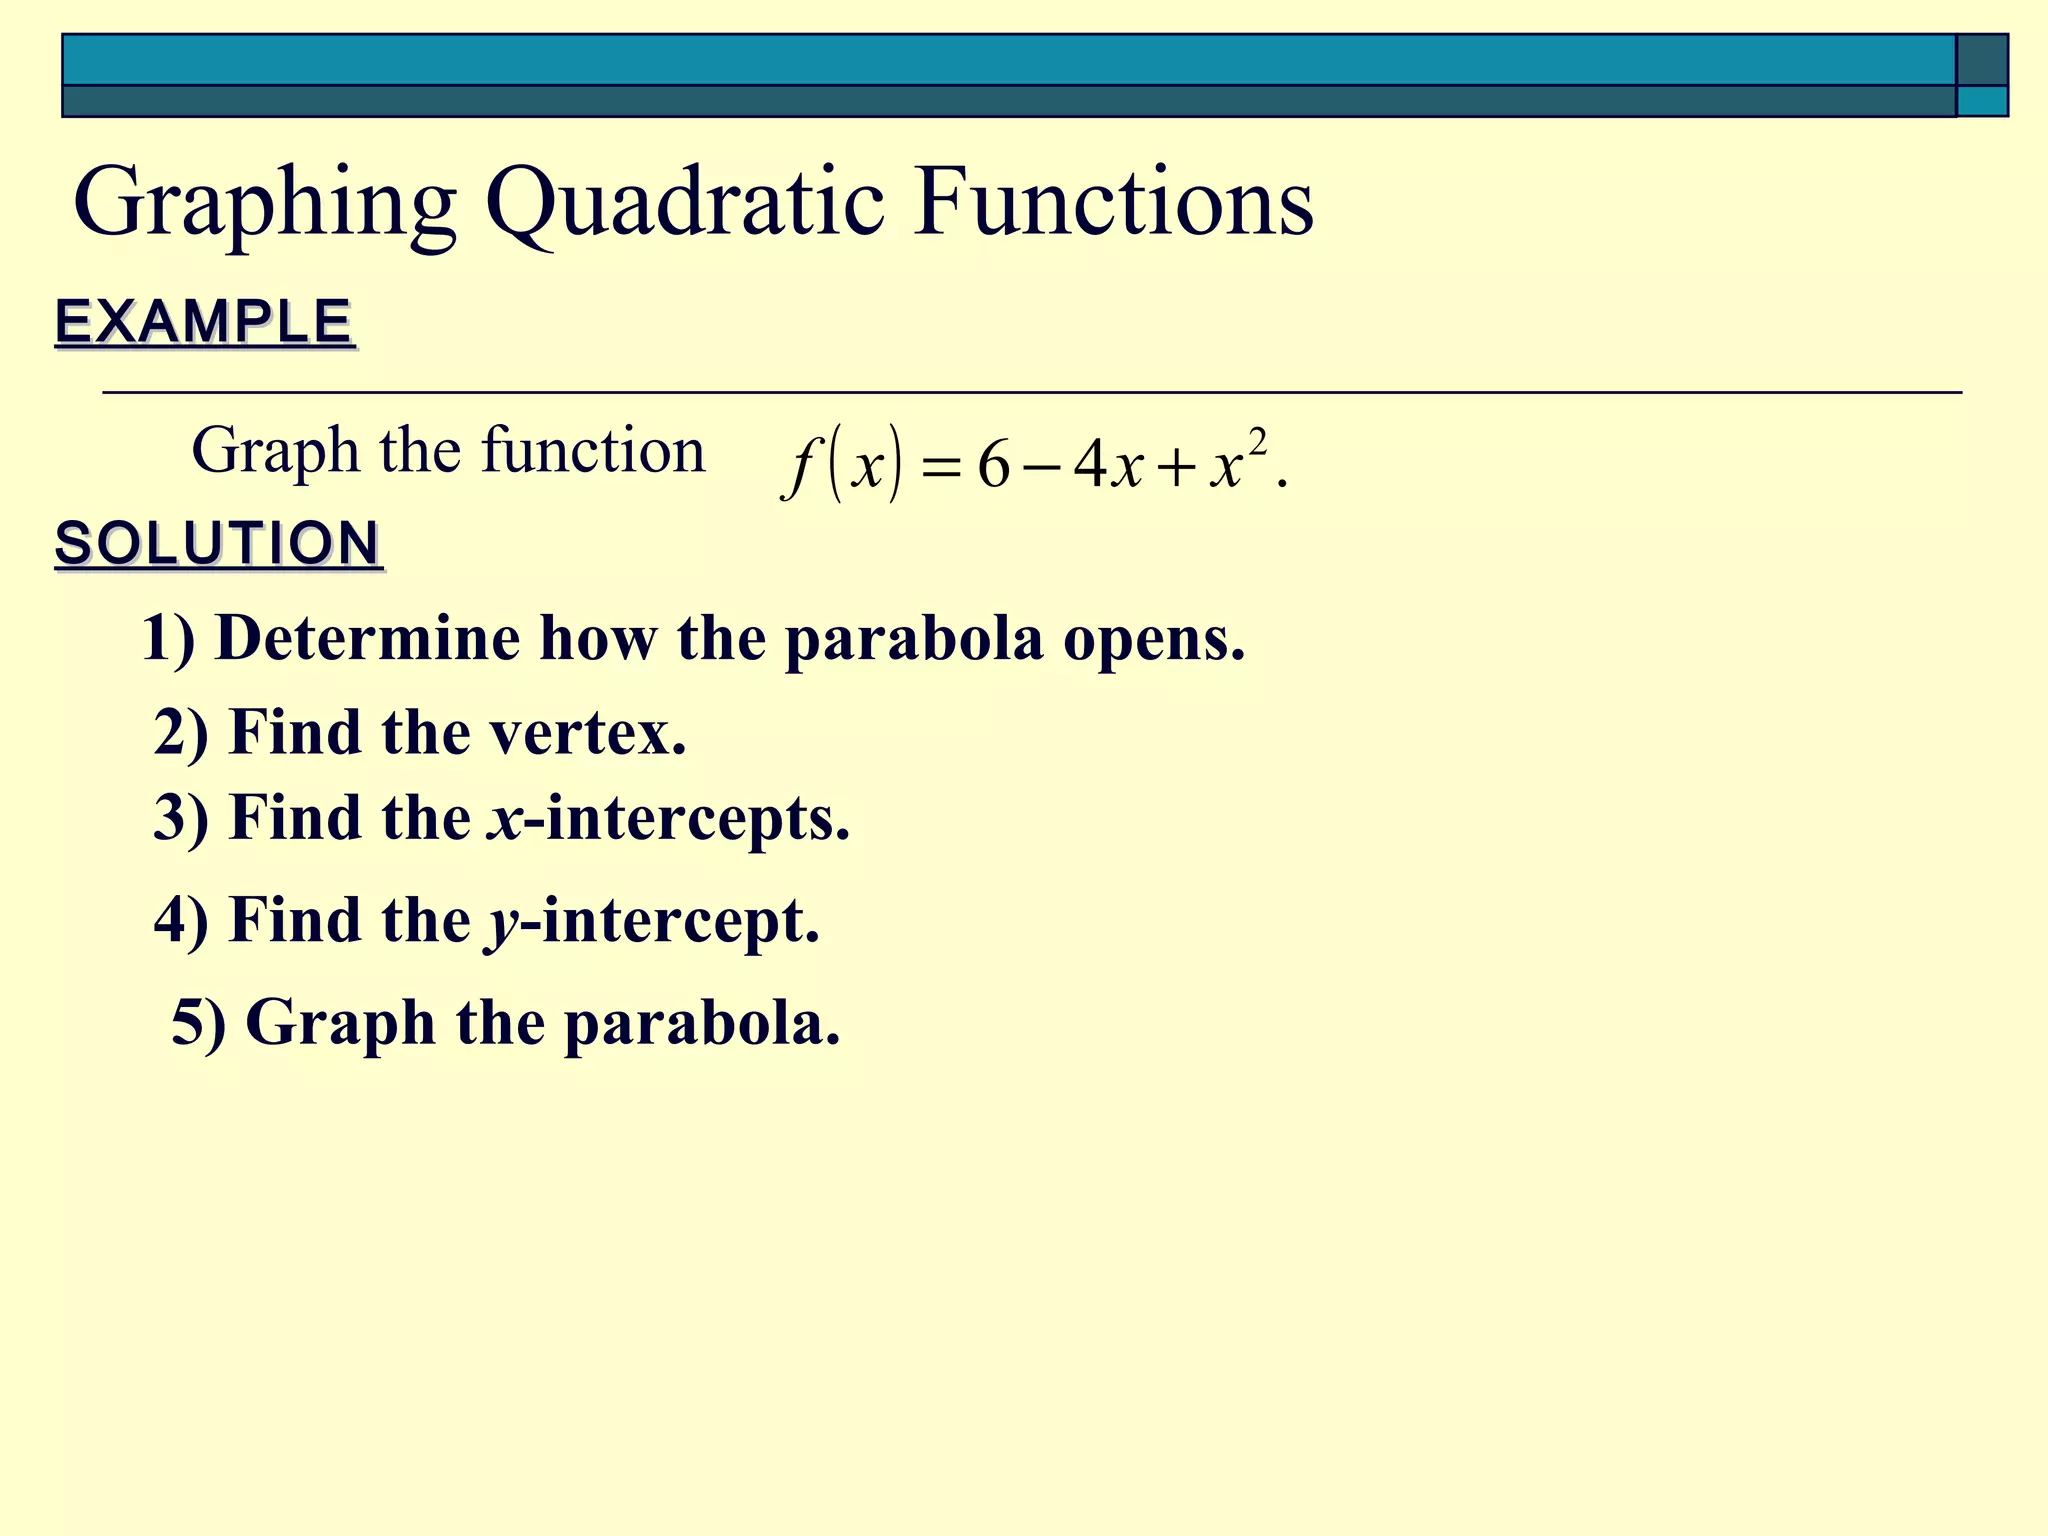
2) To graph f(x) = a(x - h)^2 + k, find the vertex (h, k), x-intercepts by setting f(x) = 0, y-intercept, and plot points to form the parabola shape.
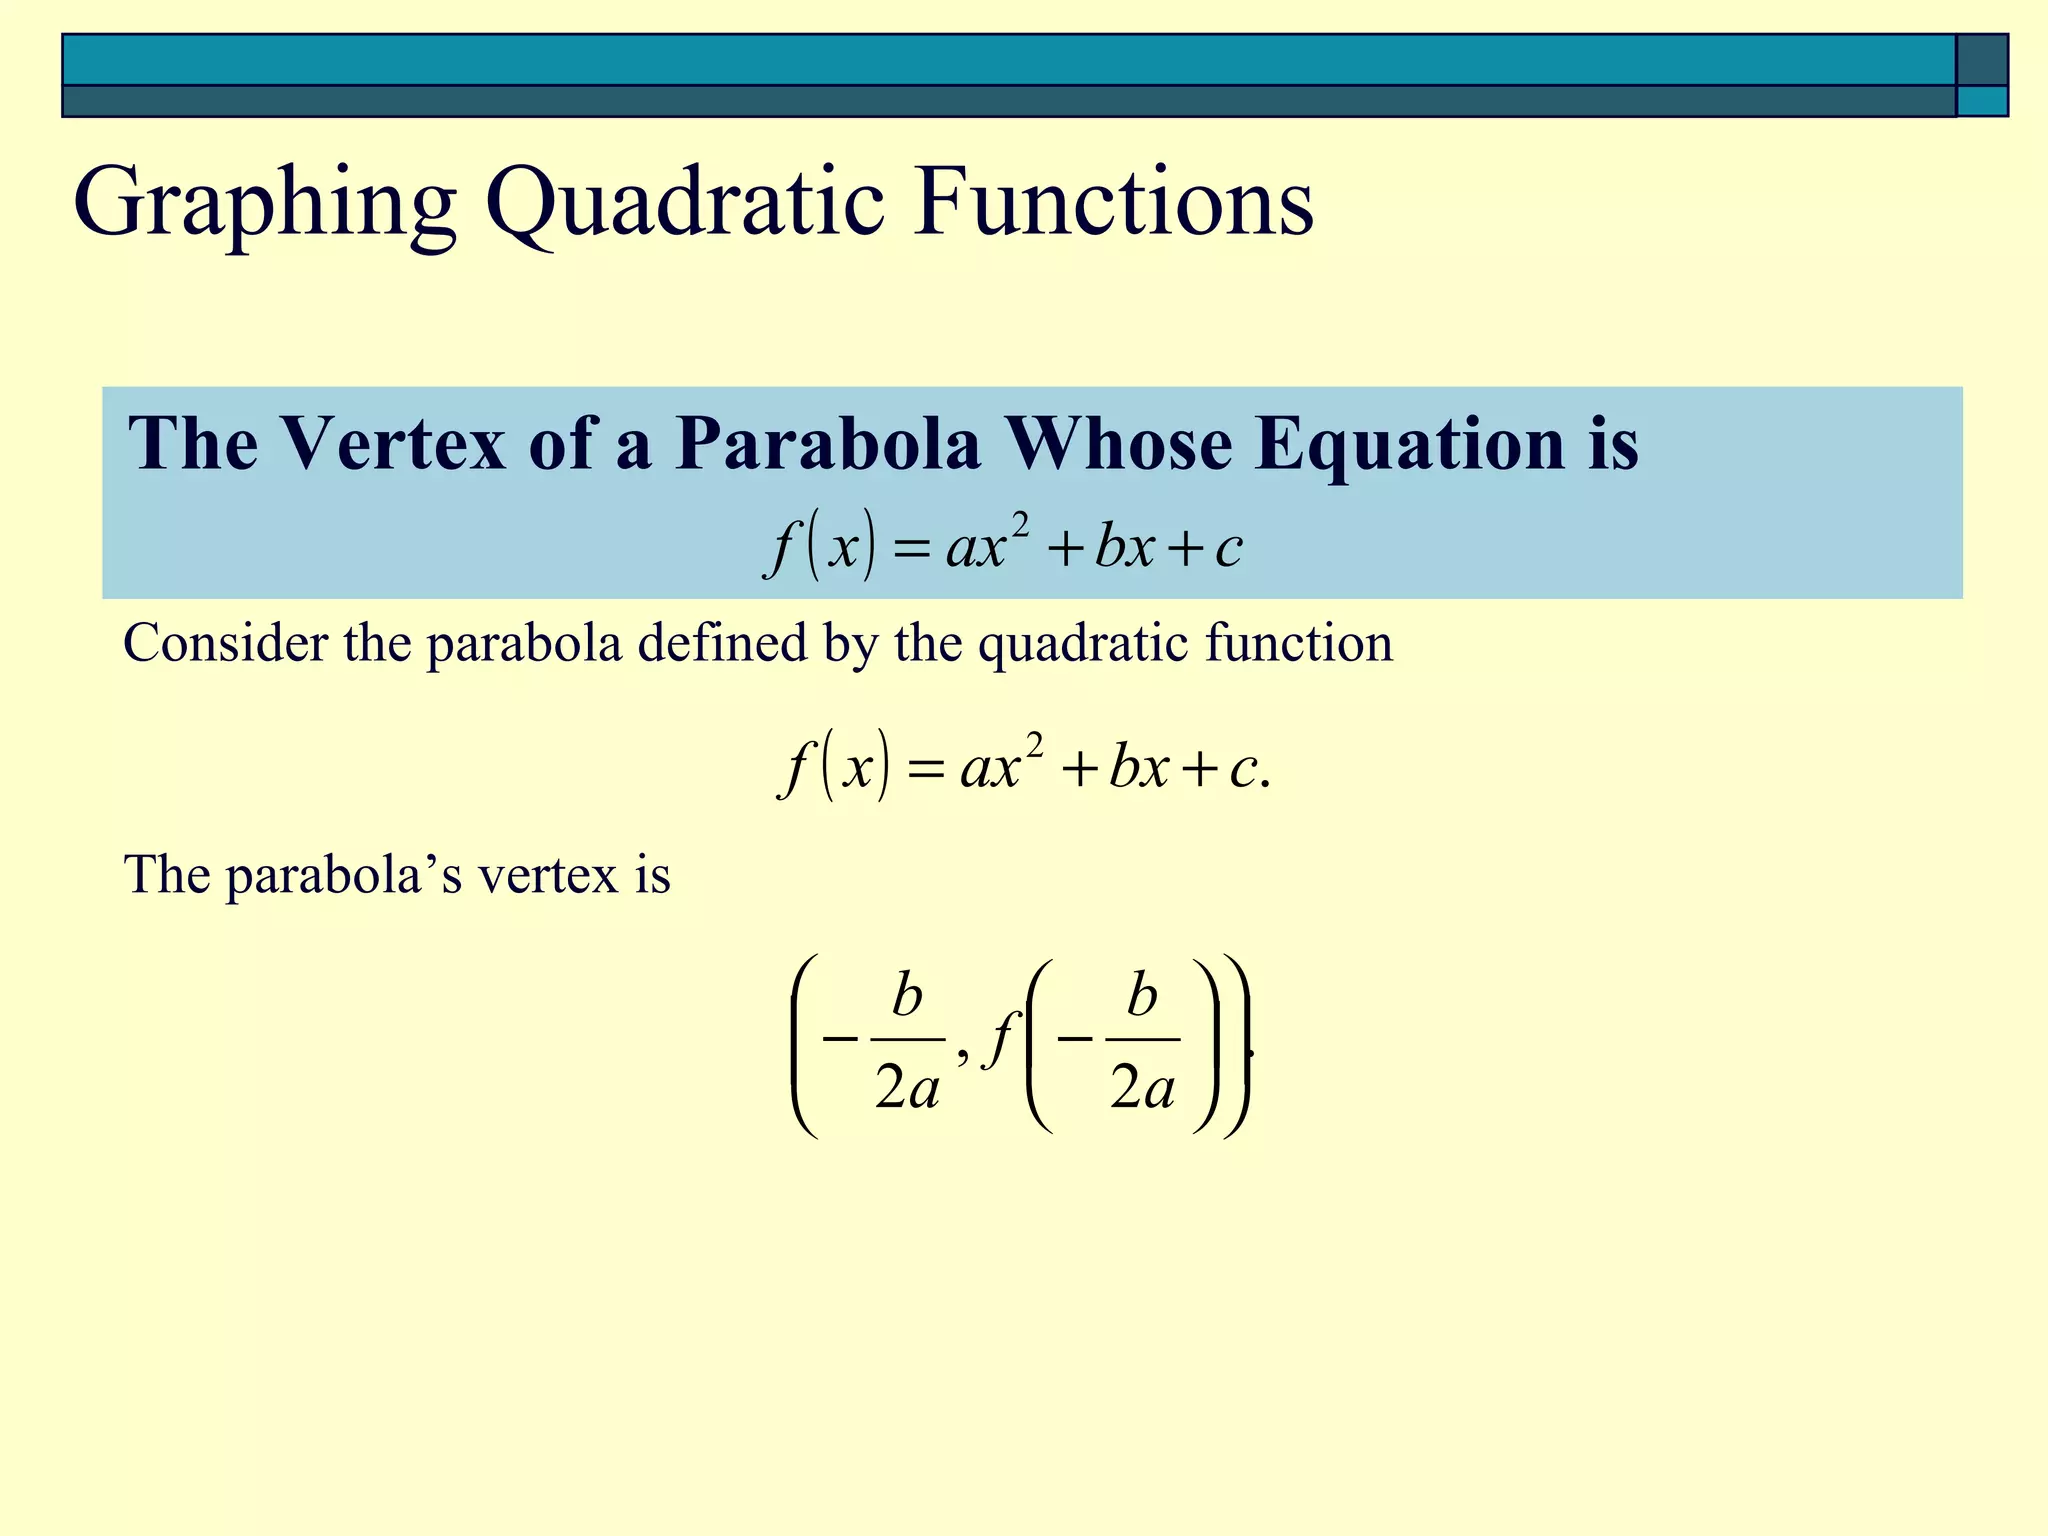
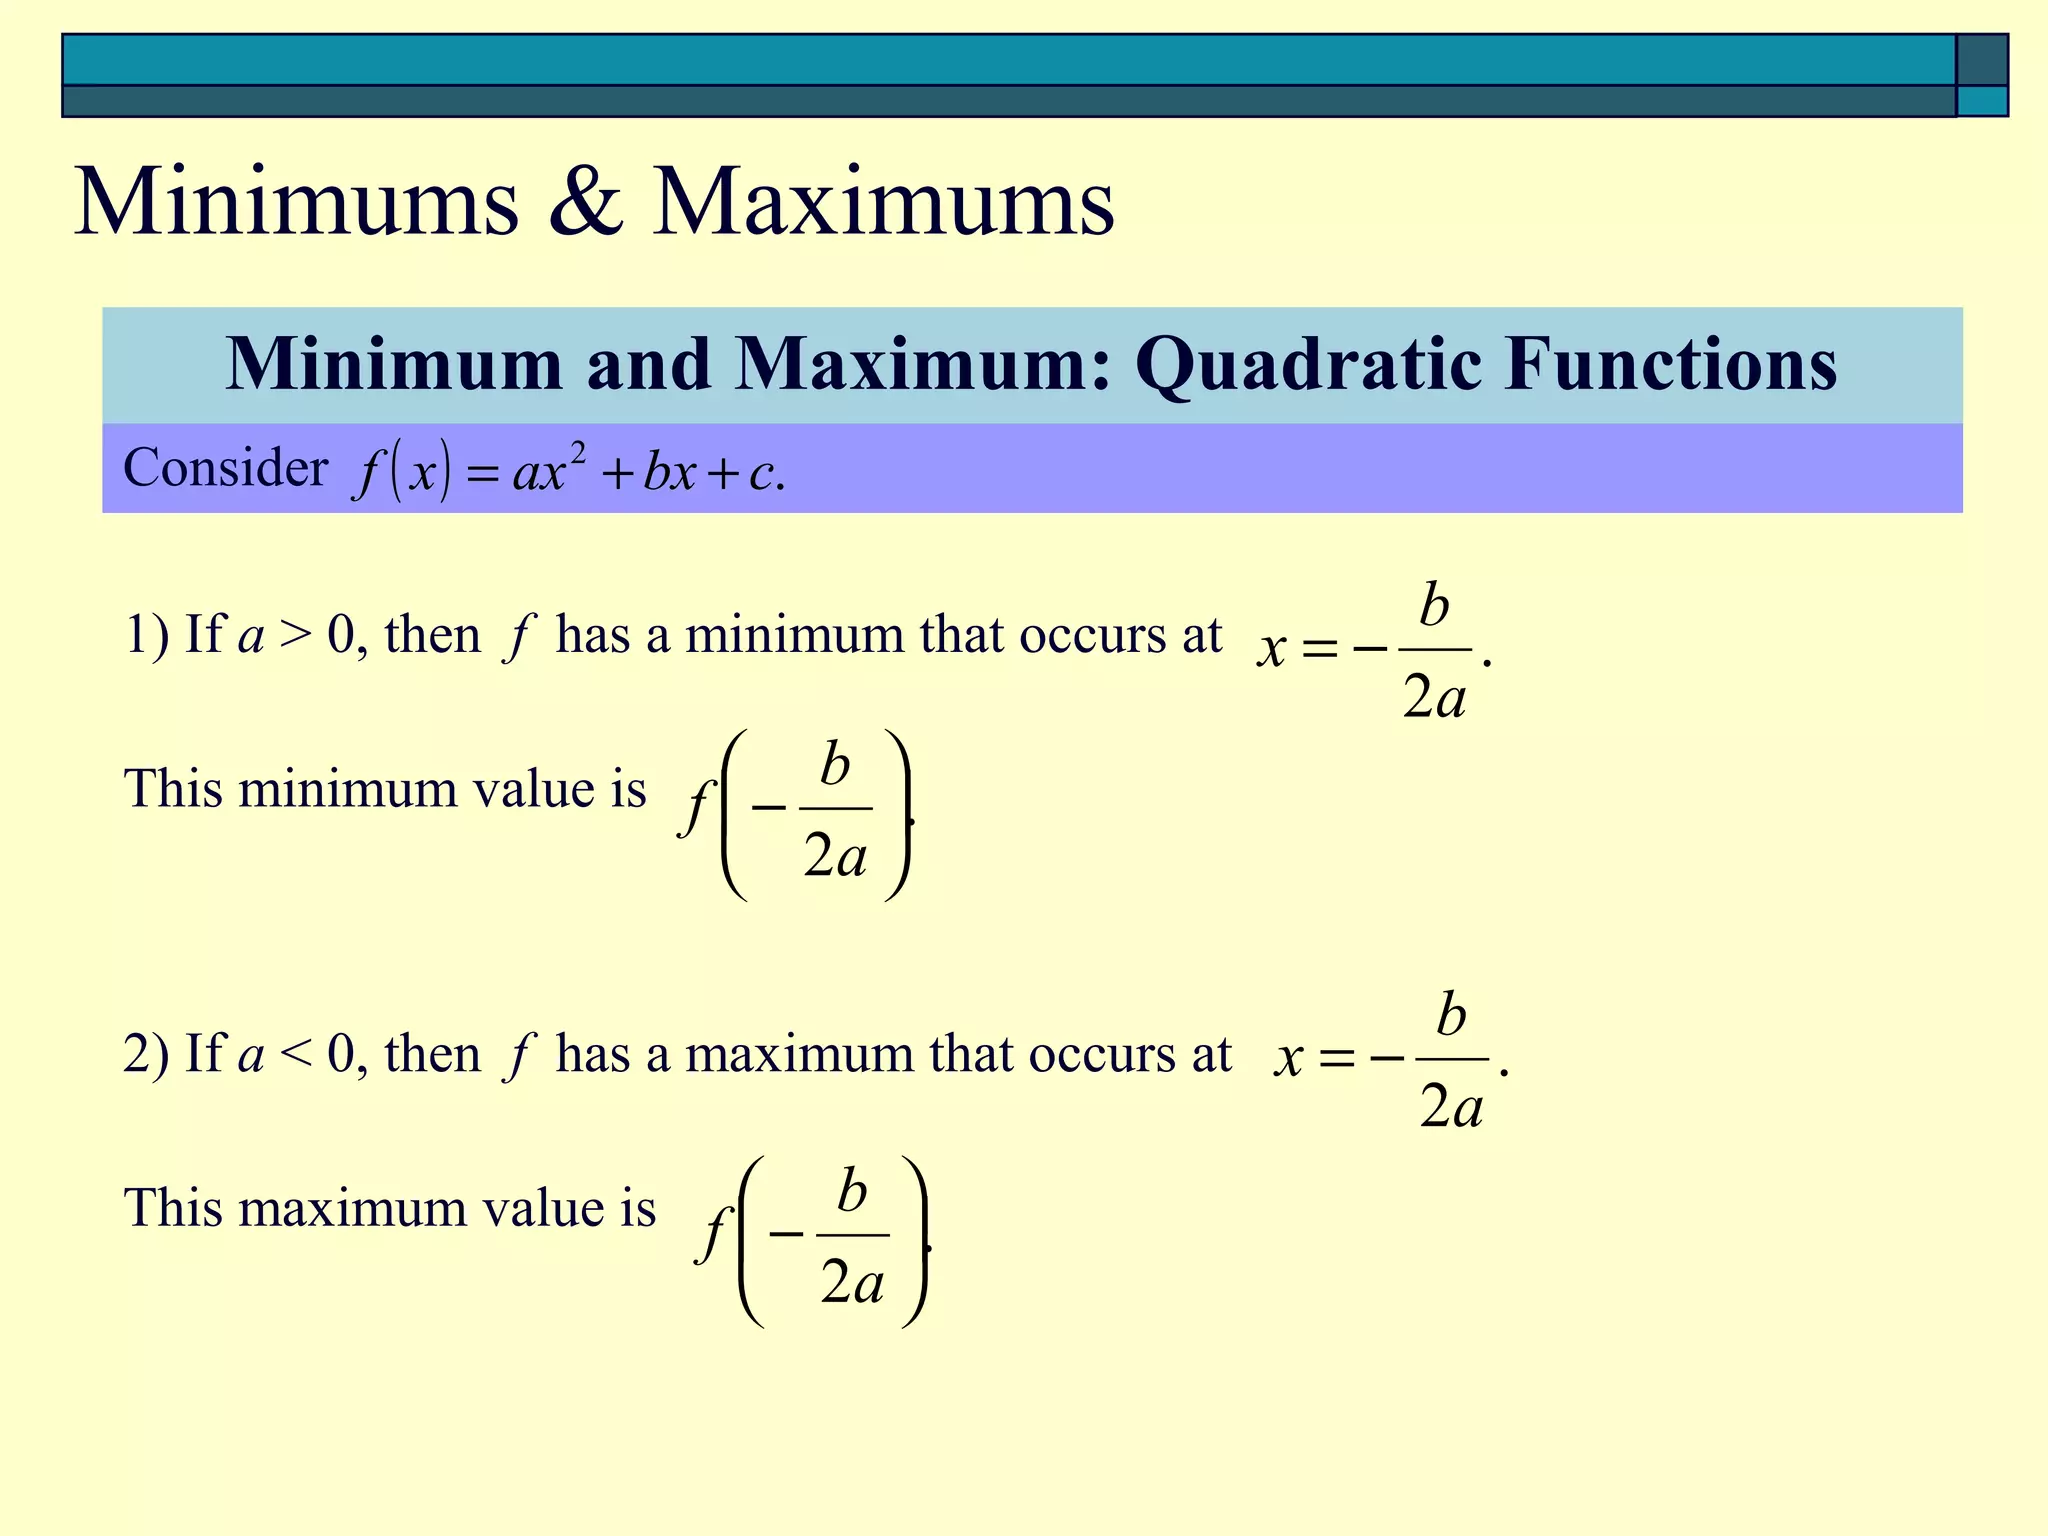
3) The vertex of f(x) = ax^2 + bx + c is (-b/2a, f(-b/2a)), which is the minimum if a > 0 and maximum if a