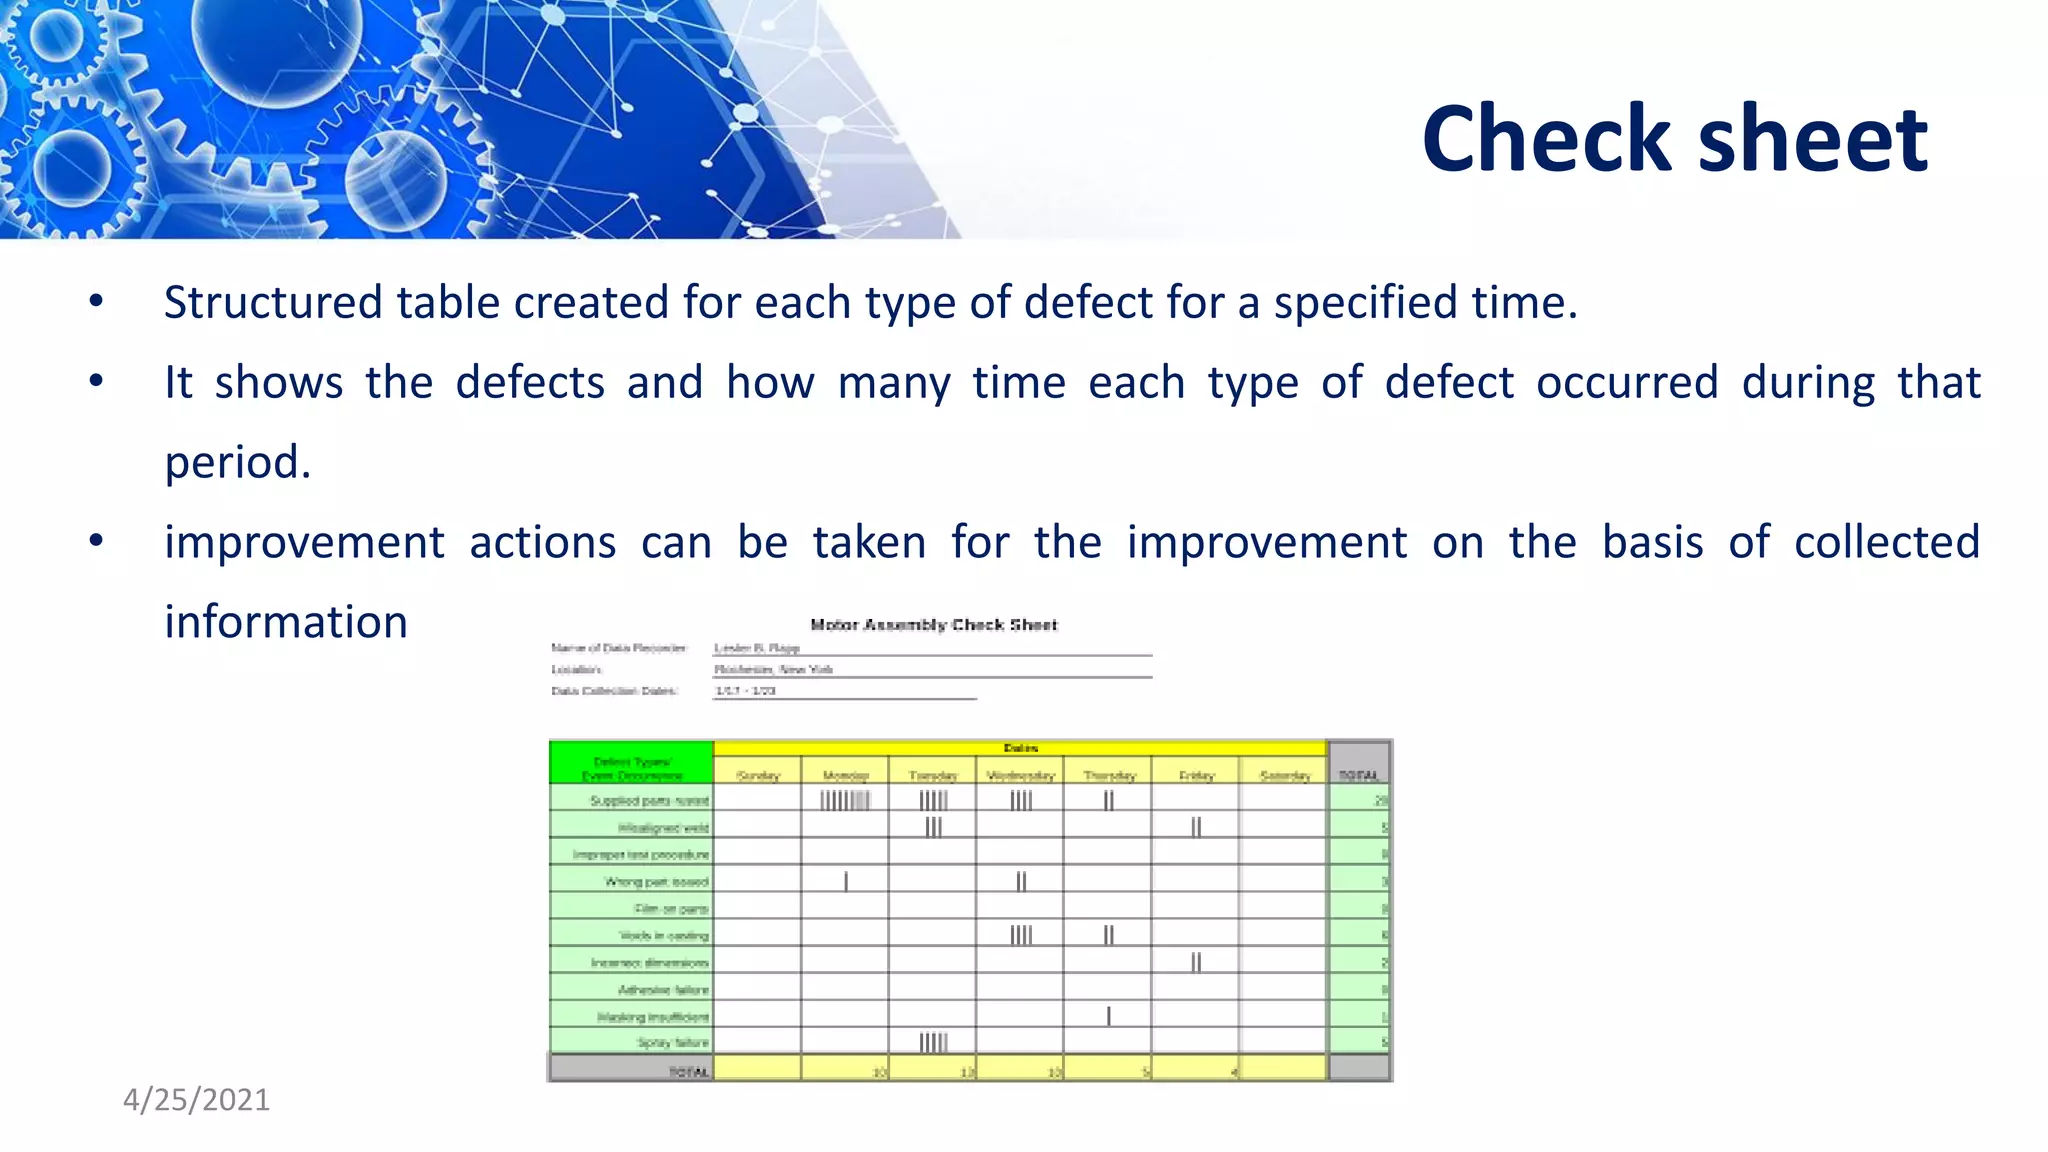
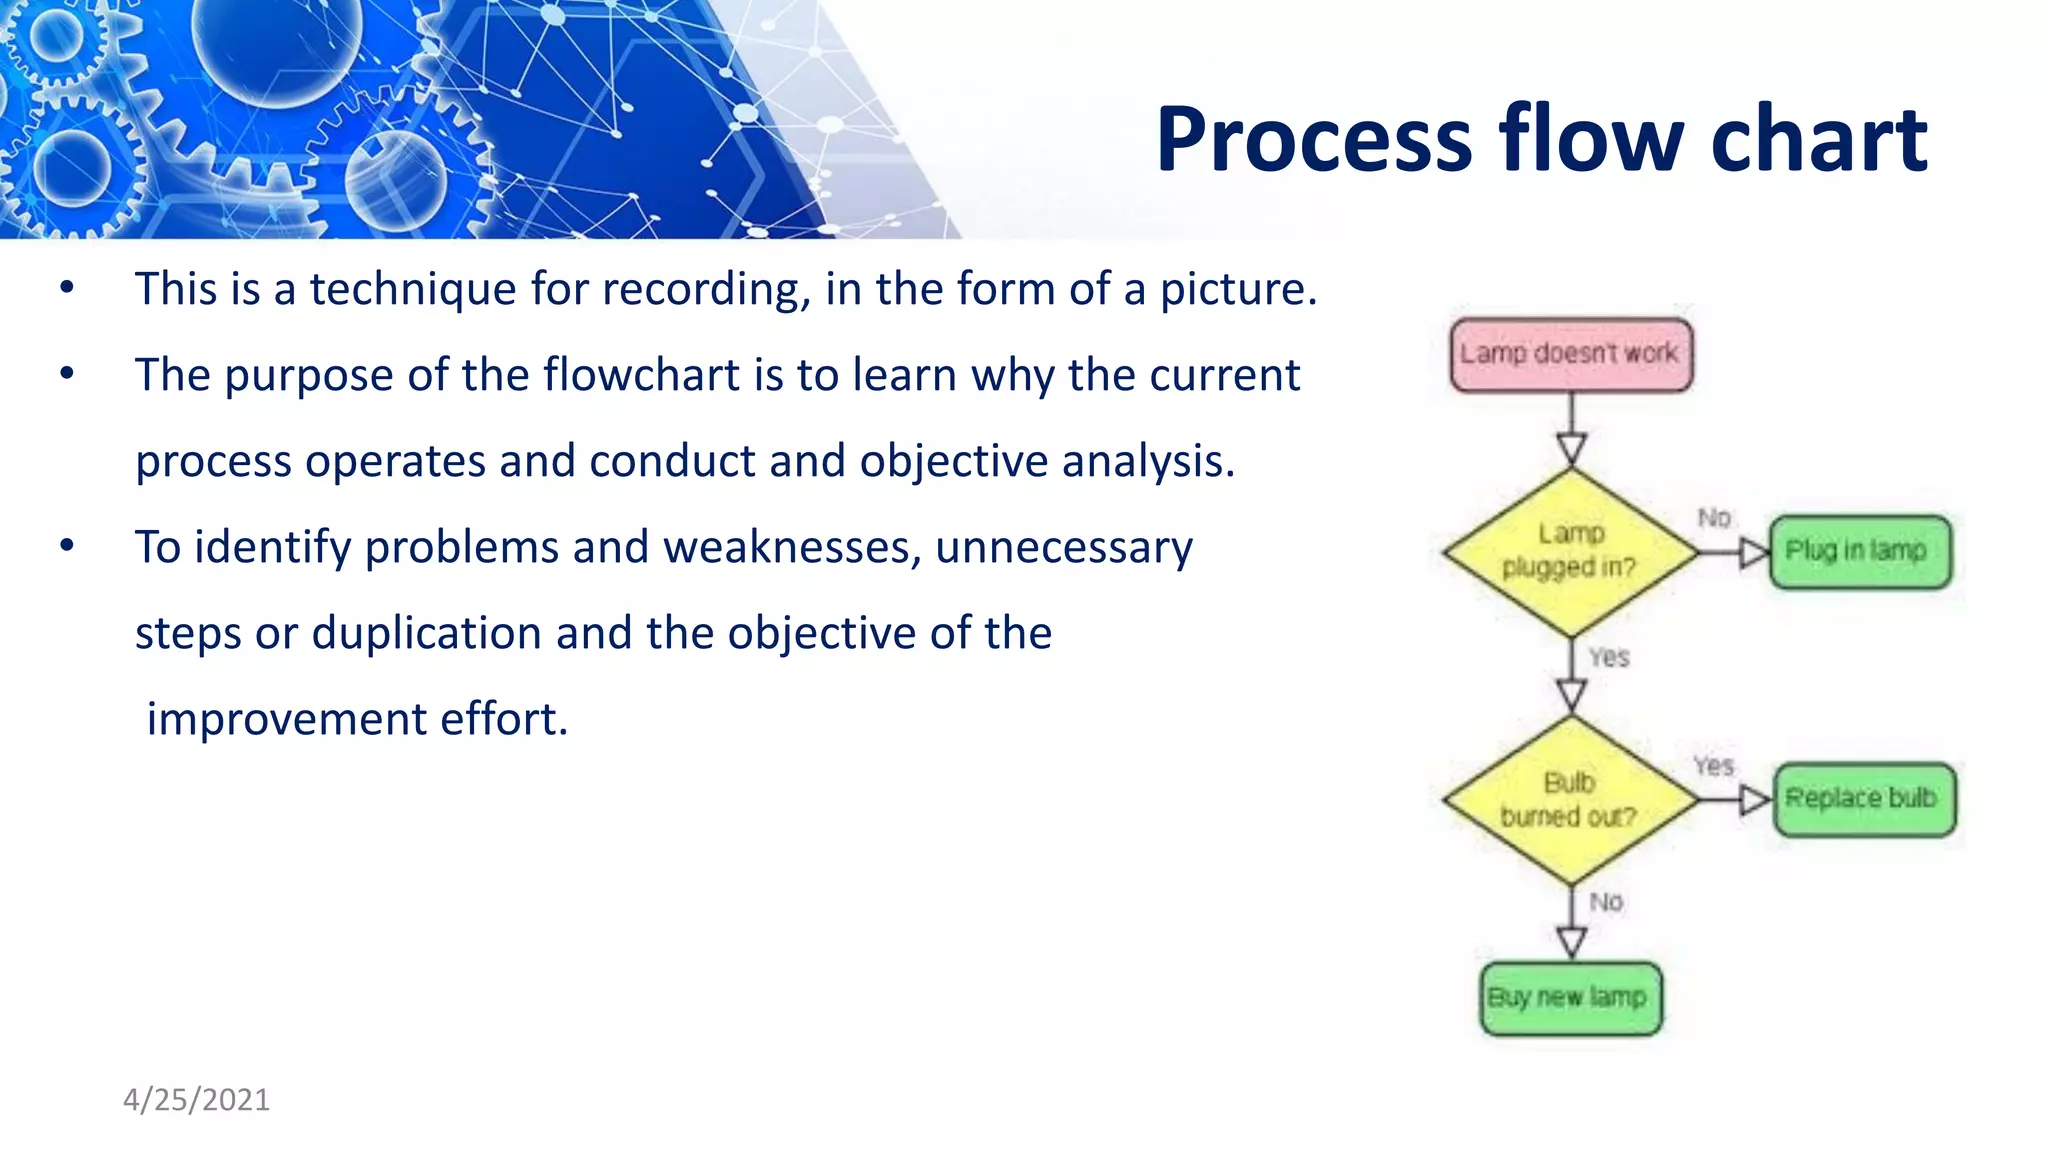
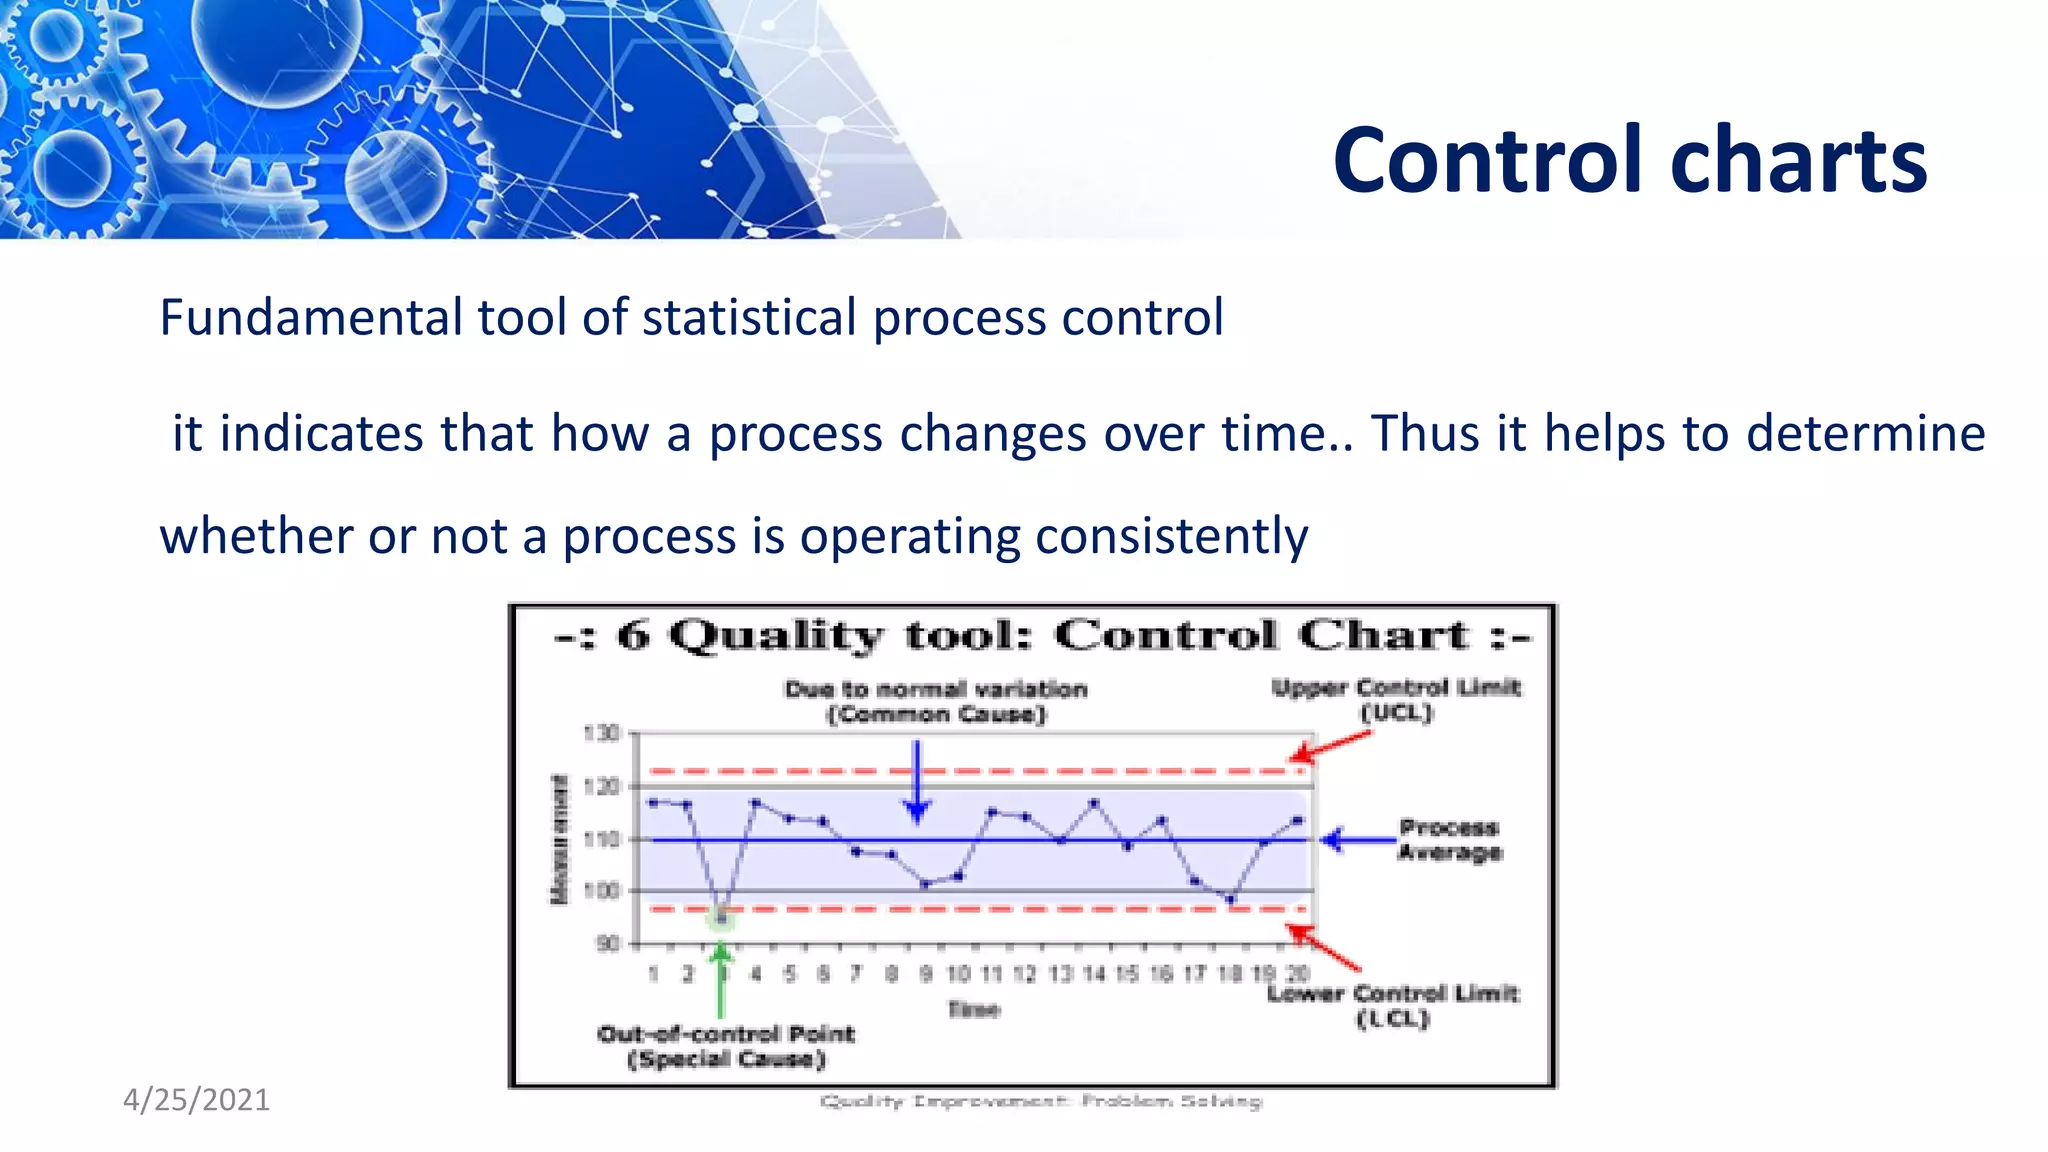
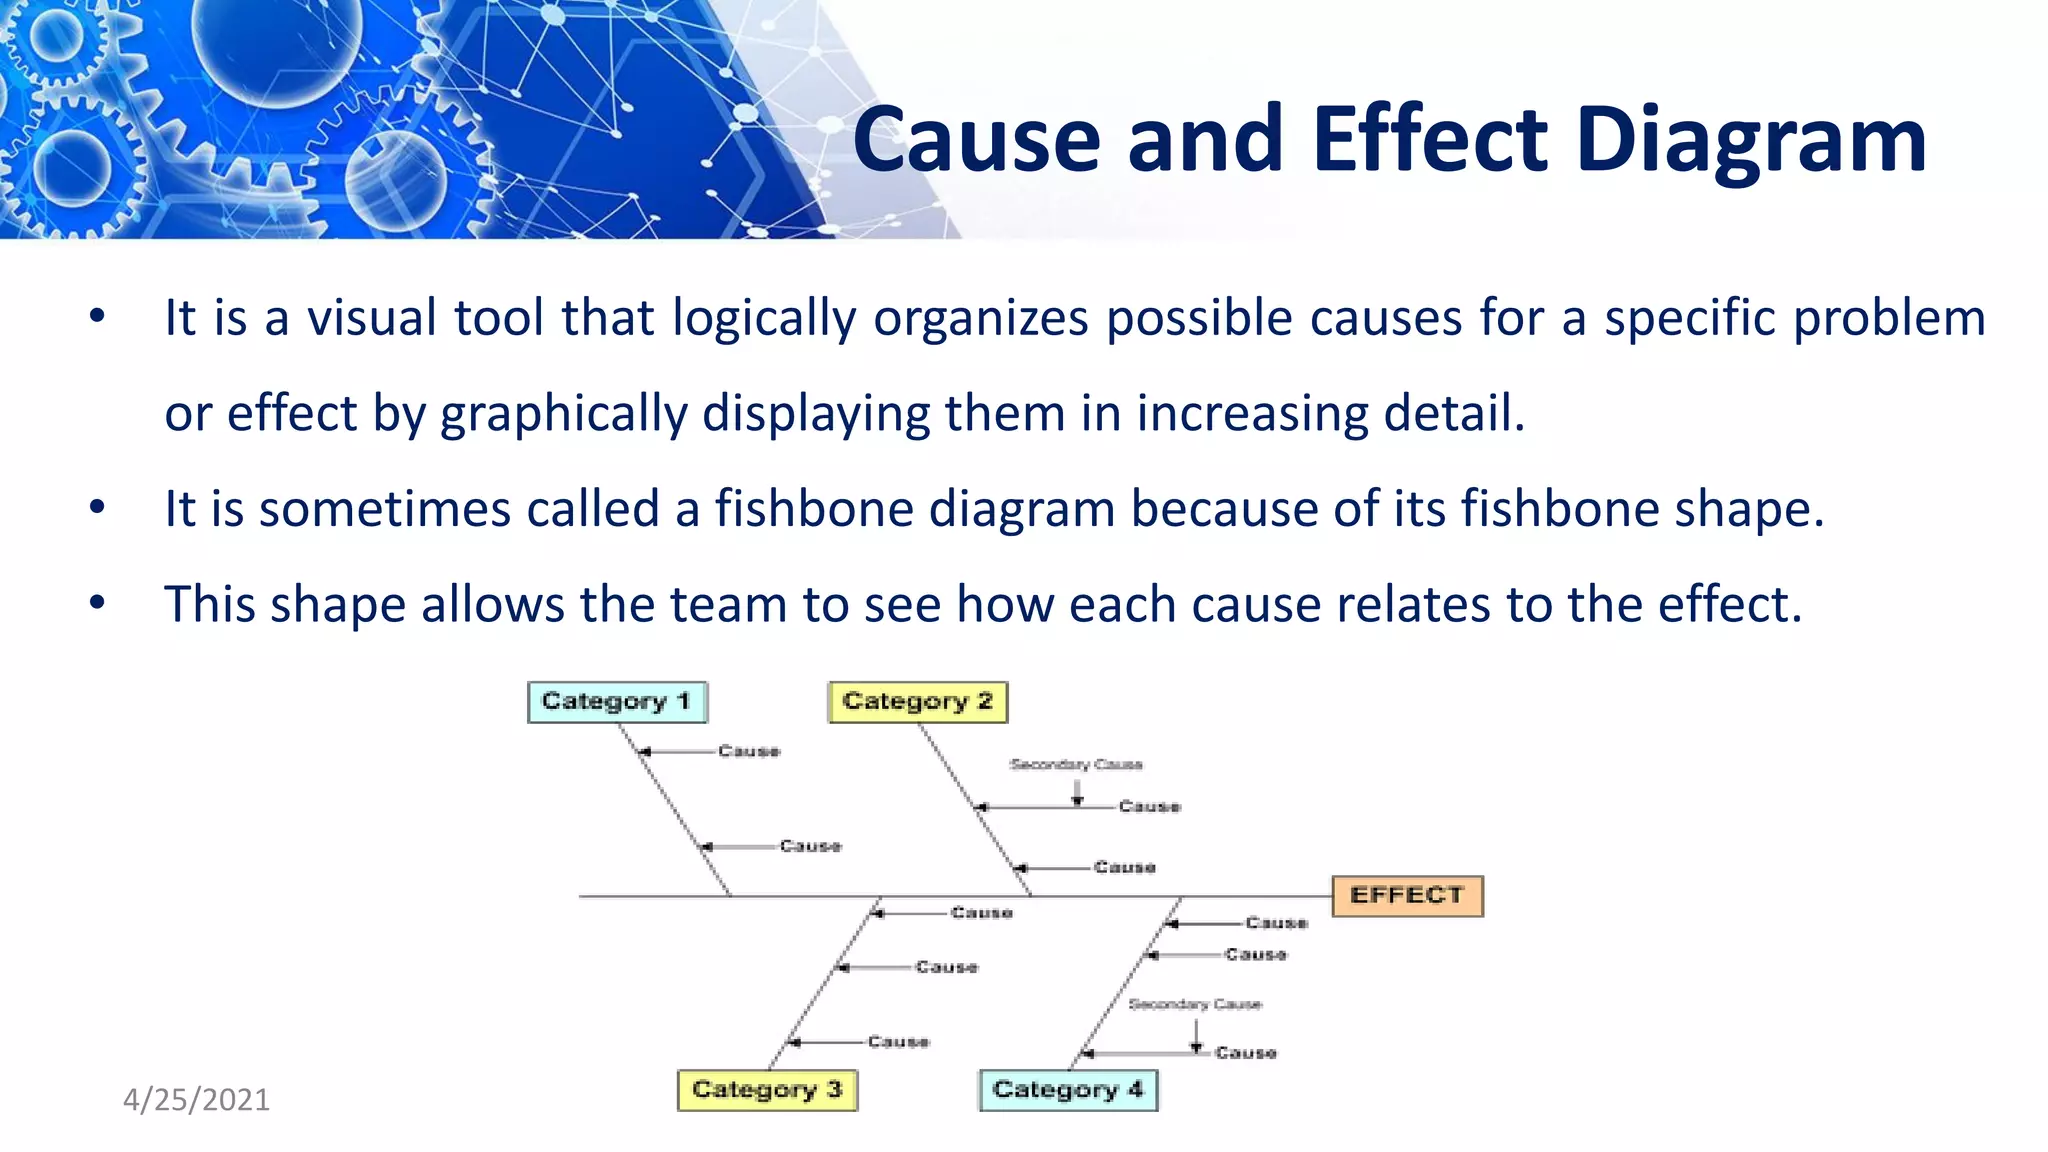
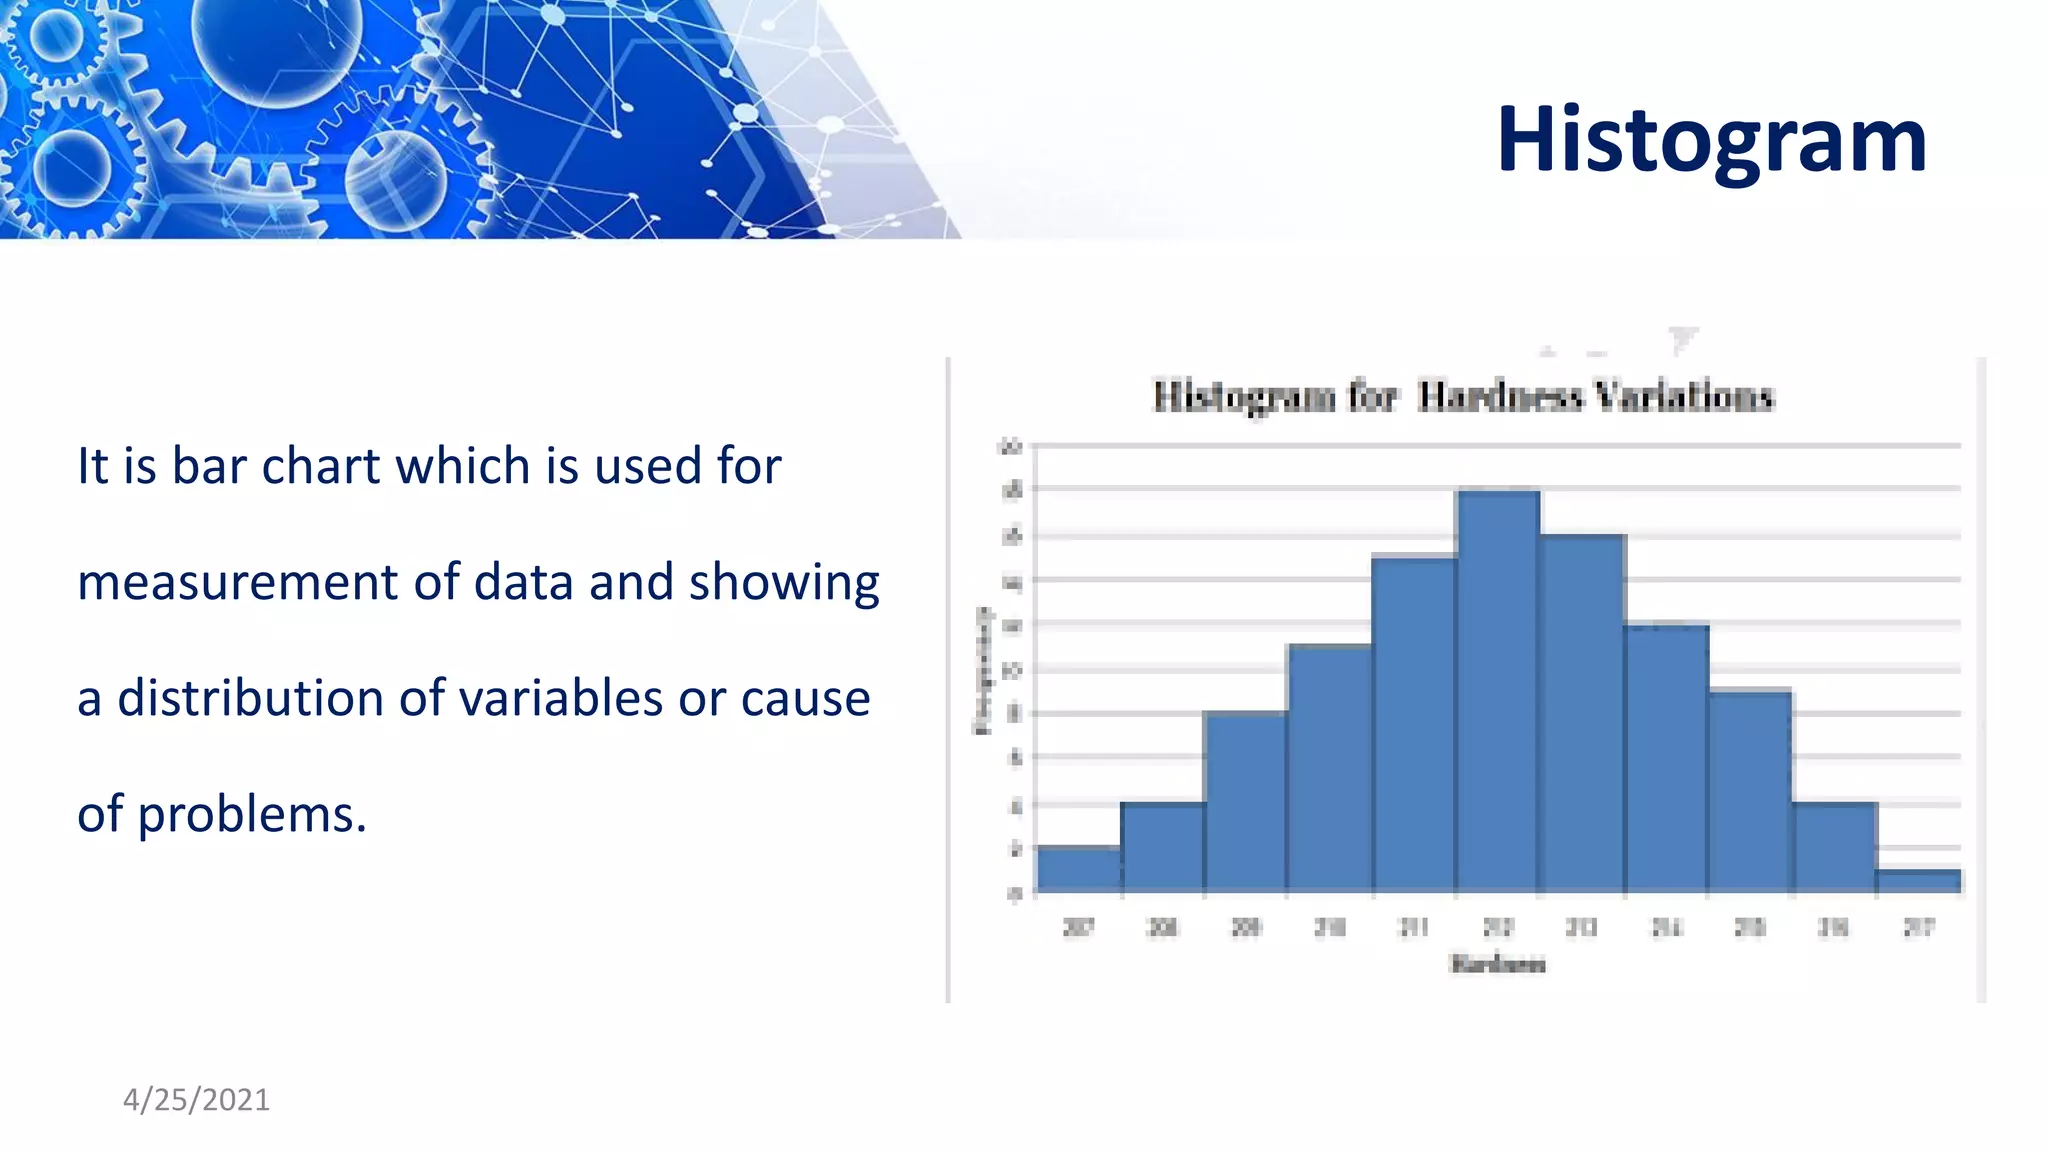
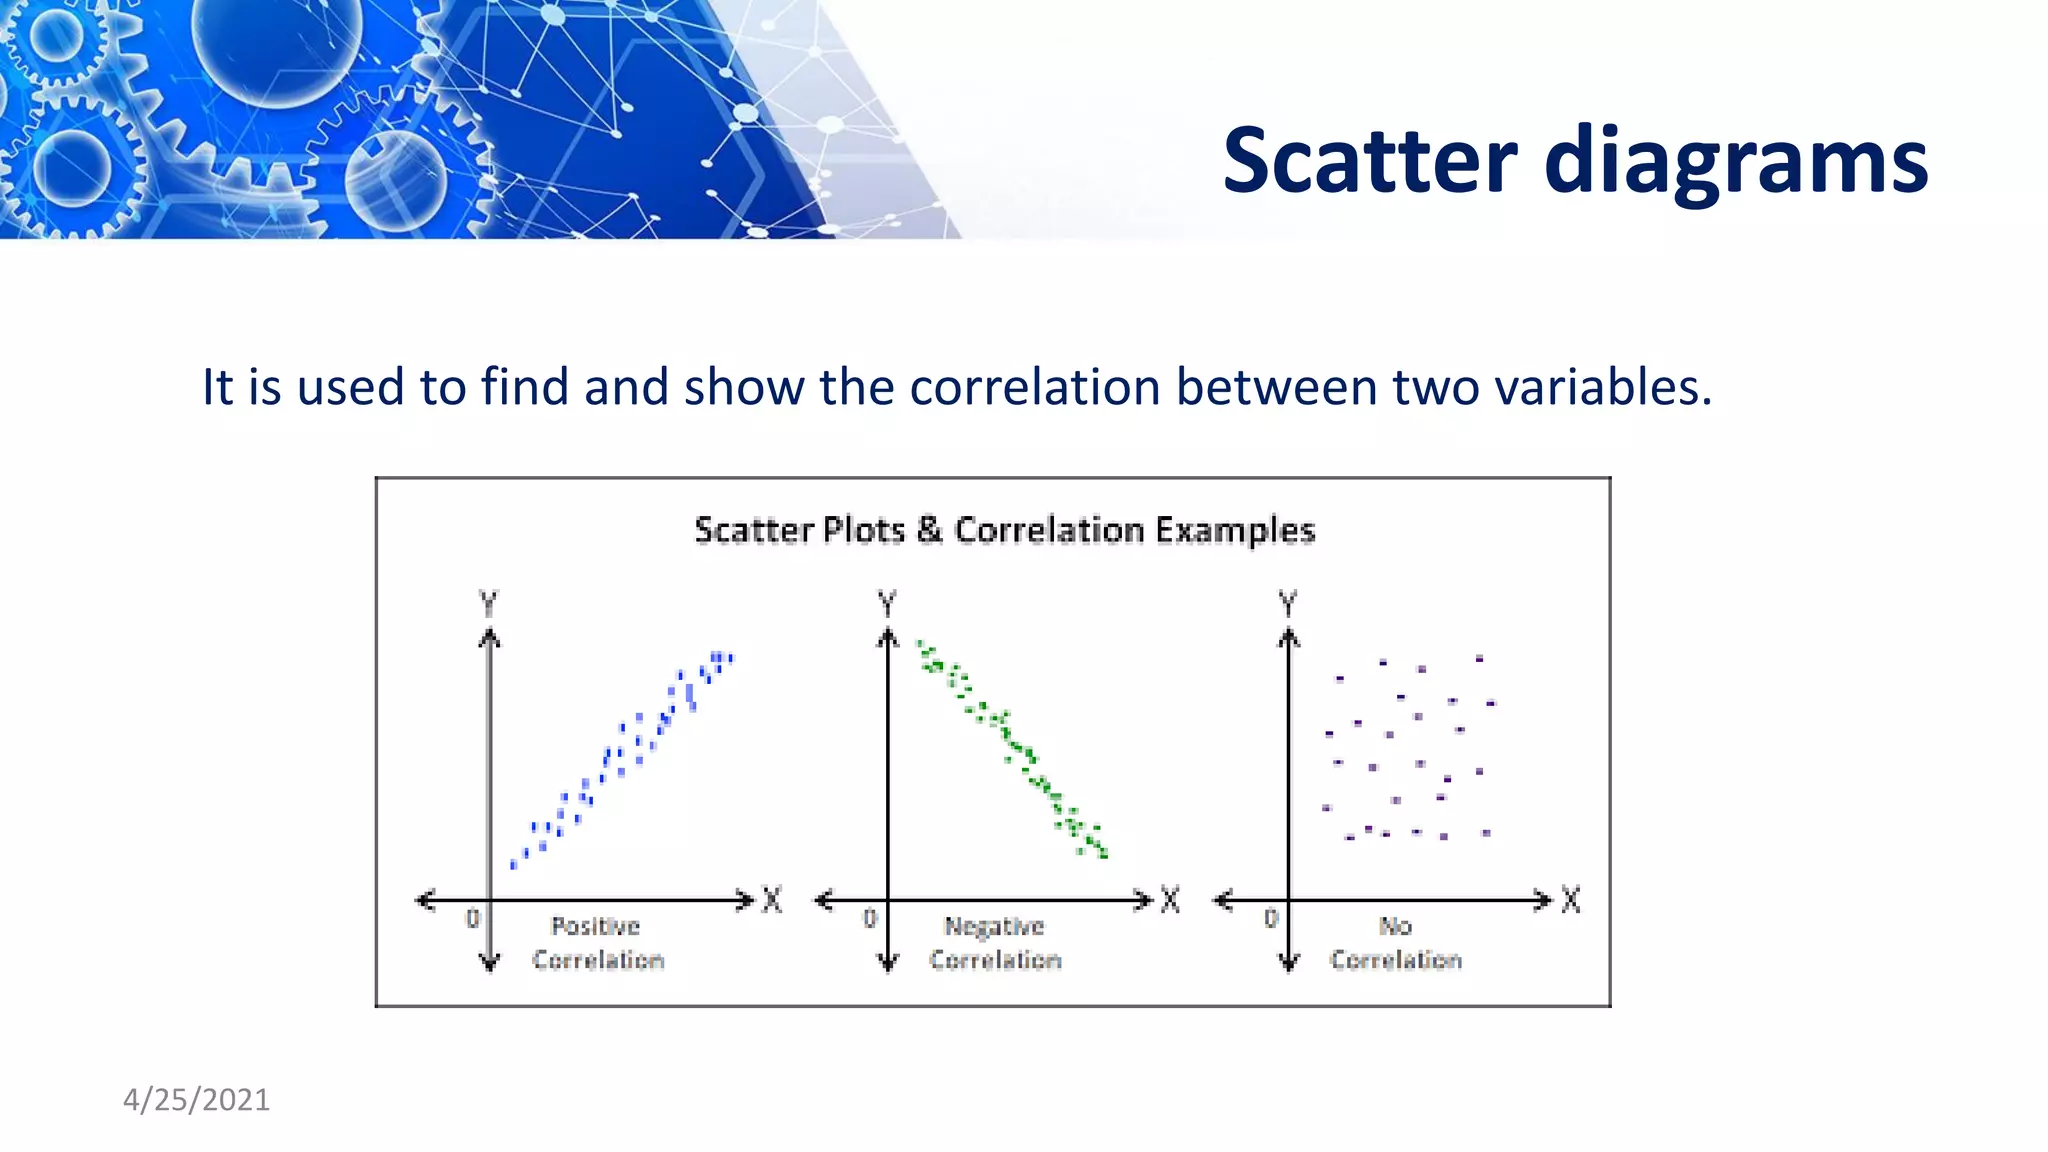
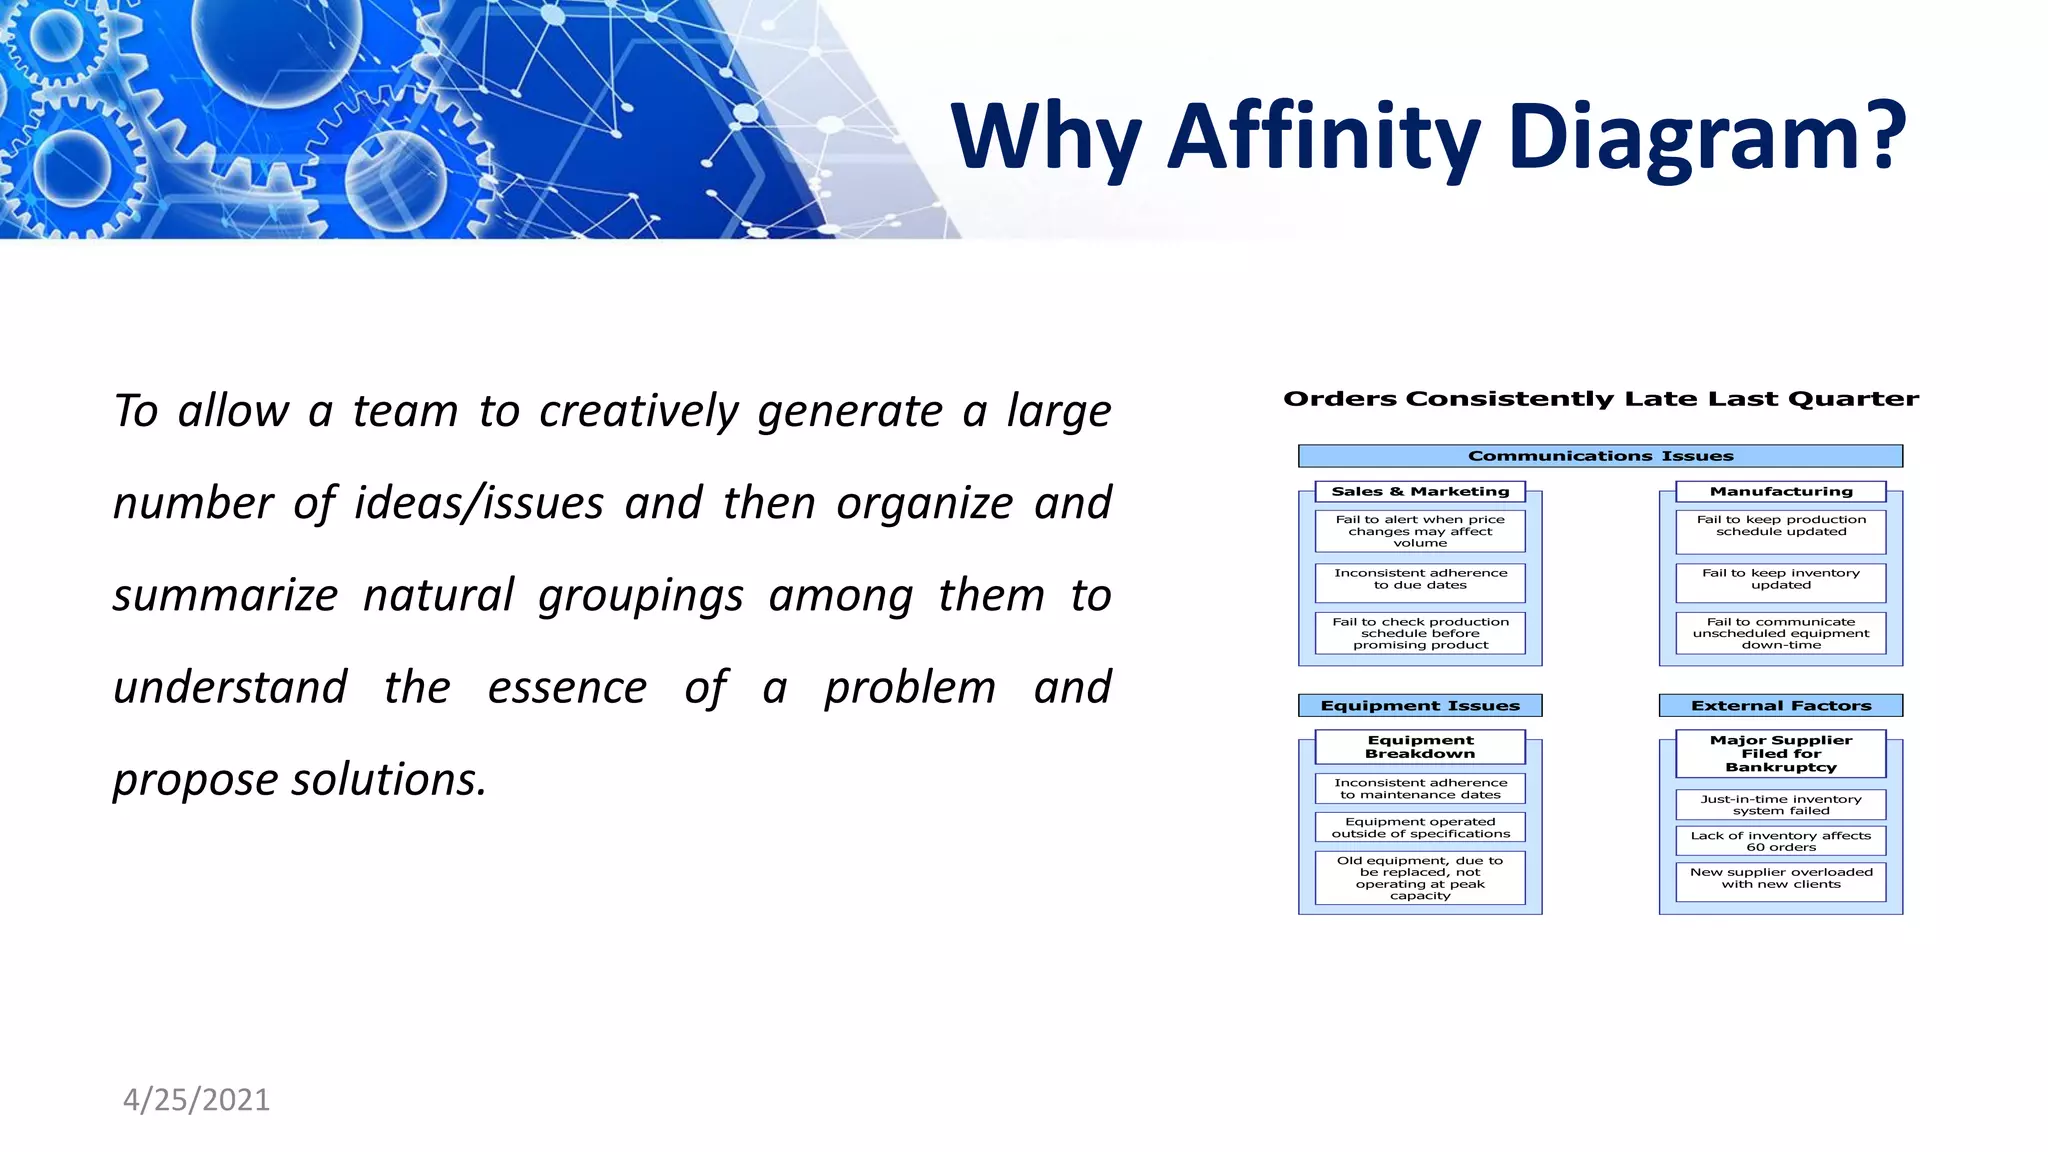
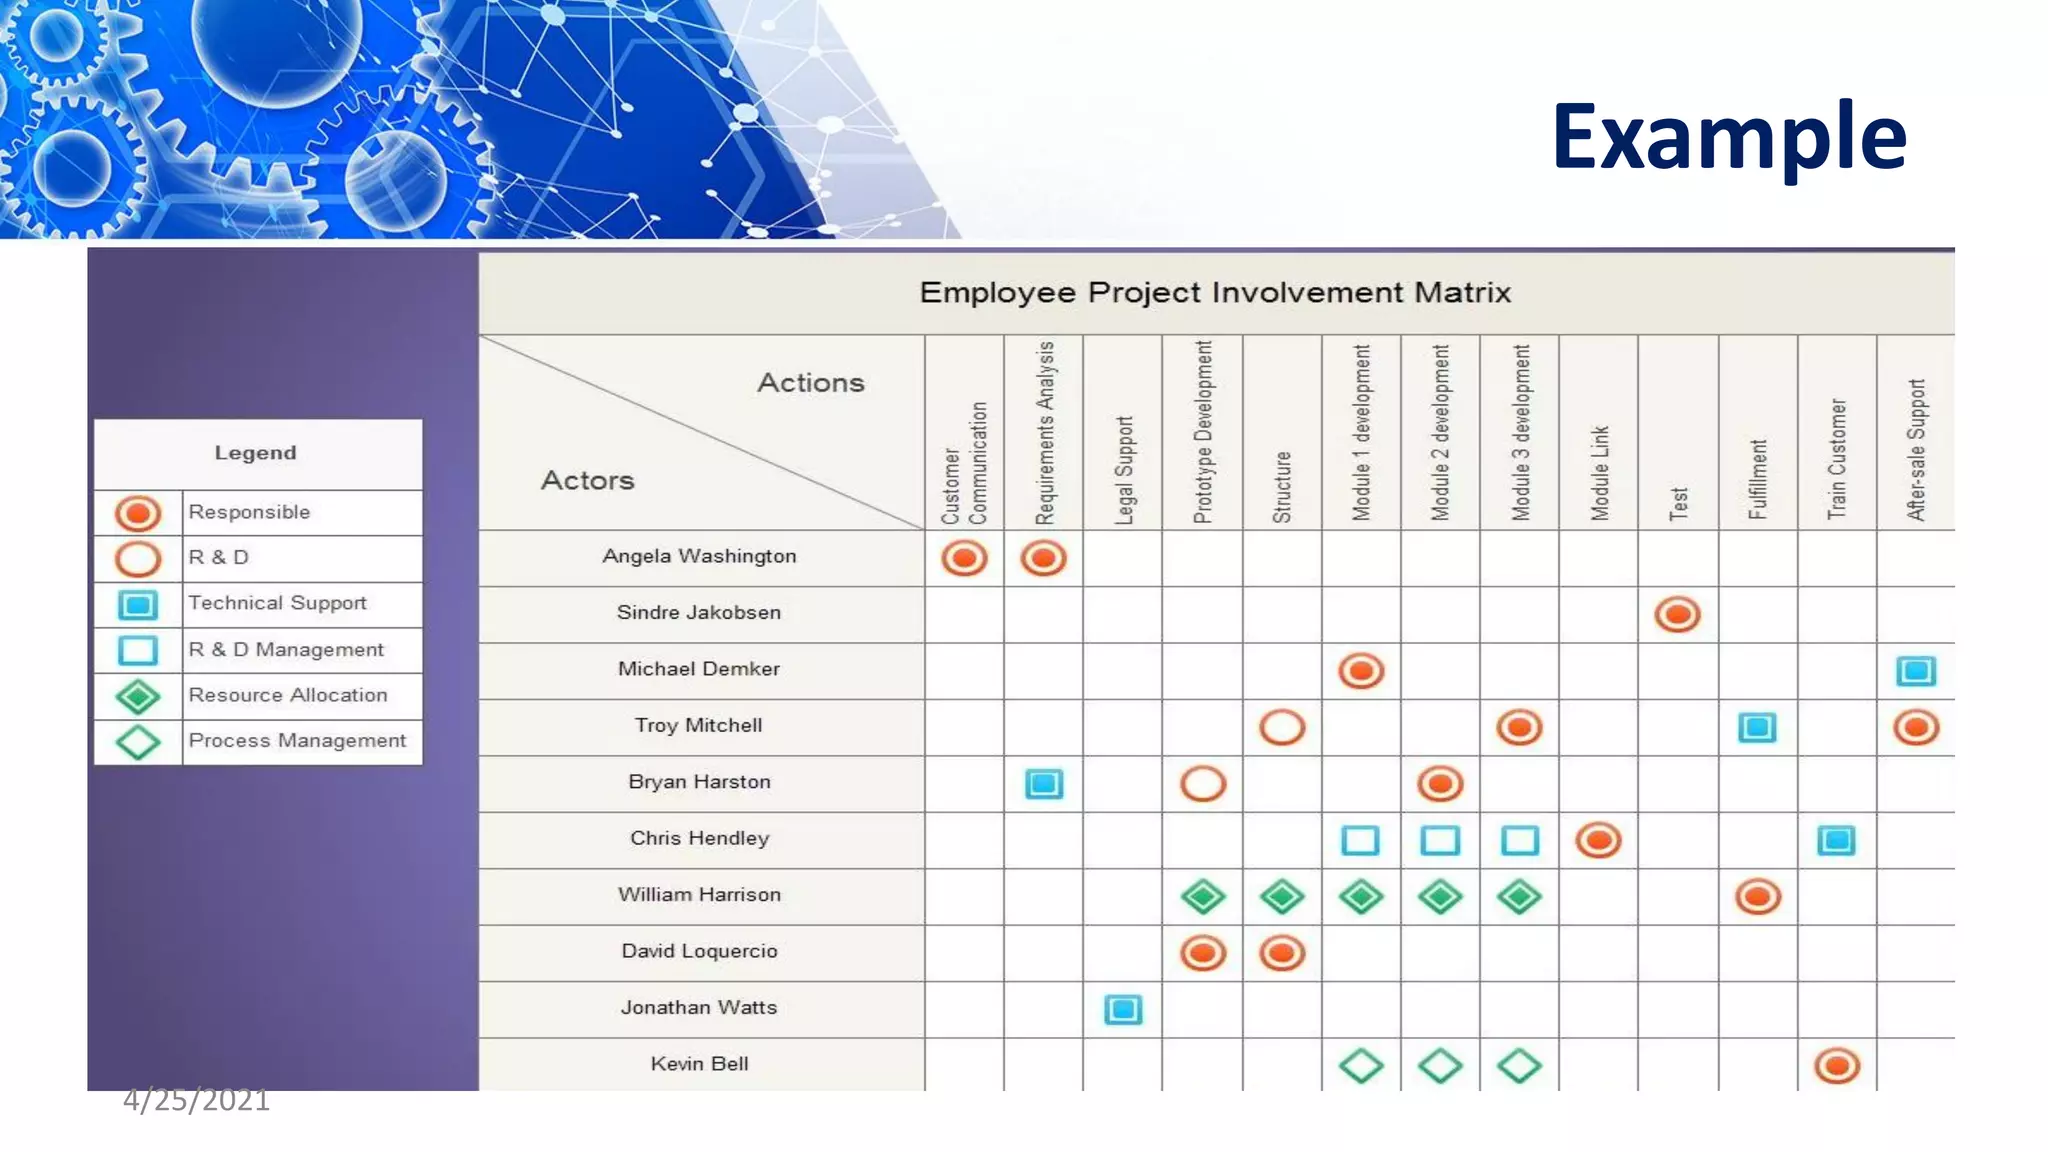
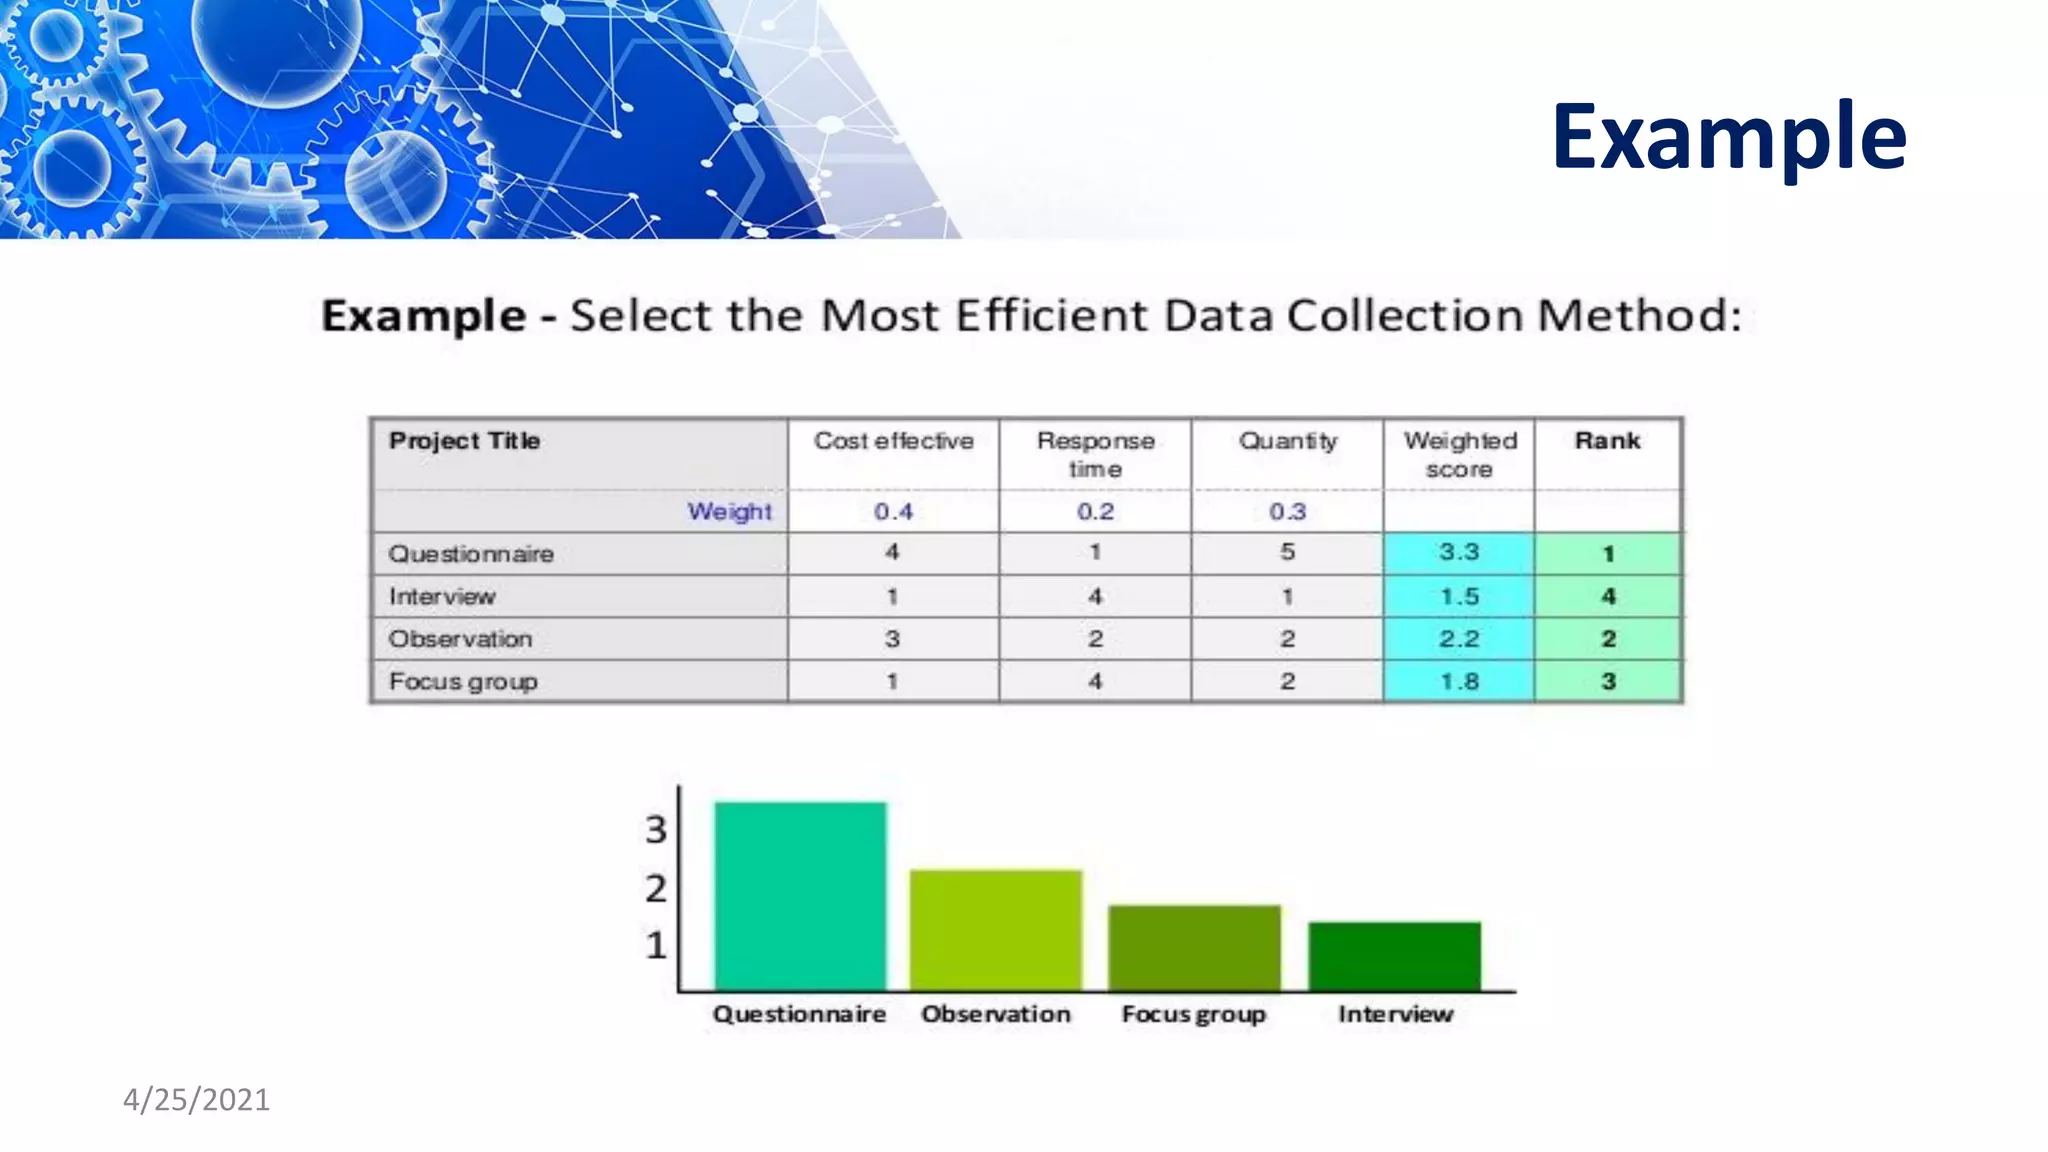
Advances in
Quality Control Tools
Dr. Kshirsagar S. R.
ME , Ph. D, MBA (OR), TQM Professional
Contact No. 09850022902
4/25/2021
Continuous Improvement
• Need
• Competition
Improvement in quality
• Tools & Techniques
Seven Basic QC tools
Seven management tools
4/25/2021
Contd…
• Taguchi Method
• Six Sigma
• DMAIC Methodology
4/25/2021
Tools & Techniques
Benefits of Quality Control tools and Techniques:-
• Improve process performance by reducing product variability
• Improves production efficiency by decreasing scarp and rework.
• Minimize rejection and rework.
• Enhance customer satisfaction by reduction in customer Complaints.
• Reduction of the production cost.
• Find root causes of problem and improve production performance.
4/25/2021
Introduction to QC Tools
For implementation requires—
1. Requires the knowledge of a simple QC of tools or techniques.
2. The effective use of these tools and techniques requires the people who
actually work on the processes
3. Commitment of management that they cares about improving quality.
4/25/2021
Basic QC Tools
•Process flowchart
• Cause & effect diagrams
• Pareto analysis
• Control charts
• Check sheets
• Scatter diagrams
• Histograms
4/25/2021
Check sheet
• Structured table created for each type of defect for a specified time.
• It shows the defects and how many time each type of defect occurred during that
period.
• improvement actions can be taken for the improvement on the basis of collected
information
4/25/2021
Process flow chart
• This is a technique for recording, in the form of a picture.
• The purpose of the flowchart is to learn why the current
process operates and conduct and objective analysis.
• To identify problems and weaknesses, unnecessary
steps or duplication and the objective of the
improvement effort.
4/25/2021
Control charts
Fundamental tool of statistical process control
it indicates that how a process changes over time.. Thus it helps to determine
whether or not a process is operating consistently
4/25/2021
Cause and Effect Diagram
• It is a visual tool that logically organizes possible causes for a specific problem
or effect by graphically displaying them in increasing detail.
• It is sometimes called a fishbone diagram because of its fishbone shape.
• This shape allows the team to see how each cause relates to the effect.
4/25/2021
Histogram
It is bar chart which is used for
measurement of data and showing
a distribution of variables or cause
of problems.
4/25/2021
Pareto Analysis
It is frequency distribution of attribute data arranged by category.
It can be used to quickly identify what business issues need attention.
By using hard data finding problems which are most influencing the outcome.
4/25/2021
Scatter diagrams
It is used to find and show the correlation between two variables.
4/25/2021
New Seven Quality Tools
• In 1976, the Union of Japanese Scientists and Engineers (JUSE)
saw the need for tools to promote innovation, communicate
information and successfully plan major projects.
• A team researched and developed the seven new quality control
tools, to be used with the 7 basic quality tools.
• Often called the seven management and planning (MP) tools, or
simply the seven management tools.
4/25/2021
New Seven Quality Tools
• 1. Affinity Diagram
• 2. Relations Diagram
• 3. Tree Diagram
• 4. Matrix Diagram
• 5. Arrows Diagram
• 6. Process Decision Program Chart
• 7. Prioritization Matrix- Matrix Data
Analysis
4/25/2021
Purpose
• Developed to organize verbal data diagrammatically.
• Basic 7 tools effective for data analysis, process control, and
quality improvement (numerical data)
• Used together increases TQM effectiveness
4/25/2021
New Seven Q.C. Tools and
Basic Seven Tools- Relation
4/25/2021
Advantages of Using
New Seven Q.C. Tools
❖ Organize verbal data
❖ Generate ideas
❖ Improve planning
❖ Eliminate errors and omissions
❖ Explain problems intelligibly
❖ Secure full cooperation between teams
❖ Persuade powerfully.
4/25/2021
Role in Organizational Reform
➢ Assess situations from various angles
➢ Clarify the desired situation
➢ Prioritize tasks effectively
➢ Proceed systematically
➢ Anticipate future events
➢ Change proactively
➢ Involve everyone
4/25/2021
Objectives of Organizational Reform
❑ Identification of problems
❑ Understand the importance of planning
❑ Looks for root cause of problem
❑ Stresses the importance of the process
❑ Prioritizes tasks
❑ Encourages everyone to think systematically
❑ Get things right first time
4/25/2021
New QC tools & Organizational reforms
4/25/2021
Tool 1 – The Affinity Diagram
• Gathers large amounts of verbal data (ideas, opinions, issues); the
data into groups based on natural relationship; and
• Makes it feasible for further analysis and to find a solution to the
problem.
4/25/2021
Why Affinity Diagram?
4/25/2021
Orders Consistently Late Last Quarter
Communications Issues
Sales & Marketing
Fail to alert when price
changes may affect
volume
Inconsistent adherence
to due dates
Fail to check production
schedule before
promising product
Manufacturing
Fail to keep production
schedule updated
Fail to keep inventory
updated
Fail to communicate
unscheduled equipment
down-time
Equipment Issues
Equipment
Breakdown
Inconsistent adherence
to maintenance dates
Equipment operated
outside of specifications
Old equipment, due to
be replaced, not
operating at peak
capacity
External Factors
Major Supplier
Filed for
Bankruptcy
Just-in-time inventory
system failed
Lack of inventory affects
60 orders
New supplier overloaded
with new clients
To allow a team to creatively generate a large
number of ideas/issues and then organize and
summarize natural groupings among them to
understand the essence of a problem and
propose solutions.
Construction of Affinity Diagram
o Select the topic to be analyzed
o Use brainstorming to collect verbal data and ideas
o Write each item on separate data card
o Spread out all cards on table or stick them on a board
o Move data cards into groups of similar themes (natural affinity for each other)
o Combine statements on data cards to new Affinity statement
o Make new card with Affinity statement
o Continue to combine until less than 5 groups
o Draw the final Affinity Diagram for the problem discussed
4/25/2021
Contd….
Verbal data generated by
brainstorming and
written on cards
• Organized cards through
natural relations =
• Affinity diagram
4/25/2021
Example
Orders Consistently Late Last Quarter
Communications Issues
Sales & Marketing
Fail to alert when price
changes may affect
volume
Inconsistent adherence
to due dates
Fail to check production
schedule before
promising product
Manufacturing
Fail to keep production
schedule updated
Fail to keep inventory
updated
Fail to communicate
unscheduled equipment
down-time
Equipment Issues
Equipment
Breakdown
Inconsistent adherence
to maintenance dates
Equipment operated
outside of specifications
Old equipment, due to
be replaced, not
operating at peak
capacity
External Factors
Major Supplier
Filed for
Bankruptcy
Just-in-time inventory
system failed
Lack of inventory affects
60 orders
New supplier overloaded
with new clients
4/25/2021
When Affinity Diagram
• When situations that are unknown or unexplored by a team, or in
circumstances that seem confusing or disorganized,
• When people with diverse experiences form a new team, or when
members have incomplete knowledge of the area of analysis.
• Sift through large volumes of data.
• Encourage new patterns of thinking.
4/25/2021
Tool N. 2 : Relations Diagrams
▪ For Finding Solutions Strategies by Clarifying
Relationships with Complex Interrelated Causes.
▪ To allow a team to systematically identify,
analyze, and classify the cause and
effect relationships that exist among all
critical issues.
4/25/2021
Construction
Identify the problem: Decide what problem to solve by analyzing its various
factors. Place it in a box at the top of the paper.
Identify issues: Brainstorm to produce any key issues, ideas, reasons, causes,
etc., for the problem. Place each in a rectangle on the page.
4/25/2021
Contd……
Connect the issues: Choose any item to start with and compare it to any other.
Identify which is a cause and which is an effect.
Use an arrow pointing from cause to effect to show the relationship.
Analyze: Any item with a large number of outgoing arrows is a key cause of the
problem. Any item with many arrows pointing to it is a main outcome.
Solve the issue: Discuss a way to solve the issue by focusing on the main cause.
4/25/2021
Example
The inference is that
Potential causes for
Low Customer
Satisfaction:
• Unskilled Employees
(4 outgoing arrows)
• HR Management
(3 outgoing arrows)
4/25/2021
When interrelationship diagram
• Interrelationship diagrams can be extremely useful when trying to sort
out possible causes of a specific problem.
• They do allow one to analyze broader issues as causes and effects of one
another
4/25/2021
Advantages
• Useful at planning stage for obtaining perspective on overall
situation.
• Facilitates consensus among team
• Assists to develop and change people’s thinking
• Enables priorities to be identified accurately
4/25/2021
Tool N. 3: Tree Diagram
• For Systematically Pursuing the Best Strategies for Attaining an Objective
• Develops a succession of strategies for achieving objectives
• Reveals methods to achieve the results.
• Also known as Systematic diagrams
or Dendrograms, tree analysis, analytical
tree, hierarchy diagram
4/25/2021
Construction of a Tree Diagram
• Develop a statement of the goal, project, plan, problem or whatever is being
studied.
• Ask a question that will lead you to the next level of detail.
• Do a “necessary and sufficient” check.
• Each of the new idea statements now becomes the subject: a goal, objective or
problem statement.
• Continue to turn each new idea into a subject statement and ask the question.
Do not stop until you reach fundamental elements.
• Do a “necessary and sufficient” check of the entire diagram.
4/25/2021
Example
4/25/2021
When Tree Diagram
• When an issue is known or being addressed in broad generalities and you
must move to specific details.
• When developing actions to carry out a solution or other plan.
• When analyzing processes in detail.
• When probing for the root cause of a problem.
• As a communication tool, to explain details to others.
4/25/2021
Advantages
• Systematic and logical approach
• Less likely that items are omitted
• Facilitates agreement among team
• Are extremely convincing with strategies
4/25/2021
Tool 4 - Matrix Diagrams
• For Clarifying Problems by “Thinking Multidimensional”
• To allow a team or individual to systematically,
identify, analyze, and rate the presence
and strength of relationships between
two or more sets of information.
4/25/2021
Construction
• Explain to the team the purpose for building the matrix diagram.
• Select and collect the two sets of data.
• Agree on the symbols and their values.
• Construct a two-dimensional table.
• Insert the first set of data on the left hand column and the second one on top
row of the table.
4/25/2021
Contd…
• Work through the matrix and discuss and indicate the relationships.
• Place the appropriate symbol at the intersecting cell of the matrix.
• Review the completed matrix with your team in order to make the best
decision for your situation.
4/25/2021
Contd…
4/25/2021
Example
4/25/2021
Types
4/25/2021
Tool 5 - Arrows Diagram
➢ Activity Network Diagram (AND) is also called an Arrow Diagram, and it is
used for identifying time sequences of events which are pivotal to
objectives.
➢ Activity Network Diagrams are also very useful when a project has multiple
activities which need simultaneous management.
➢ An Activity Network Diagram helps to find out the most efficient sequence
of events needed to complete any project.
4/25/2021
Types
4/25/2021
Difference
4/25/2021
Construction
• Select one (Objective of Arrow Diagram)
• Identify constraints to Objective
• Write all essential activities on separate cards
• List all activities necessary to achieving Objective
• Organize cards in sequential order of activities
• Remove any duplicate activities
• Review order of activities, find sequence with greatest amount of activities
• Arrange parallel activities
• Examine path, number nodes in sequence from left to right
• Record names and other necessary information
• Next, complete the diagram
4/25/2021
Diagram
4/25/2021
When CPM/PERT
❑ When planning a complex project or process with interrelated tasks and resources.
❑ When analyzing the timing of a project; this analysis can happen before, during or
after the project.
❑ When allocating resources (such as people, money and time) to a project.
❑ When monitoring the progress of a project.
❑ When re-planning a project in progress, due to changes in conditions or resources.
❑ Only when you know the steps of the project or process, their sequence, and how long
each steps takes.
4/25/2021
Tool 6 - Process Decisions
Program Charts (PDPC)
• PDPCs are used for planning the activities needed to solve problem when
information is incomplete or the situation is fluid and hard to forecast.
• Examples include planning an R & D project, mapping out countermeasure
against long-term chronic problems, and planning a sales campaign.
• A PDPC consists of a series of steps linked in sequence. Its goal is to depict
the events and contingencies likely to occur when progressing from a starting
point to one or more final outcomes
4/25/2021
Process Decisions Program
Chart
4/25/2021
When PDPC
• Before implementing a plan, especially when the plan is large and
complex.
• When the plan must be completed on schedule.
• When the price of failure is high
4/25/2021
Tool 7 - Prioritization Matrix
(Matrix Data Analysis)
❑ Technique quantifies and arranges data presented in Matrix.
❑ Based solely on numerical data.
❑ Finds indicators that differentiate and attempt to clarify large amount of
information.
❑ Prioritization Matrix is used by teams to narrow down options through a
systematic approach of comparing choices by selecting, weighting, and
applying criteria.
4/25/2021
Construction
• Determine your goal, your alternatives, and criteria for decision
• Place selection in order of importance
• Sum individual ratings to establish overall ranking (Divide by number of
• options for average ranking)
• Apply percentage weight to each option
• Rank order each option with respect to criterion (Average the rankings and
apply a completed ranking)
4/25/2021
Contd….
• Multiply weight by associated rank in Matrix (in example, 4 is best, 1 is
worst)
• Result is Importance Score
• Add up Importance Scores for each option
• Rank order the alternatives according to importance
4/25/2021
Example
4/25/2021
Practical Application of
New Seven Q.C. Tools
”Abilities Required for Applying New Seven QC Tools” Cause Statements (hints are in
yellow)
4/25/2021
Summary
New Seven Quality Tools
Benefits of New Seven Q.C. Tools
• Provide Training in Thinking
• Raise People’s Problem Solving
Confidence
• Increase People’s Ability to
Predict Future Events
• Express verbal data diagrammatically
• Make information visible
• Organize information intelligibly
• Clarify overall picture and fine details
• Get more people involved
Roles of New Seven Q.C. Tools
4/25/2021
4/25/2021
4/25/2021

Advances in qc tools new

  • 1.
    Advances in Quality ControlTools Dr. Kshirsagar S. R. ME , Ph. D, MBA (OR), TQM Professional Contact No. 09850022902 4/25/2021
  • 2.
    Continuous Improvement • Need •Competition Improvement in quality • Tools & Techniques Seven Basic QC tools Seven management tools 4/25/2021
  • 3.
    Contd… • Taguchi Method •Six Sigma • DMAIC Methodology 4/25/2021
  • 4.
    Tools & Techniques Benefitsof Quality Control tools and Techniques:- • Improve process performance by reducing product variability • Improves production efficiency by decreasing scarp and rework. • Minimize rejection and rework. • Enhance customer satisfaction by reduction in customer Complaints. • Reduction of the production cost. • Find root causes of problem and improve production performance. 4/25/2021
  • 5.
    Introduction to QCTools For implementation requires— 1. Requires the knowledge of a simple QC of tools or techniques. 2. The effective use of these tools and techniques requires the people who actually work on the processes 3. Commitment of management that they cares about improving quality. 4/25/2021
  • 6.
    Basic QC Tools •Processflowchart • Cause & effect diagrams • Pareto analysis • Control charts • Check sheets • Scatter diagrams • Histograms 4/25/2021
  • 7.
    Check sheet • Structuredtable created for each type of defect for a specified time. • It shows the defects and how many time each type of defect occurred during that period. • improvement actions can be taken for the improvement on the basis of collected information 4/25/2021
  • 8.
    Process flow chart •This is a technique for recording, in the form of a picture. • The purpose of the flowchart is to learn why the current process operates and conduct and objective analysis. • To identify problems and weaknesses, unnecessary steps or duplication and the objective of the improvement effort. 4/25/2021
  • 9.
    Control charts Fundamental toolof statistical process control it indicates that how a process changes over time.. Thus it helps to determine whether or not a process is operating consistently 4/25/2021
  • 10.
    Cause and EffectDiagram • It is a visual tool that logically organizes possible causes for a specific problem or effect by graphically displaying them in increasing detail. • It is sometimes called a fishbone diagram because of its fishbone shape. • This shape allows the team to see how each cause relates to the effect. 4/25/2021
  • 11.
    Histogram It is barchart which is used for measurement of data and showing a distribution of variables or cause of problems. 4/25/2021
  • 12.
    Pareto Analysis It isfrequency distribution of attribute data arranged by category. It can be used to quickly identify what business issues need attention. By using hard data finding problems which are most influencing the outcome. 4/25/2021
  • 13.
    Scatter diagrams It isused to find and show the correlation between two variables. 4/25/2021
  • 14.
    New Seven QualityTools • In 1976, the Union of Japanese Scientists and Engineers (JUSE) saw the need for tools to promote innovation, communicate information and successfully plan major projects. • A team researched and developed the seven new quality control tools, to be used with the 7 basic quality tools. • Often called the seven management and planning (MP) tools, or simply the seven management tools. 4/25/2021
  • 15.
    New Seven QualityTools • 1. Affinity Diagram • 2. Relations Diagram • 3. Tree Diagram • 4. Matrix Diagram • 5. Arrows Diagram • 6. Process Decision Program Chart • 7. Prioritization Matrix- Matrix Data Analysis 4/25/2021
  • 16.
    Purpose • Developed toorganize verbal data diagrammatically. • Basic 7 tools effective for data analysis, process control, and quality improvement (numerical data) • Used together increases TQM effectiveness 4/25/2021
  • 17.
    New Seven Q.C.Tools and Basic Seven Tools- Relation 4/25/2021
  • 18.
    Advantages of Using NewSeven Q.C. Tools ❖ Organize verbal data ❖ Generate ideas ❖ Improve planning ❖ Eliminate errors and omissions ❖ Explain problems intelligibly ❖ Secure full cooperation between teams ❖ Persuade powerfully. 4/25/2021
  • 19.
    Role in OrganizationalReform ➢ Assess situations from various angles ➢ Clarify the desired situation ➢ Prioritize tasks effectively ➢ Proceed systematically ➢ Anticipate future events ➢ Change proactively ➢ Involve everyone 4/25/2021
  • 20.
    Objectives of OrganizationalReform ❑ Identification of problems ❑ Understand the importance of planning ❑ Looks for root cause of problem ❑ Stresses the importance of the process ❑ Prioritizes tasks ❑ Encourages everyone to think systematically ❑ Get things right first time 4/25/2021
  • 21.
    New QC tools& Organizational reforms 4/25/2021
  • 22.
    Tool 1 –The Affinity Diagram • Gathers large amounts of verbal data (ideas, opinions, issues); the data into groups based on natural relationship; and • Makes it feasible for further analysis and to find a solution to the problem. 4/25/2021
  • 23.
    Why Affinity Diagram? 4/25/2021 OrdersConsistently Late Last Quarter Communications Issues Sales & Marketing Fail to alert when price changes may affect volume Inconsistent adherence to due dates Fail to check production schedule before promising product Manufacturing Fail to keep production schedule updated Fail to keep inventory updated Fail to communicate unscheduled equipment down-time Equipment Issues Equipment Breakdown Inconsistent adherence to maintenance dates Equipment operated outside of specifications Old equipment, due to be replaced, not operating at peak capacity External Factors Major Supplier Filed for Bankruptcy Just-in-time inventory system failed Lack of inventory affects 60 orders New supplier overloaded with new clients To allow a team to creatively generate a large number of ideas/issues and then organize and summarize natural groupings among them to understand the essence of a problem and propose solutions.
  • 24.
    Construction of AffinityDiagram o Select the topic to be analyzed o Use brainstorming to collect verbal data and ideas o Write each item on separate data card o Spread out all cards on table or stick them on a board o Move data cards into groups of similar themes (natural affinity for each other) o Combine statements on data cards to new Affinity statement o Make new card with Affinity statement o Continue to combine until less than 5 groups o Draw the final Affinity Diagram for the problem discussed 4/25/2021
  • 25.
    Contd…. Verbal data generatedby brainstorming and written on cards • Organized cards through natural relations = • Affinity diagram 4/25/2021
  • 26.
    Example Orders Consistently LateLast Quarter Communications Issues Sales & Marketing Fail to alert when price changes may affect volume Inconsistent adherence to due dates Fail to check production schedule before promising product Manufacturing Fail to keep production schedule updated Fail to keep inventory updated Fail to communicate unscheduled equipment down-time Equipment Issues Equipment Breakdown Inconsistent adherence to maintenance dates Equipment operated outside of specifications Old equipment, due to be replaced, not operating at peak capacity External Factors Major Supplier Filed for Bankruptcy Just-in-time inventory system failed Lack of inventory affects 60 orders New supplier overloaded with new clients 4/25/2021
  • 27.
    When Affinity Diagram •When situations that are unknown or unexplored by a team, or in circumstances that seem confusing or disorganized, • When people with diverse experiences form a new team, or when members have incomplete knowledge of the area of analysis. • Sift through large volumes of data. • Encourage new patterns of thinking. 4/25/2021
  • 28.
    Tool N. 2: Relations Diagrams ▪ For Finding Solutions Strategies by Clarifying Relationships with Complex Interrelated Causes. ▪ To allow a team to systematically identify, analyze, and classify the cause and effect relationships that exist among all critical issues. 4/25/2021
  • 29.
    Construction Identify the problem:Decide what problem to solve by analyzing its various factors. Place it in a box at the top of the paper. Identify issues: Brainstorm to produce any key issues, ideas, reasons, causes, etc., for the problem. Place each in a rectangle on the page. 4/25/2021
  • 30.
    Contd…… Connect the issues:Choose any item to start with and compare it to any other. Identify which is a cause and which is an effect. Use an arrow pointing from cause to effect to show the relationship. Analyze: Any item with a large number of outgoing arrows is a key cause of the problem. Any item with many arrows pointing to it is a main outcome. Solve the issue: Discuss a way to solve the issue by focusing on the main cause. 4/25/2021
  • 31.
    Example The inference isthat Potential causes for Low Customer Satisfaction: • Unskilled Employees (4 outgoing arrows) • HR Management (3 outgoing arrows) 4/25/2021
  • 32.
    When interrelationship diagram •Interrelationship diagrams can be extremely useful when trying to sort out possible causes of a specific problem. • They do allow one to analyze broader issues as causes and effects of one another 4/25/2021
  • 33.
    Advantages • Useful atplanning stage for obtaining perspective on overall situation. • Facilitates consensus among team • Assists to develop and change people’s thinking • Enables priorities to be identified accurately 4/25/2021
  • 34.
    Tool N. 3:Tree Diagram • For Systematically Pursuing the Best Strategies for Attaining an Objective • Develops a succession of strategies for achieving objectives • Reveals methods to achieve the results. • Also known as Systematic diagrams or Dendrograms, tree analysis, analytical tree, hierarchy diagram 4/25/2021
  • 35.
    Construction of aTree Diagram • Develop a statement of the goal, project, plan, problem or whatever is being studied. • Ask a question that will lead you to the next level of detail. • Do a “necessary and sufficient” check. • Each of the new idea statements now becomes the subject: a goal, objective or problem statement. • Continue to turn each new idea into a subject statement and ask the question. Do not stop until you reach fundamental elements. • Do a “necessary and sufficient” check of the entire diagram. 4/25/2021
  • 36.
  • 37.
    When Tree Diagram •When an issue is known or being addressed in broad generalities and you must move to specific details. • When developing actions to carry out a solution or other plan. • When analyzing processes in detail. • When probing for the root cause of a problem. • As a communication tool, to explain details to others. 4/25/2021
  • 38.
    Advantages • Systematic andlogical approach • Less likely that items are omitted • Facilitates agreement among team • Are extremely convincing with strategies 4/25/2021
  • 39.
    Tool 4 -Matrix Diagrams • For Clarifying Problems by “Thinking Multidimensional” • To allow a team or individual to systematically, identify, analyze, and rate the presence and strength of relationships between two or more sets of information. 4/25/2021
  • 40.
    Construction • Explain tothe team the purpose for building the matrix diagram. • Select and collect the two sets of data. • Agree on the symbols and their values. • Construct a two-dimensional table. • Insert the first set of data on the left hand column and the second one on top row of the table. 4/25/2021
  • 41.
    Contd… • Work throughthe matrix and discuss and indicate the relationships. • Place the appropriate symbol at the intersecting cell of the matrix. • Review the completed matrix with your team in order to make the best decision for your situation. 4/25/2021
  • 42.
  • 43.
  • 44.
  • 45.
    Tool 5 -Arrows Diagram ➢ Activity Network Diagram (AND) is also called an Arrow Diagram, and it is used for identifying time sequences of events which are pivotal to objectives. ➢ Activity Network Diagrams are also very useful when a project has multiple activities which need simultaneous management. ➢ An Activity Network Diagram helps to find out the most efficient sequence of events needed to complete any project. 4/25/2021
  • 46.
  • 47.
  • 48.
    Construction • Select one(Objective of Arrow Diagram) • Identify constraints to Objective • Write all essential activities on separate cards • List all activities necessary to achieving Objective • Organize cards in sequential order of activities • Remove any duplicate activities • Review order of activities, find sequence with greatest amount of activities • Arrange parallel activities • Examine path, number nodes in sequence from left to right • Record names and other necessary information • Next, complete the diagram 4/25/2021
  • 49.
  • 50.
    When CPM/PERT ❑ Whenplanning a complex project or process with interrelated tasks and resources. ❑ When analyzing the timing of a project; this analysis can happen before, during or after the project. ❑ When allocating resources (such as people, money and time) to a project. ❑ When monitoring the progress of a project. ❑ When re-planning a project in progress, due to changes in conditions or resources. ❑ Only when you know the steps of the project or process, their sequence, and how long each steps takes. 4/25/2021
  • 51.
    Tool 6 -Process Decisions Program Charts (PDPC) • PDPCs are used for planning the activities needed to solve problem when information is incomplete or the situation is fluid and hard to forecast. • Examples include planning an R & D project, mapping out countermeasure against long-term chronic problems, and planning a sales campaign. • A PDPC consists of a series of steps linked in sequence. Its goal is to depict the events and contingencies likely to occur when progressing from a starting point to one or more final outcomes 4/25/2021
  • 52.
  • 53.
    When PDPC • Beforeimplementing a plan, especially when the plan is large and complex. • When the plan must be completed on schedule. • When the price of failure is high 4/25/2021
  • 54.
    Tool 7 -Prioritization Matrix (Matrix Data Analysis) ❑ Technique quantifies and arranges data presented in Matrix. ❑ Based solely on numerical data. ❑ Finds indicators that differentiate and attempt to clarify large amount of information. ❑ Prioritization Matrix is used by teams to narrow down options through a systematic approach of comparing choices by selecting, weighting, and applying criteria. 4/25/2021
  • 55.
    Construction • Determine yourgoal, your alternatives, and criteria for decision • Place selection in order of importance • Sum individual ratings to establish overall ranking (Divide by number of • options for average ranking) • Apply percentage weight to each option • Rank order each option with respect to criterion (Average the rankings and apply a completed ranking) 4/25/2021
  • 56.
    Contd…. • Multiply weightby associated rank in Matrix (in example, 4 is best, 1 is worst) • Result is Importance Score • Add up Importance Scores for each option • Rank order the alternatives according to importance 4/25/2021
  • 57.
  • 58.
    Practical Application of NewSeven Q.C. Tools ”Abilities Required for Applying New Seven QC Tools” Cause Statements (hints are in yellow) 4/25/2021
  • 59.
    Summary New Seven QualityTools Benefits of New Seven Q.C. Tools • Provide Training in Thinking • Raise People’s Problem Solving Confidence • Increase People’s Ability to Predict Future Events • Express verbal data diagrammatically • Make information visible • Organize information intelligibly • Clarify overall picture and fine details • Get more people involved Roles of New Seven Q.C. Tools 4/25/2021
  • 60.
  • 61.