Download as PPSX, PPTX
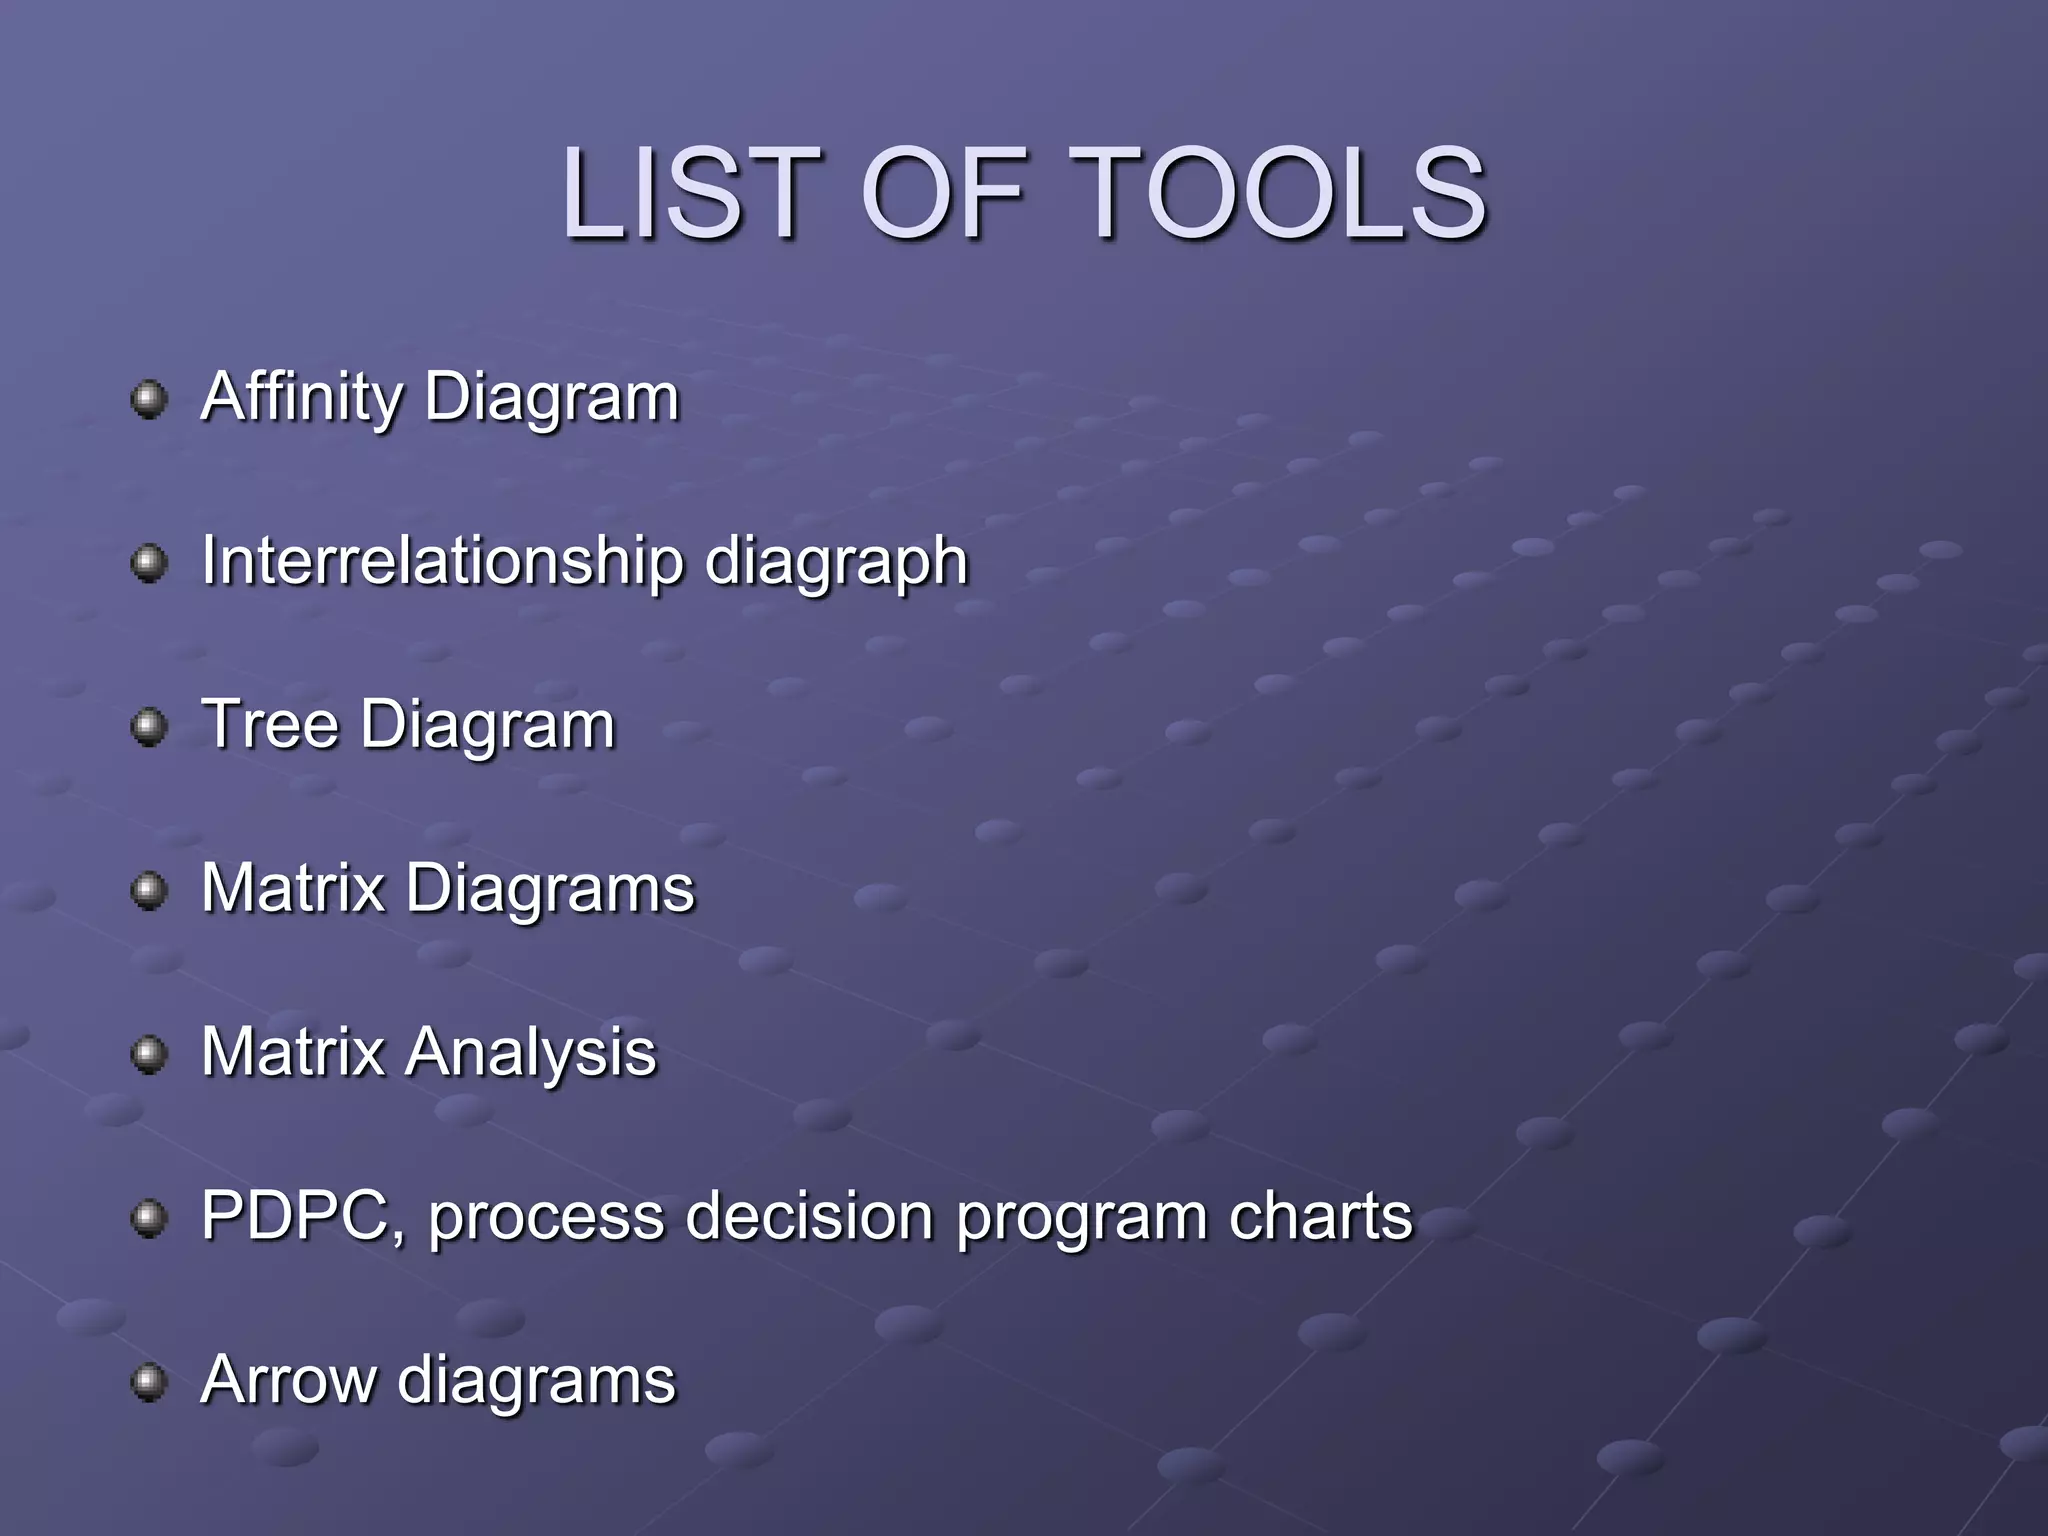
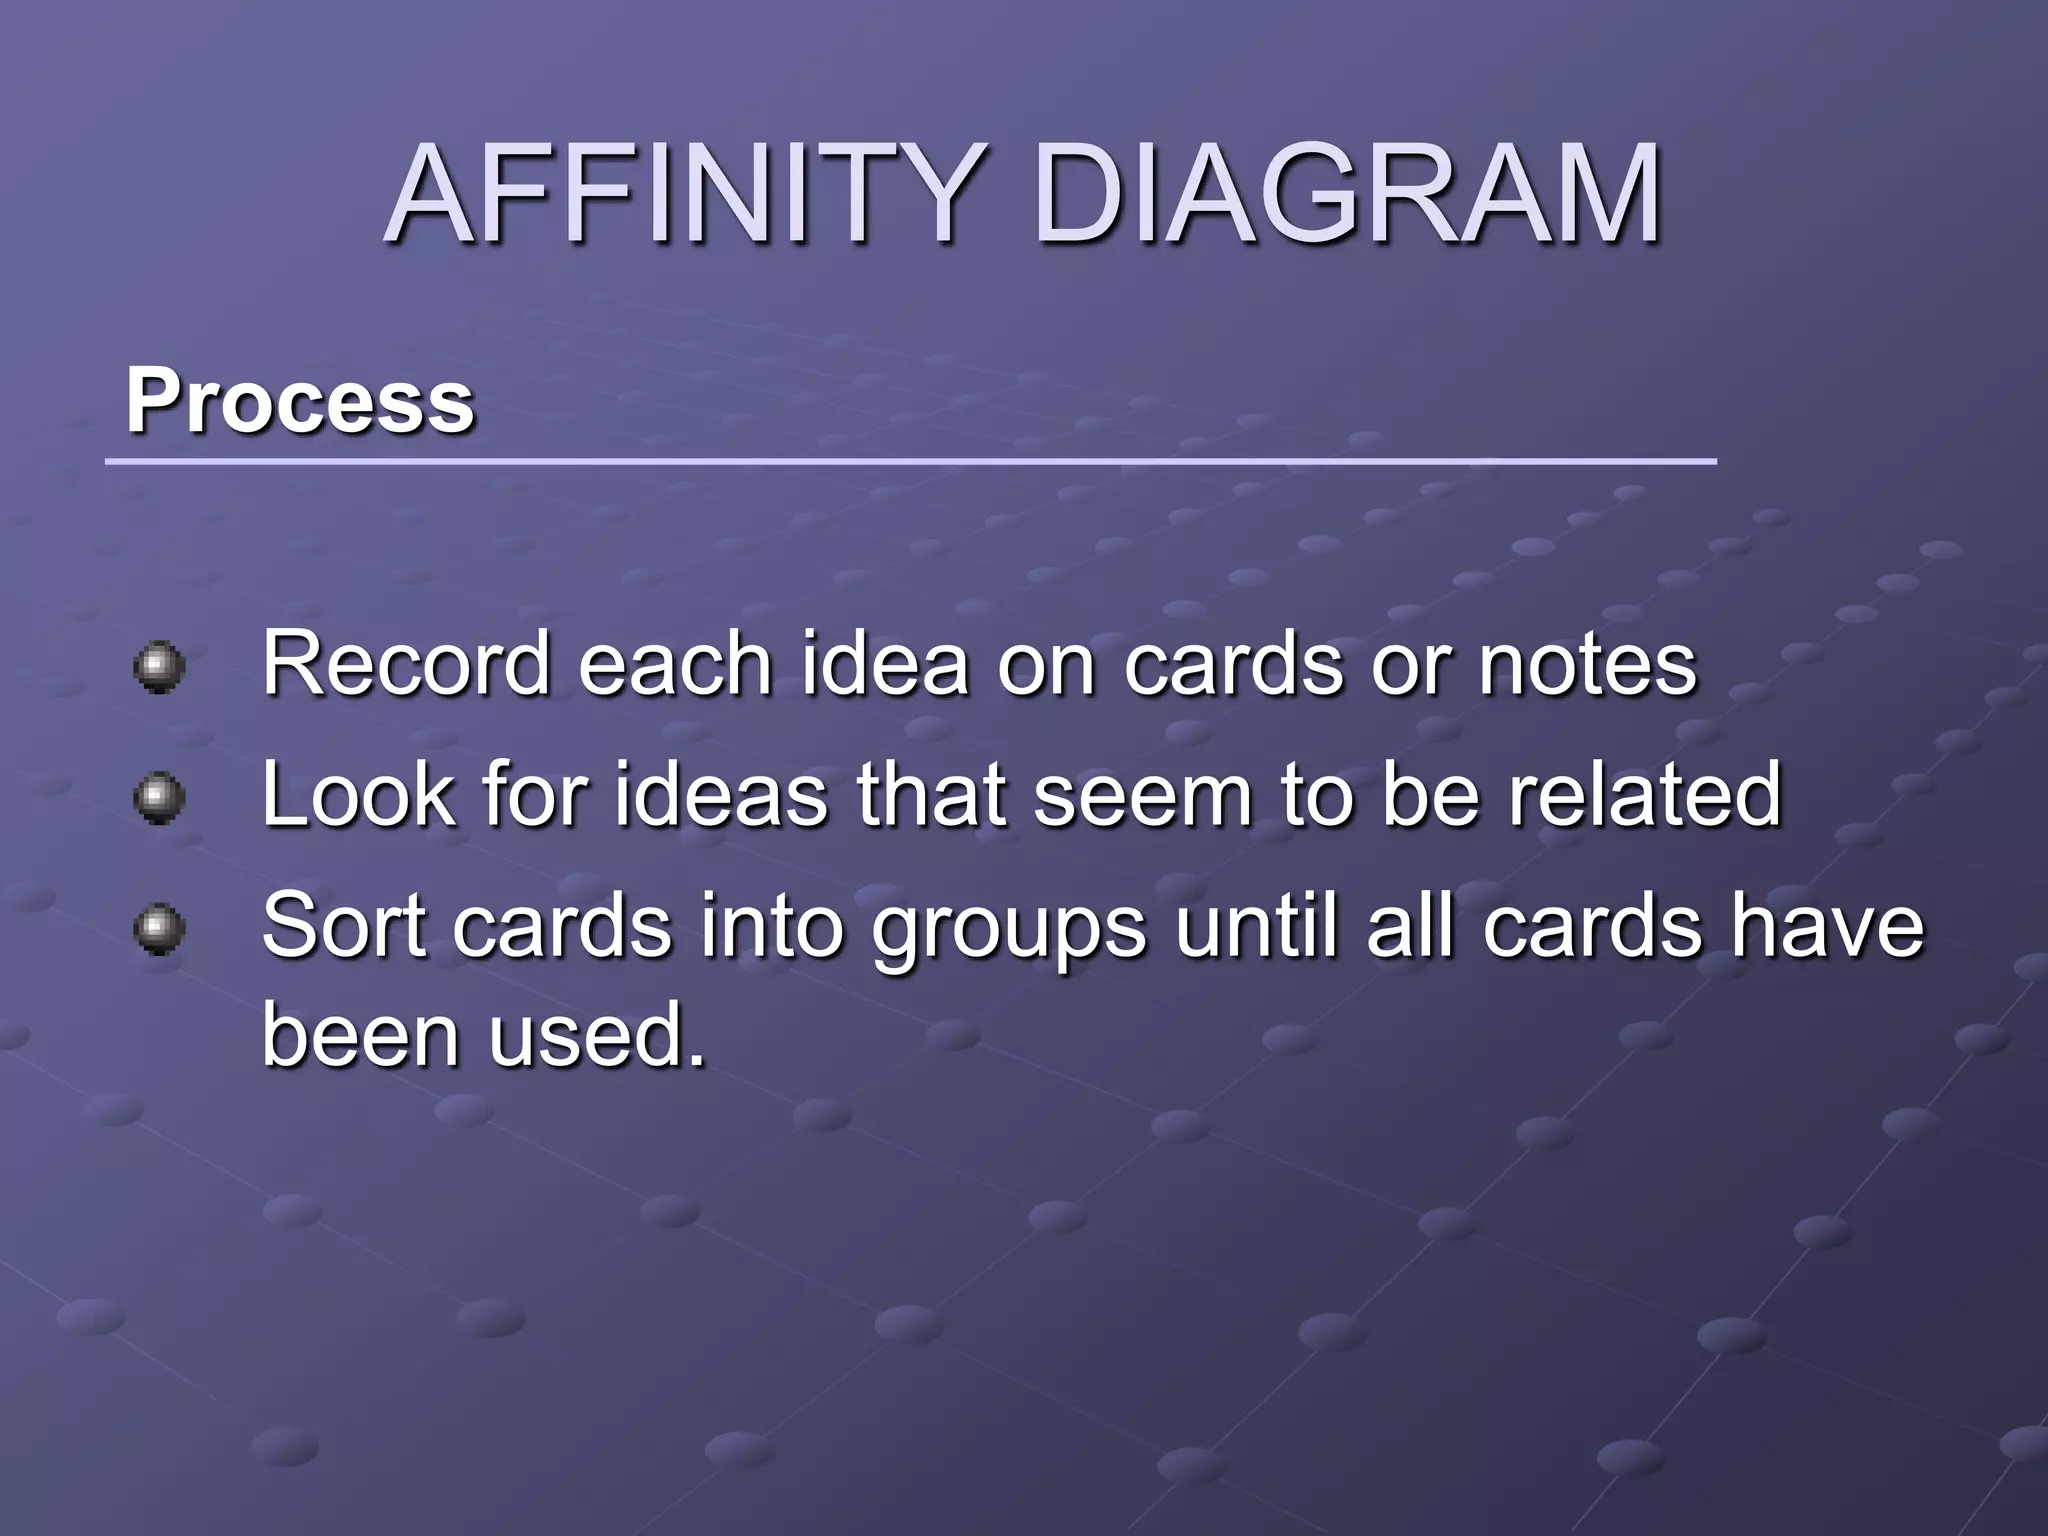
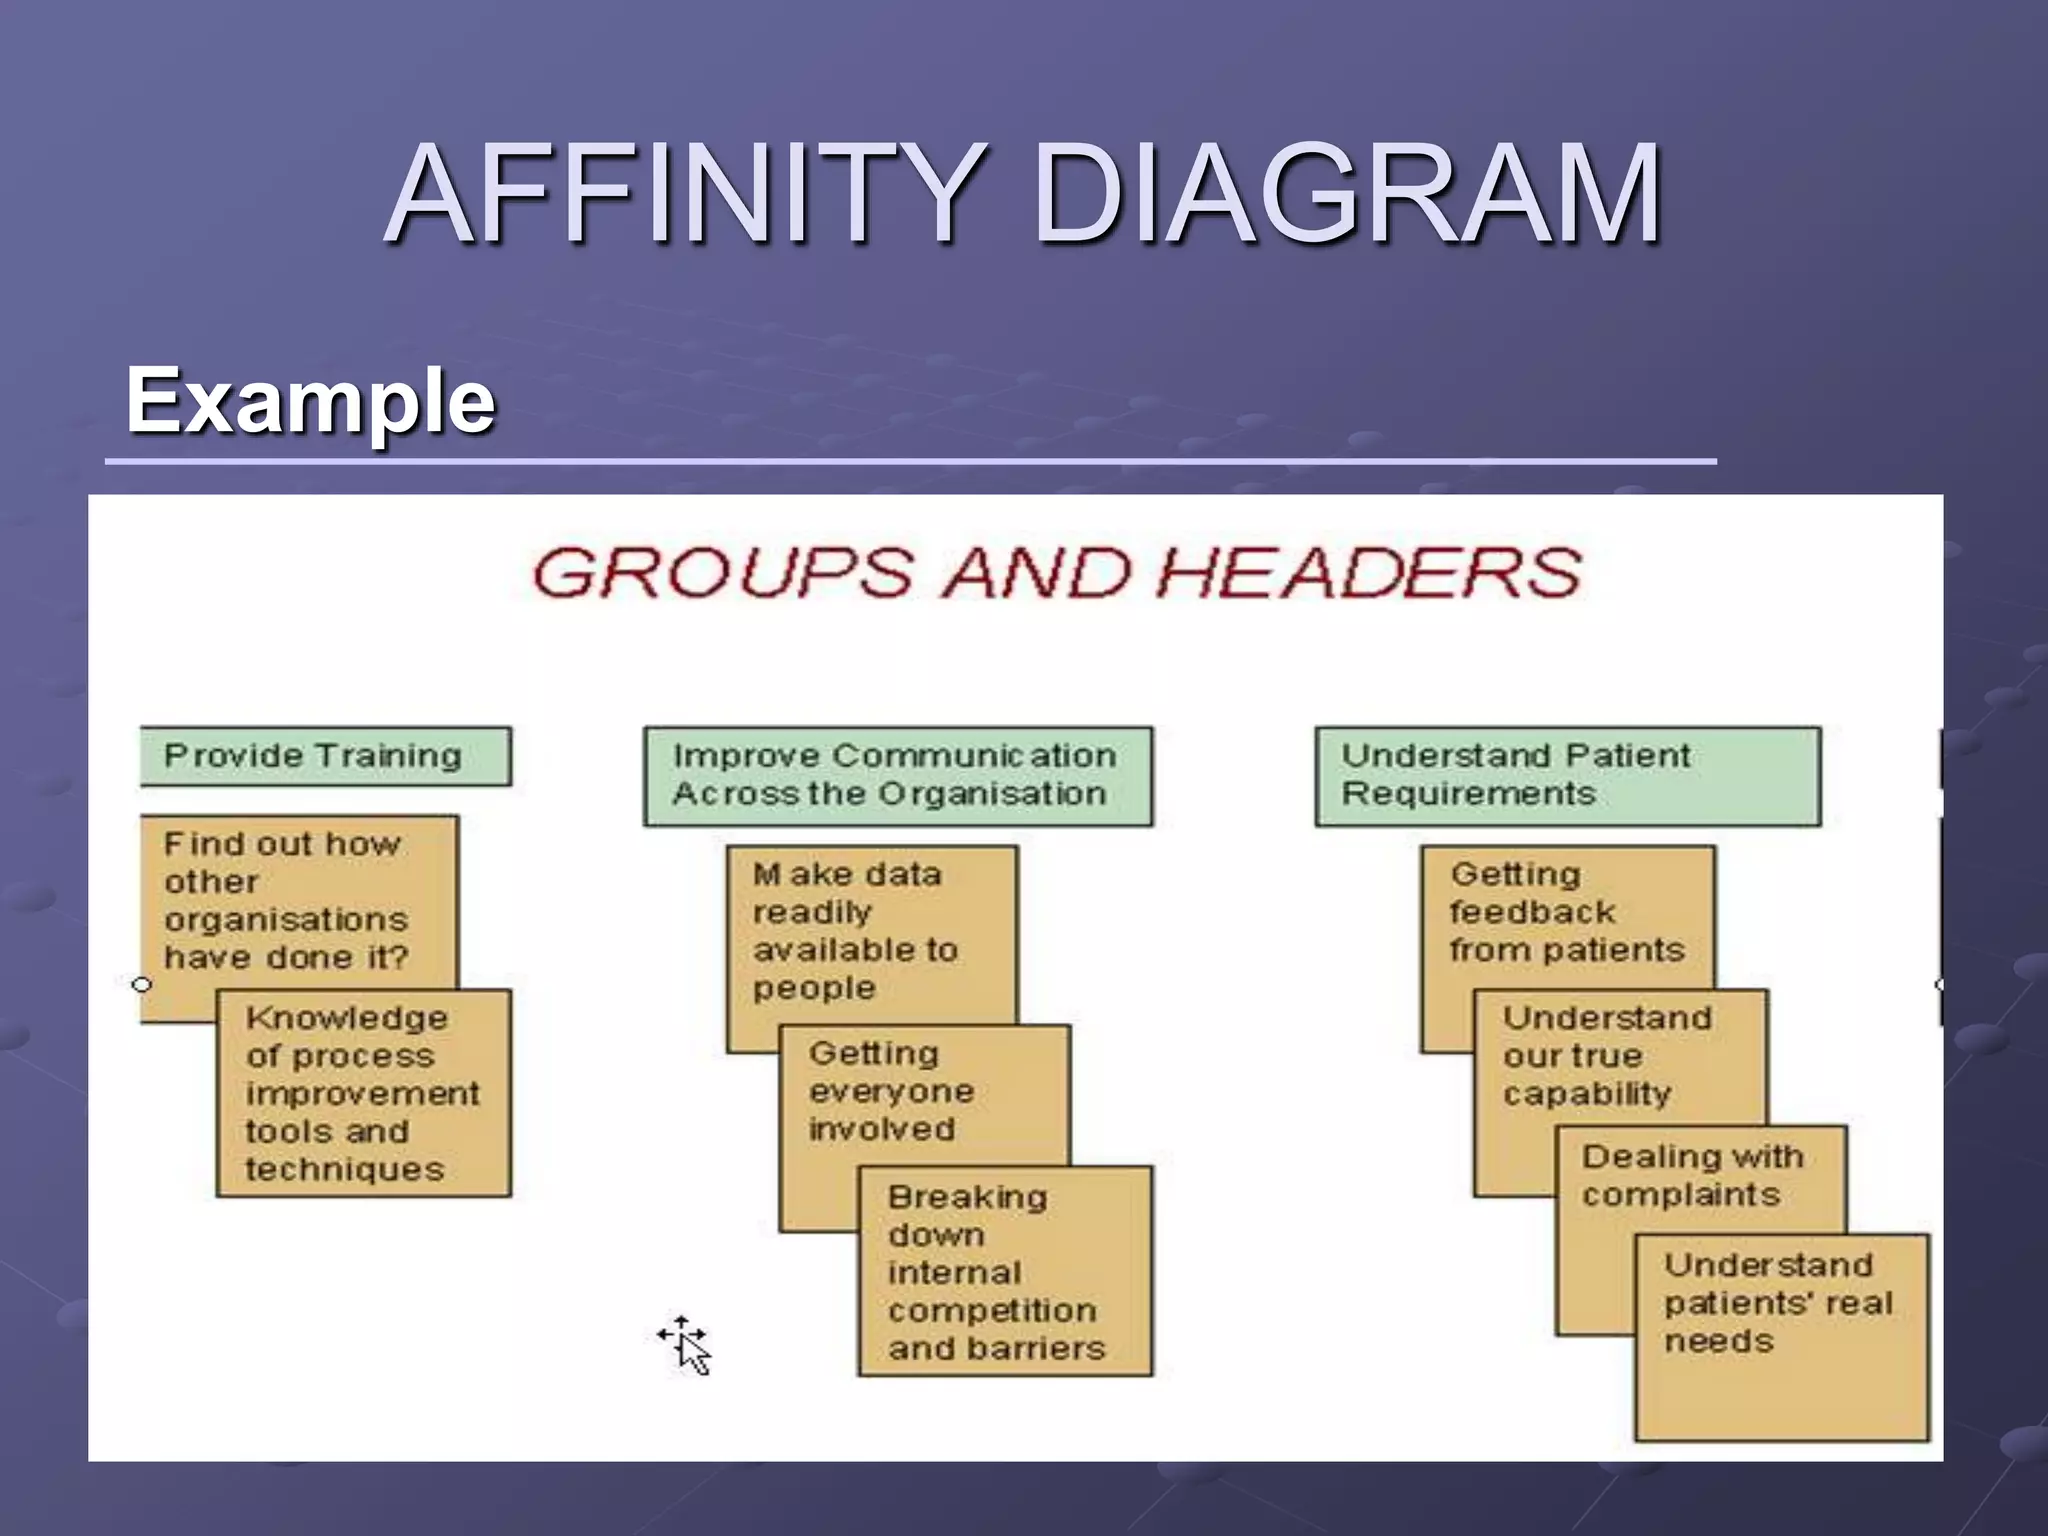
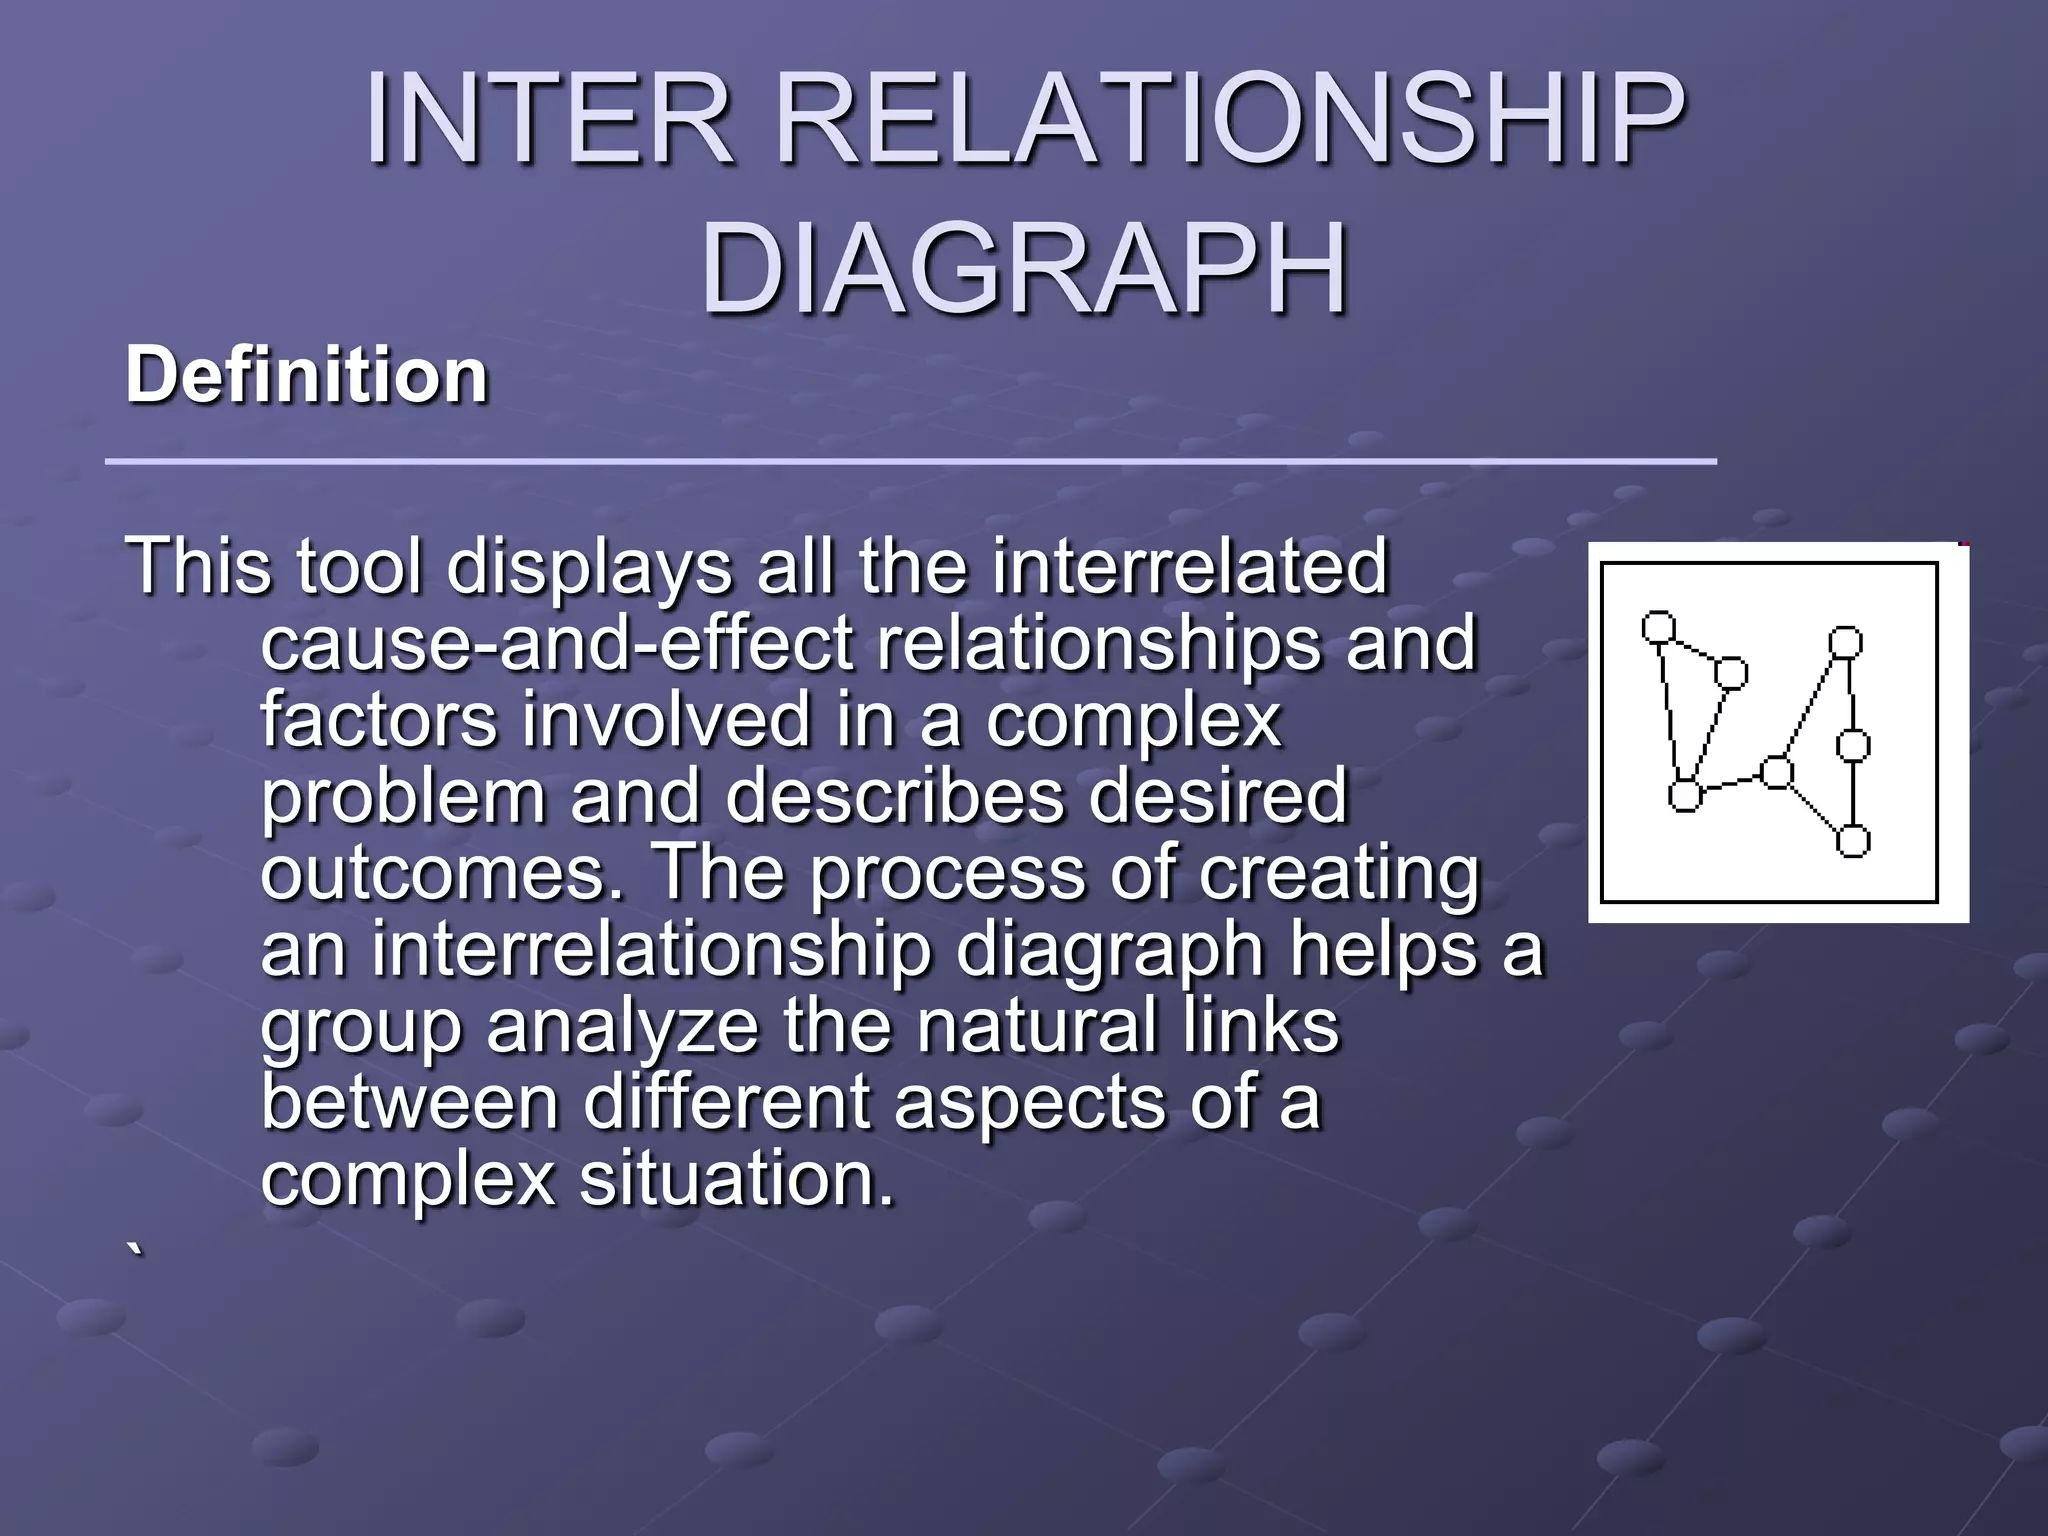
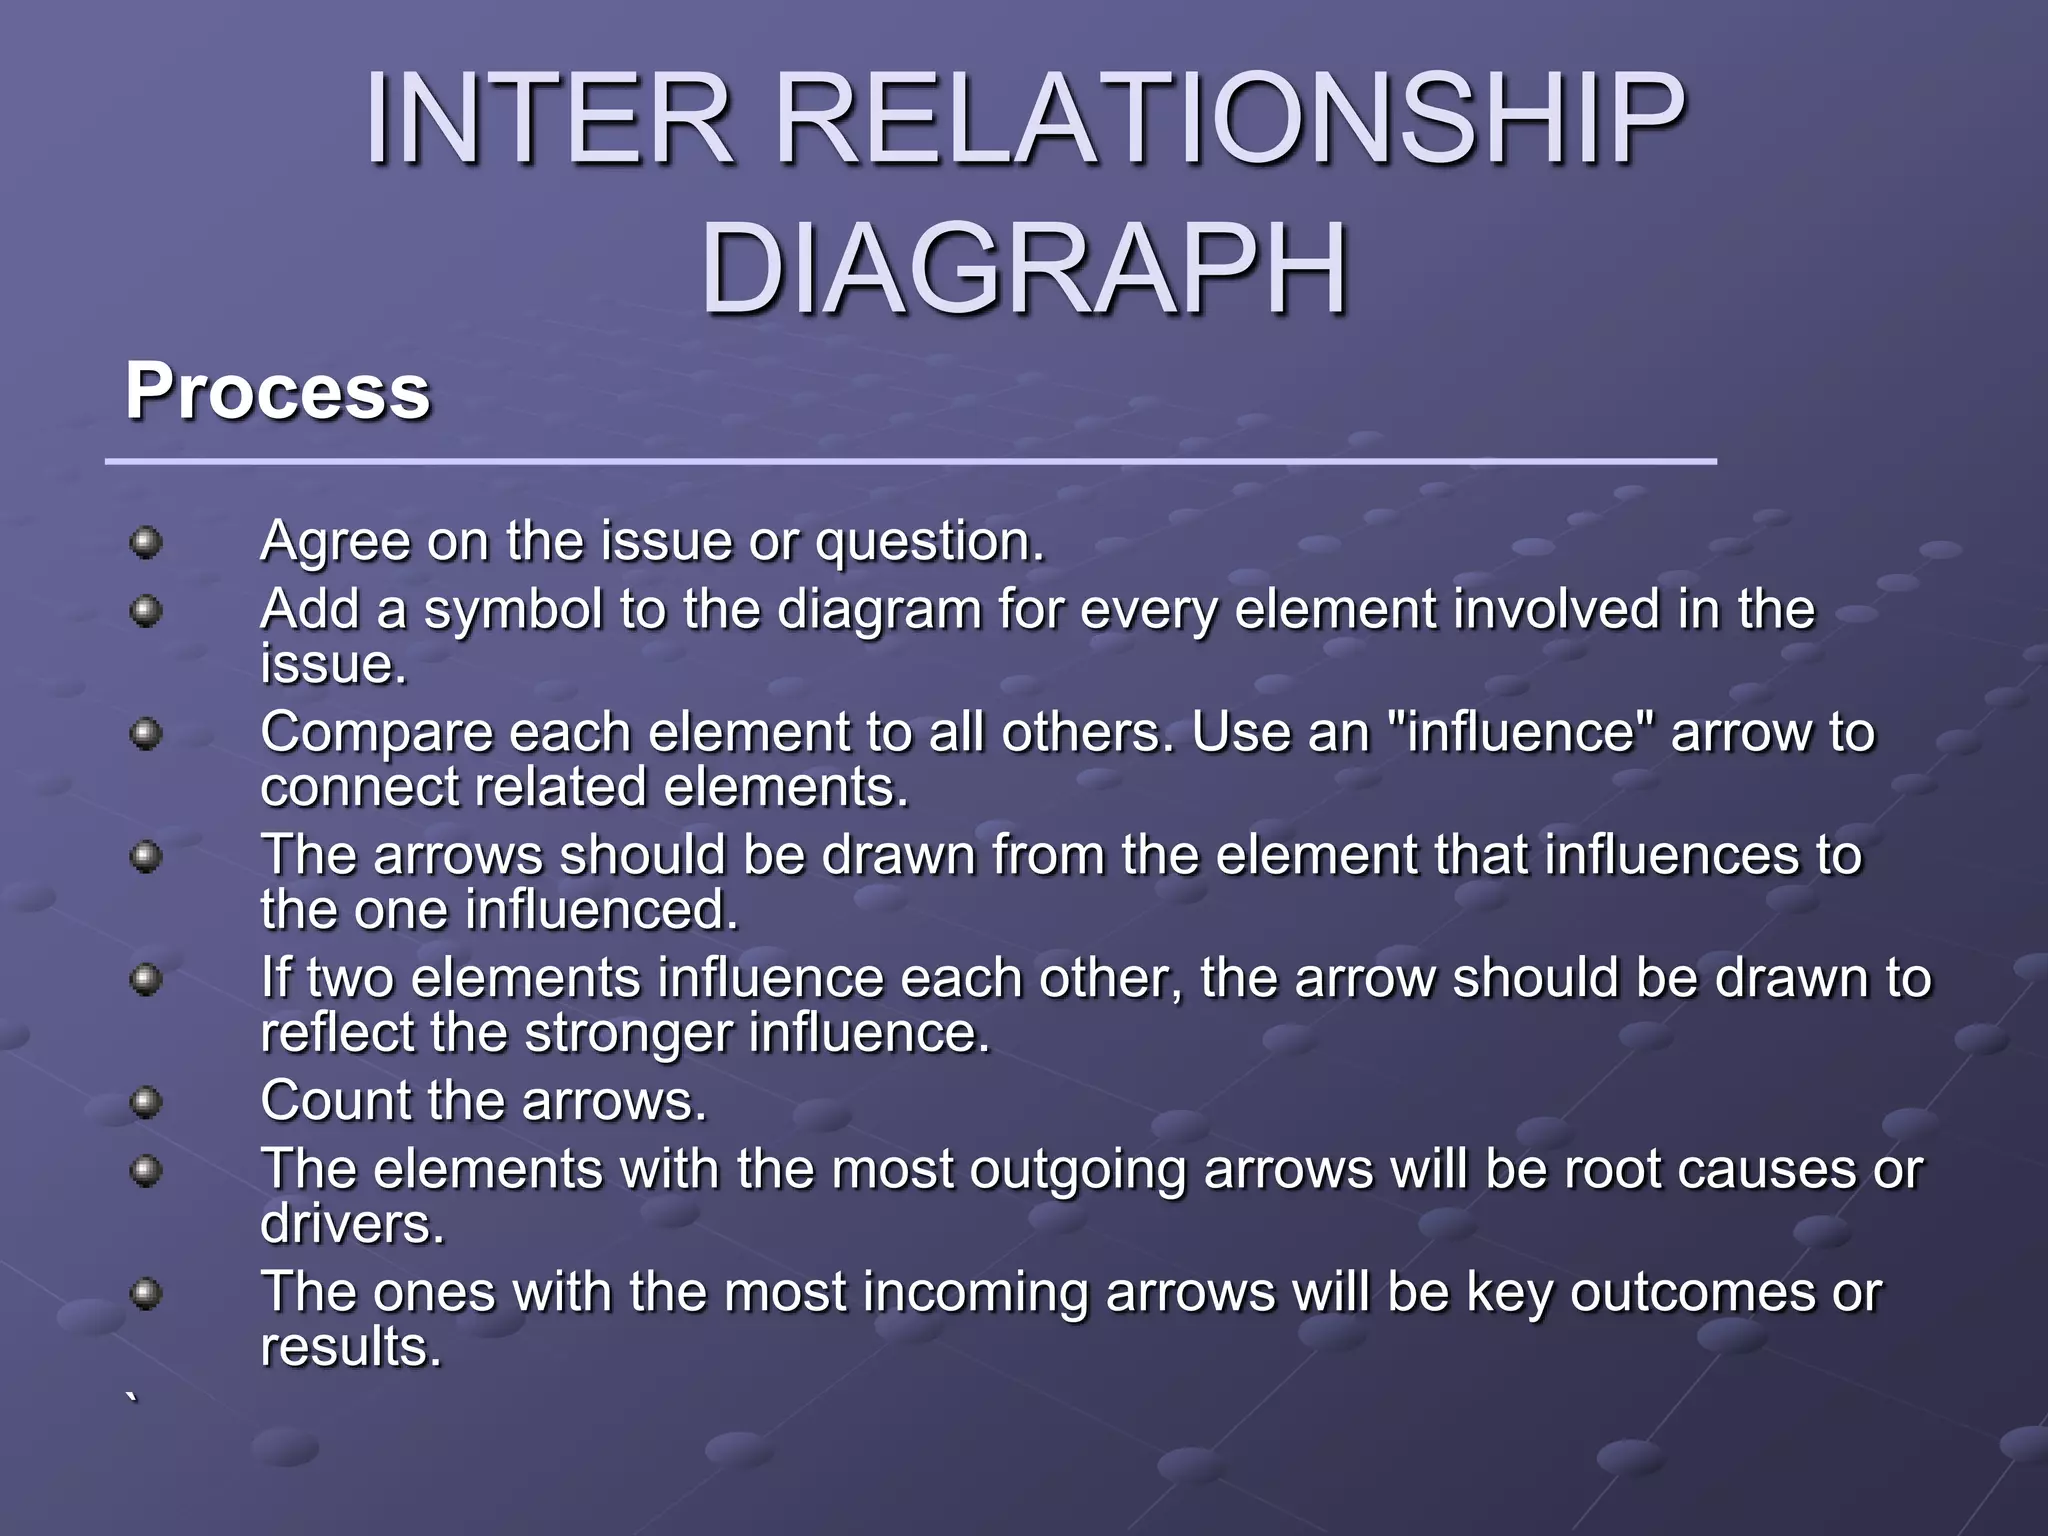
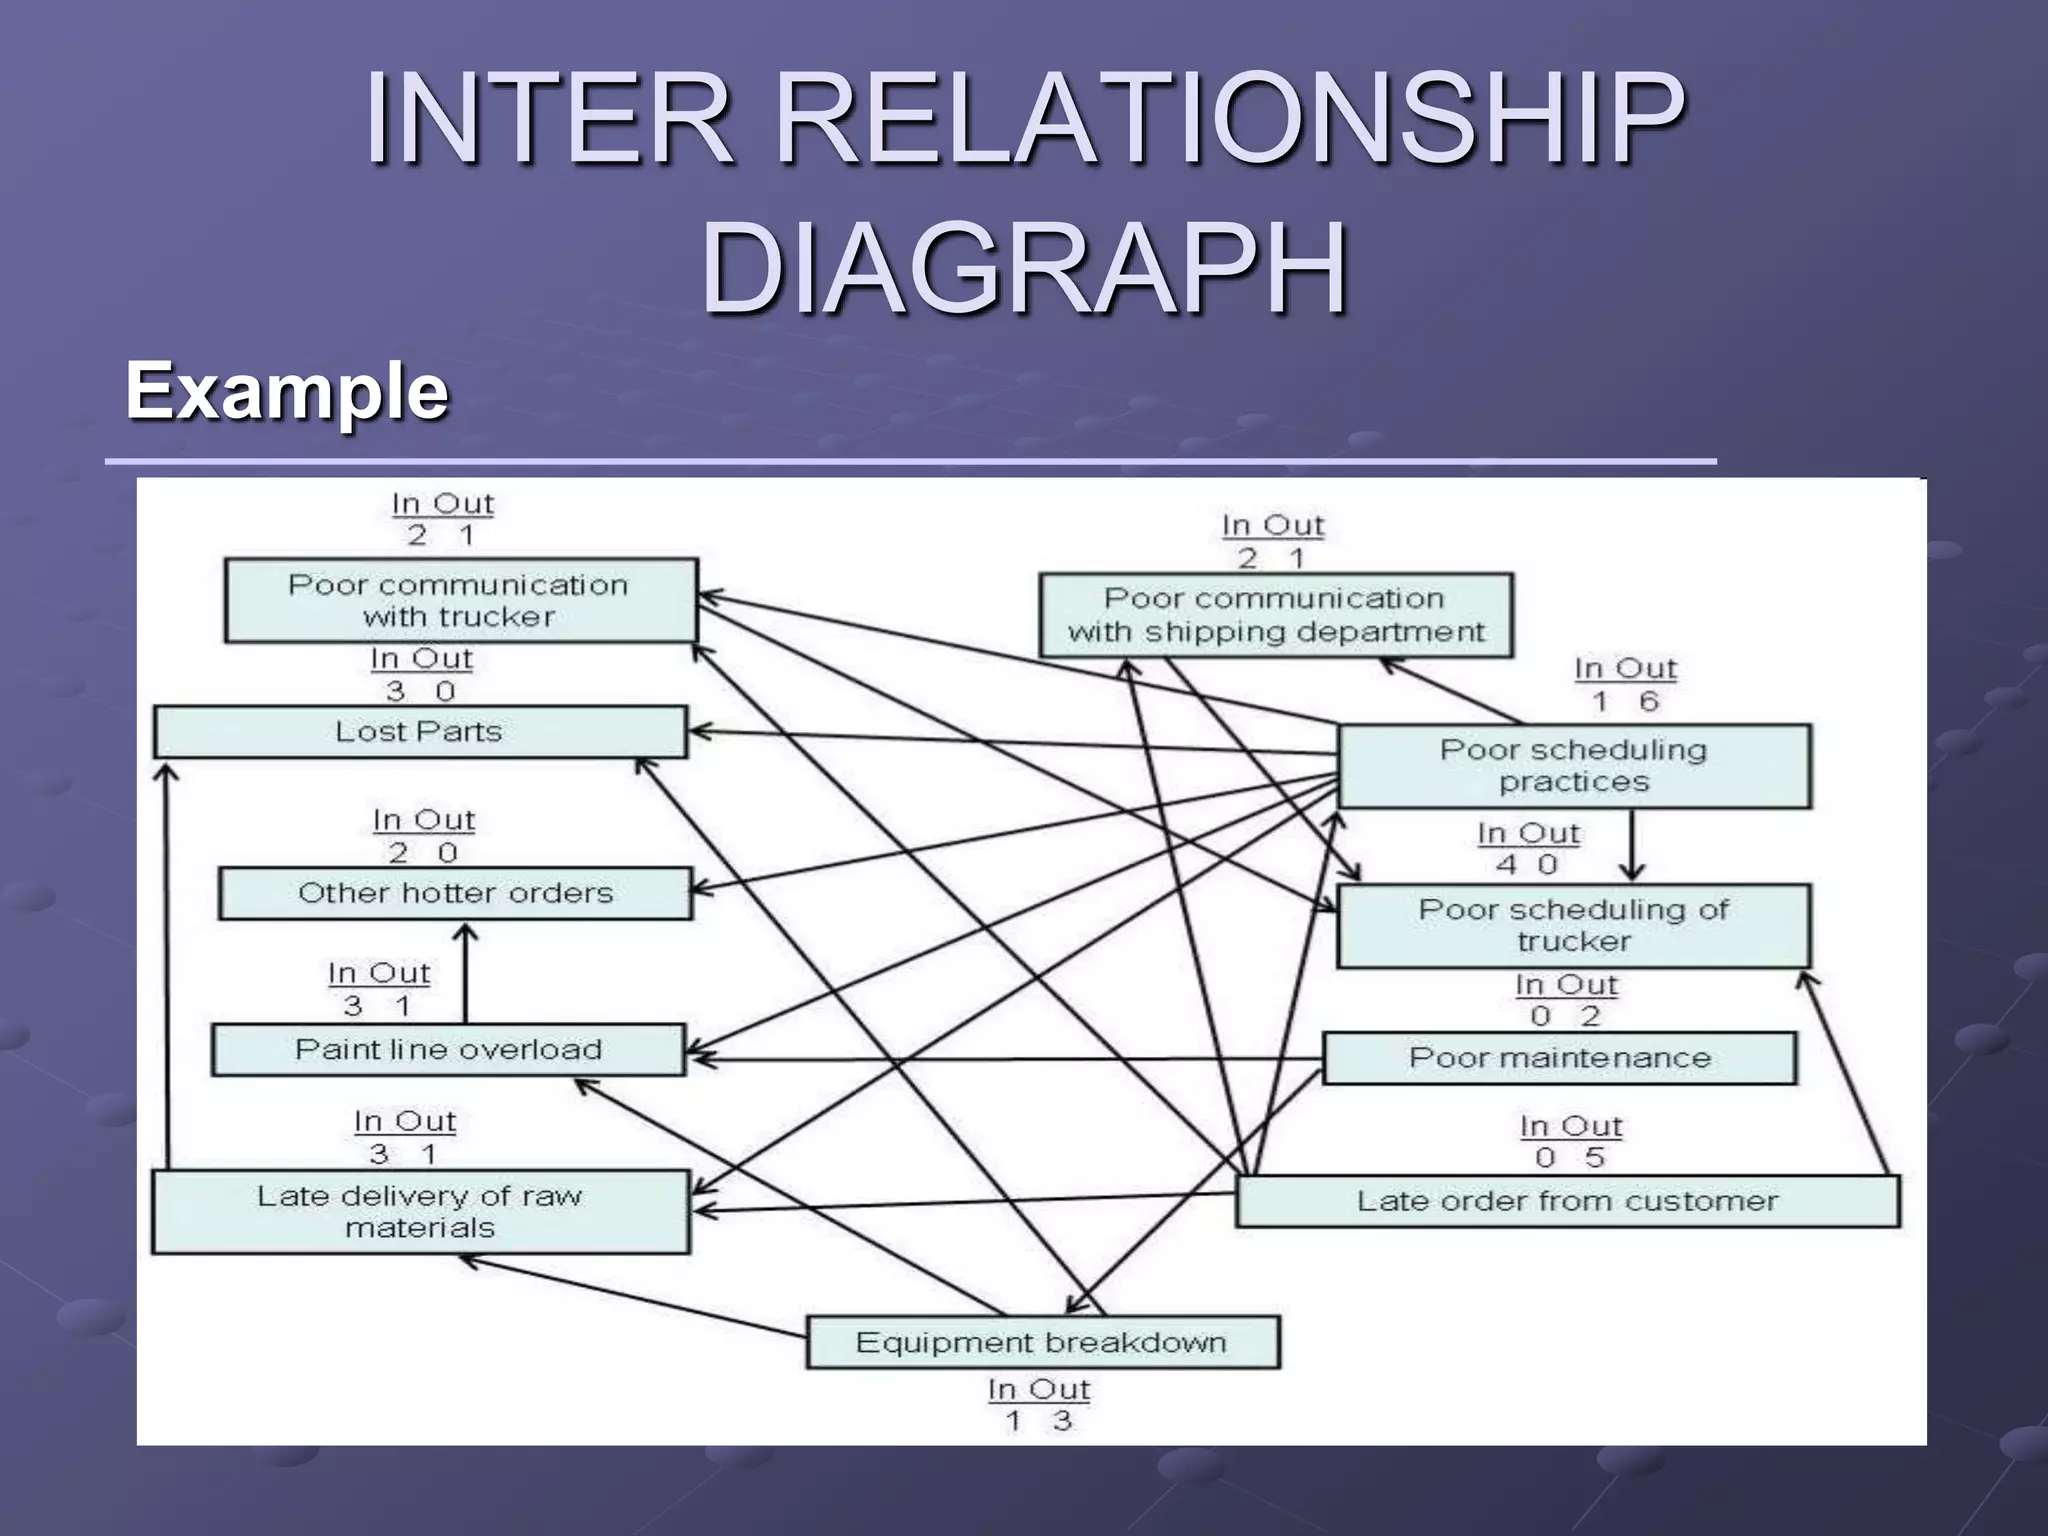
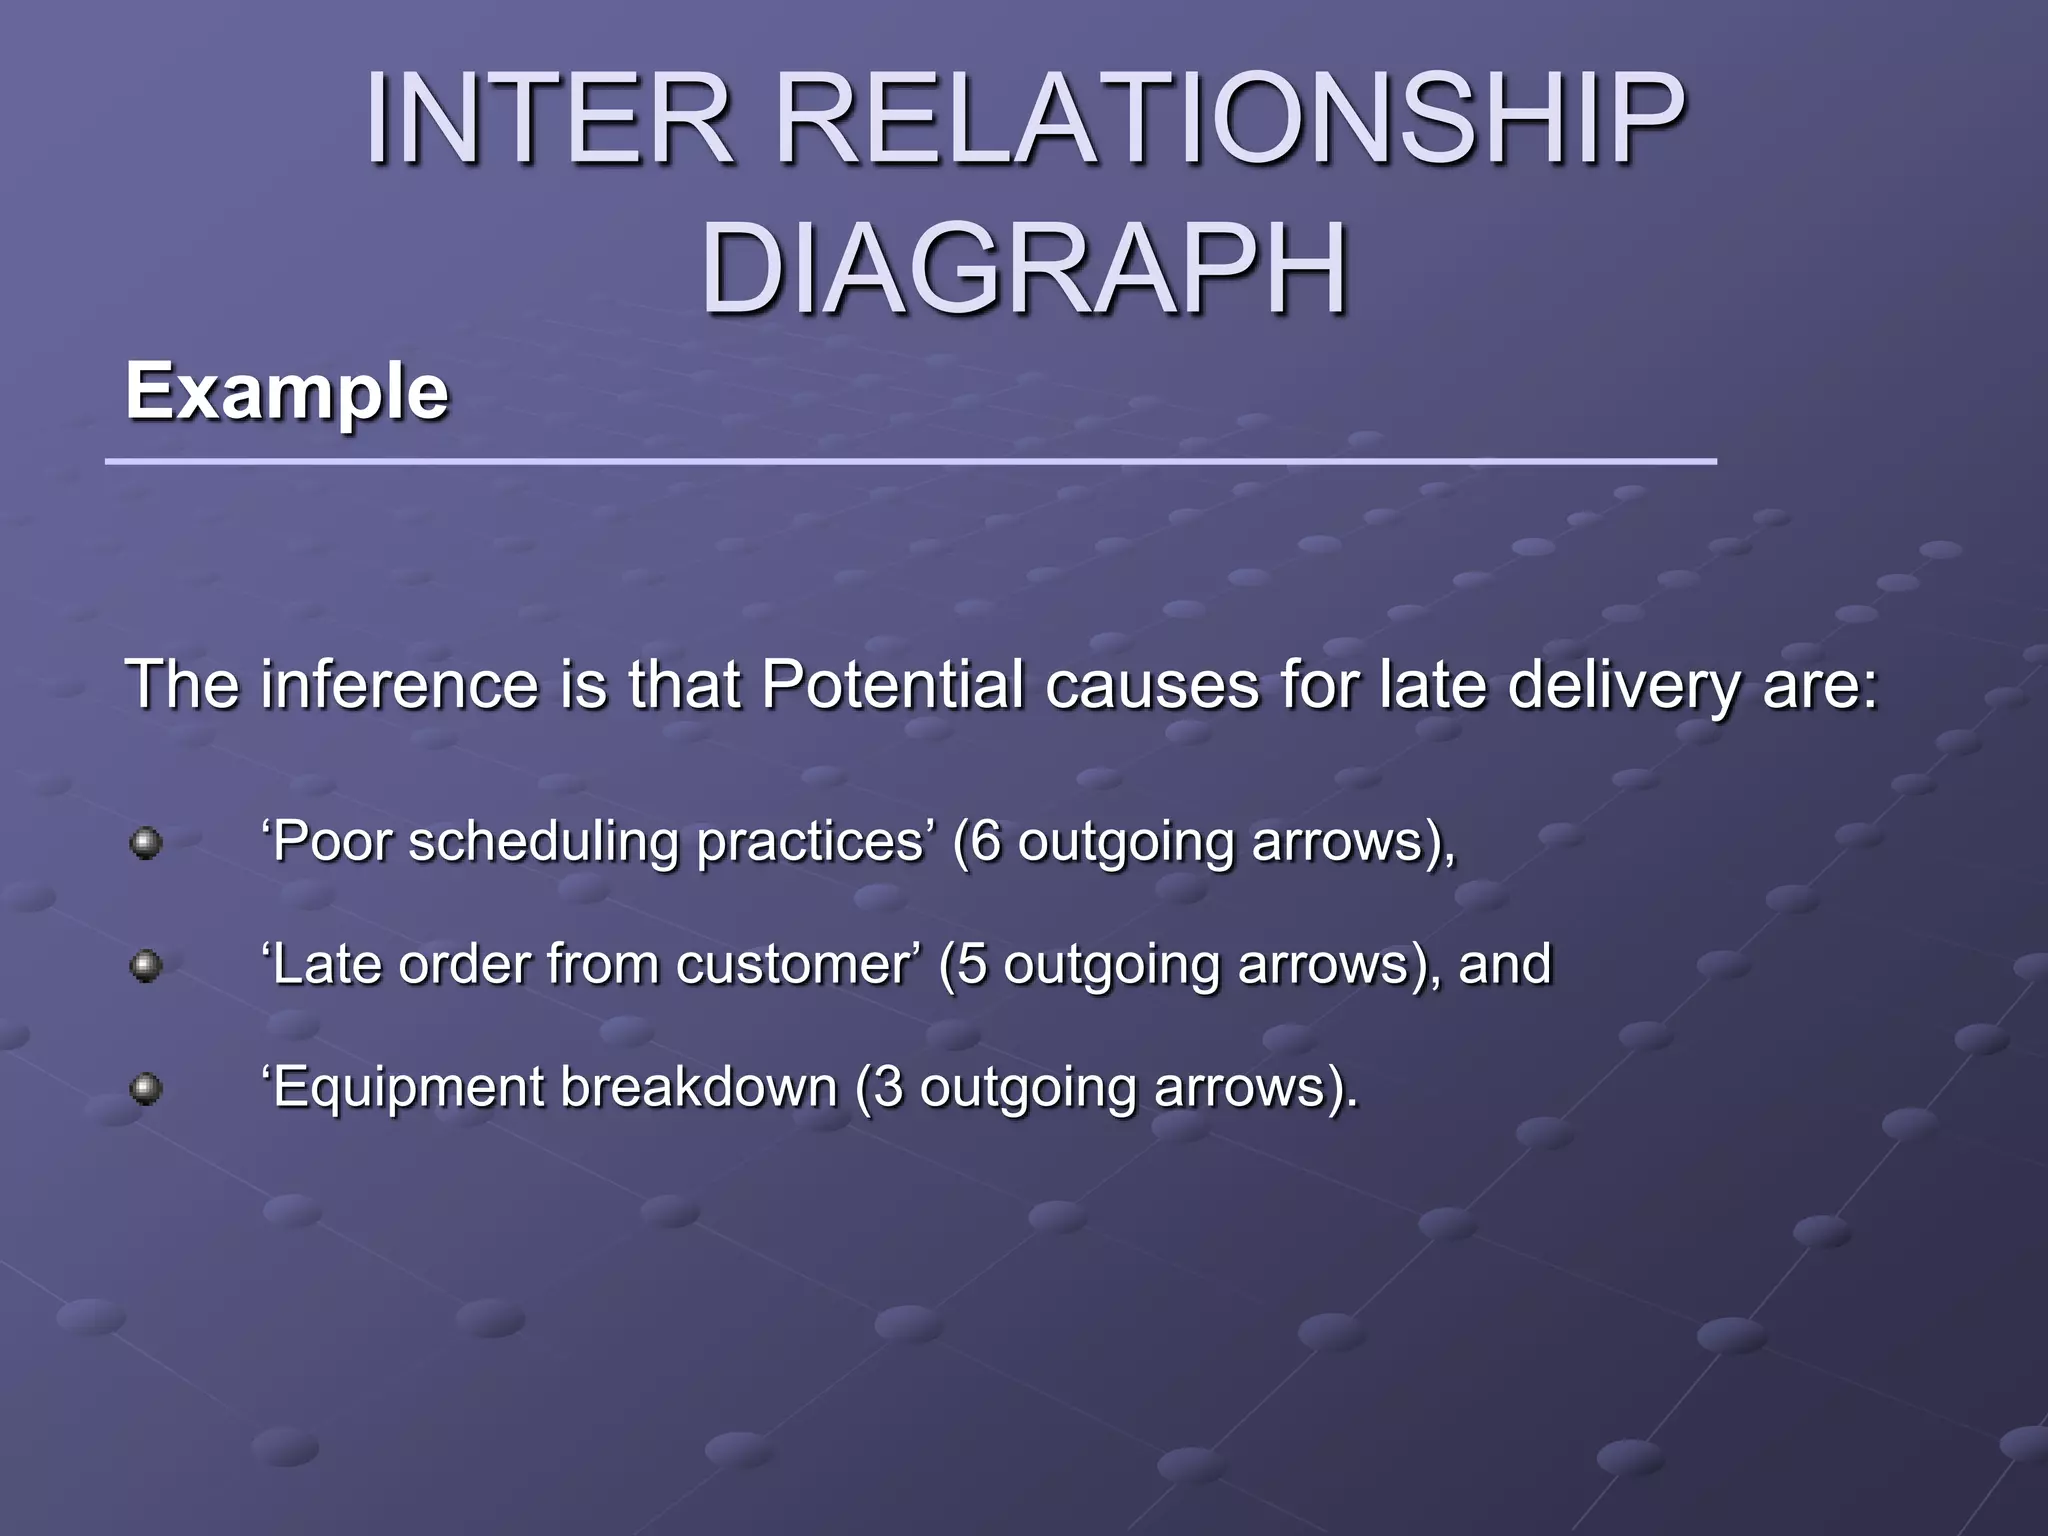
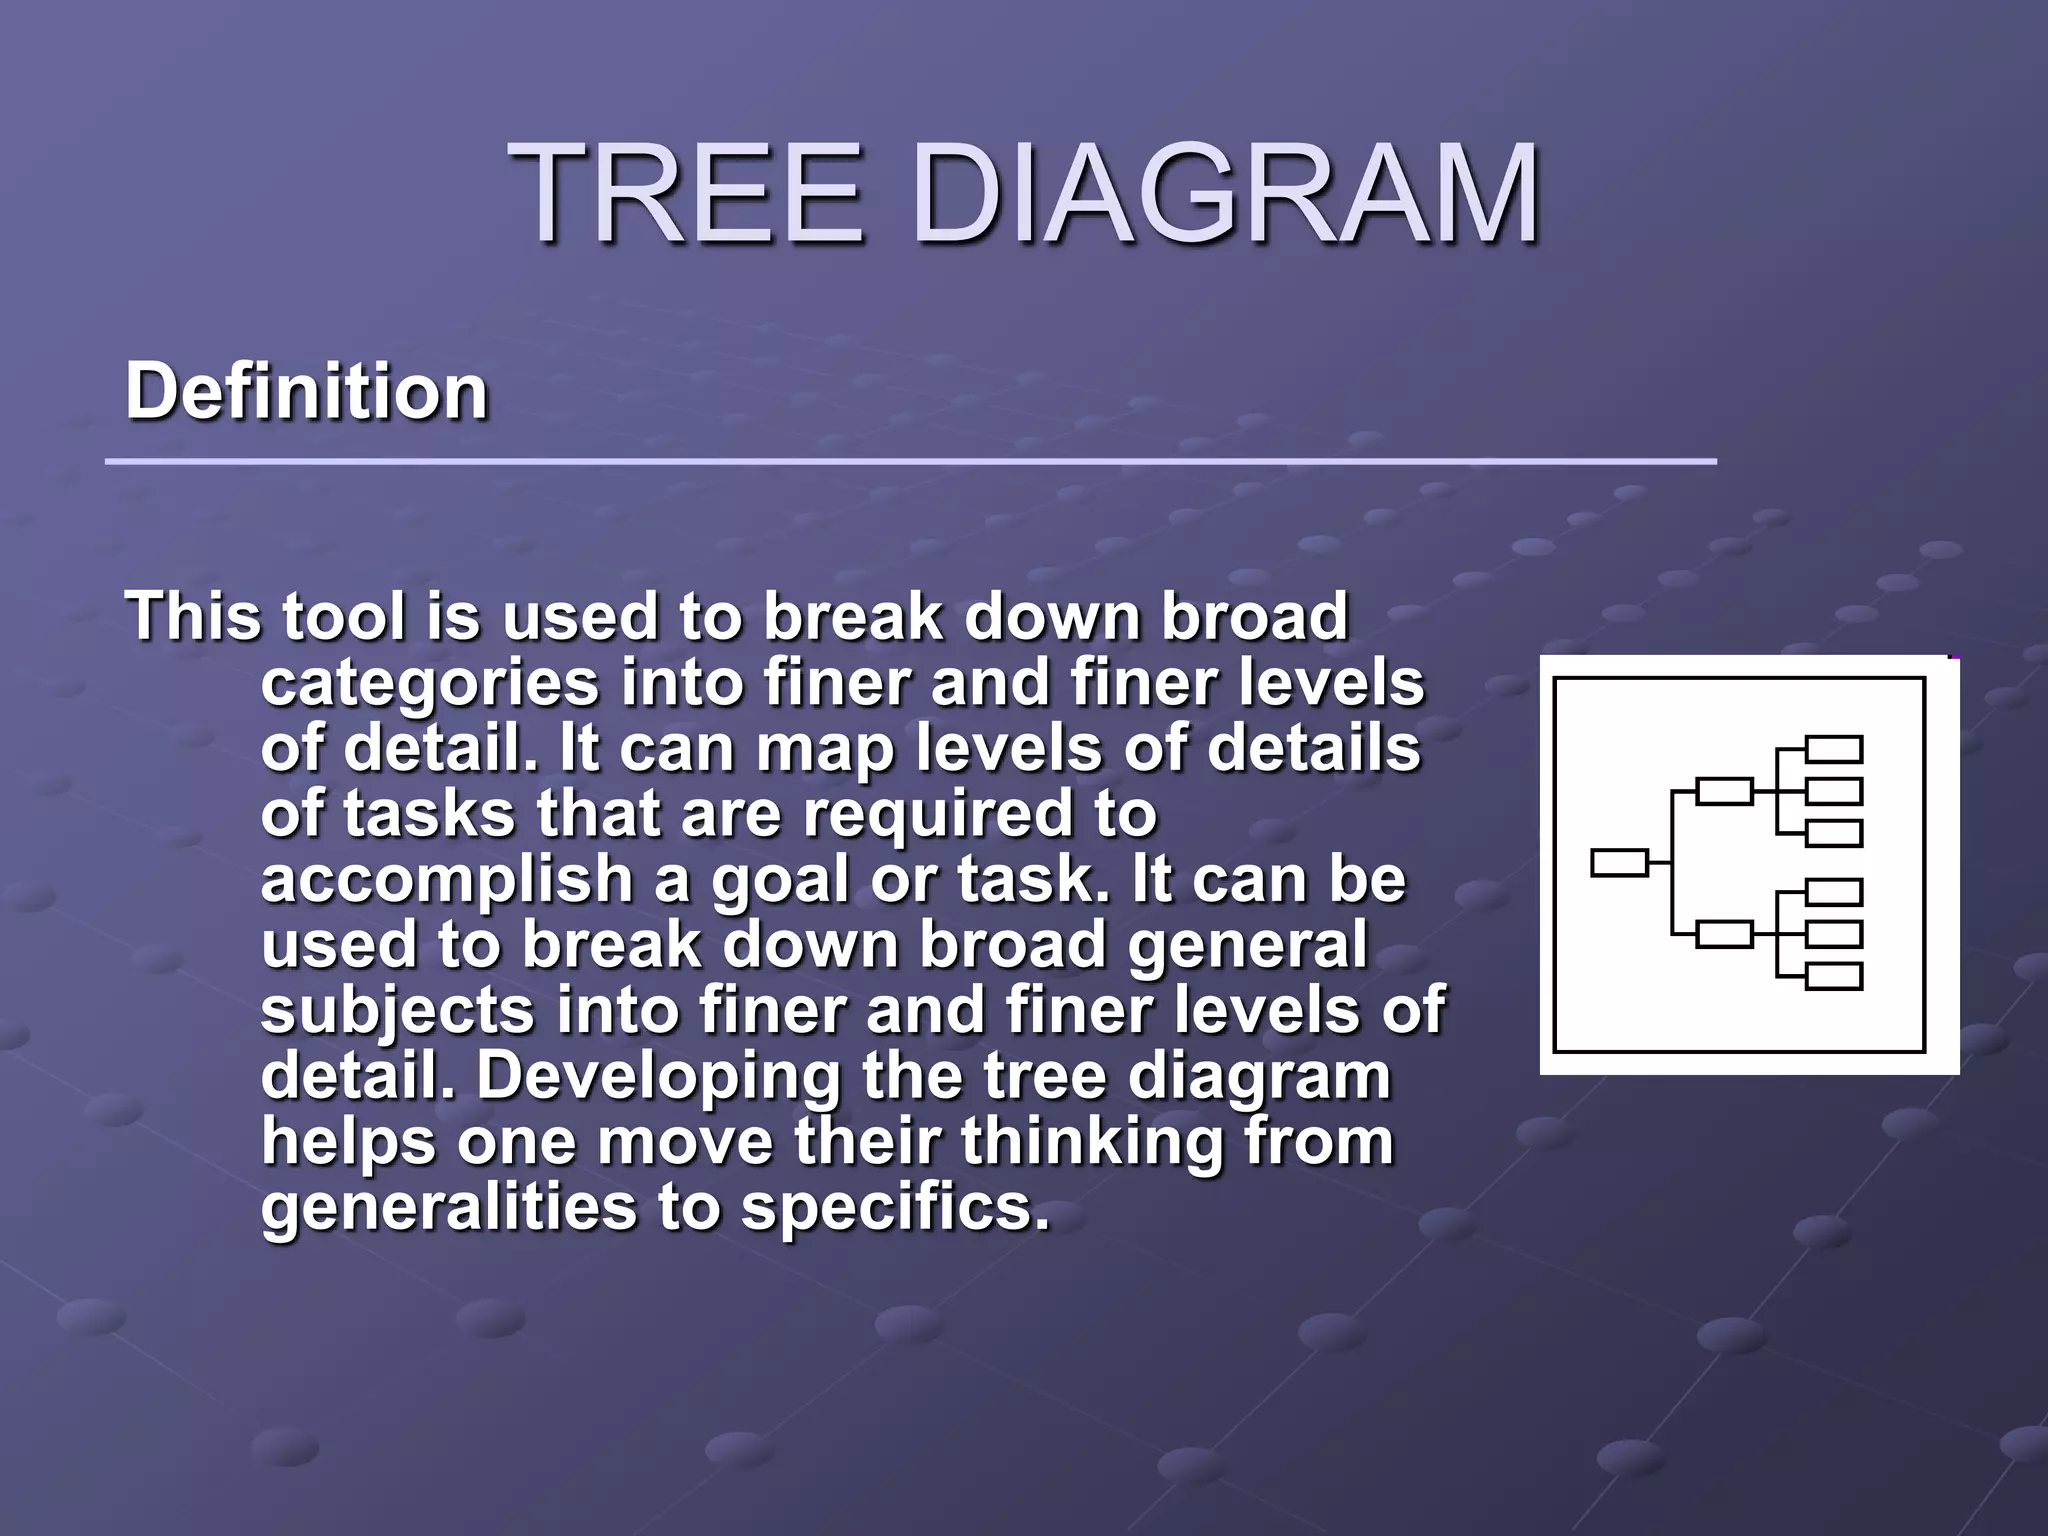
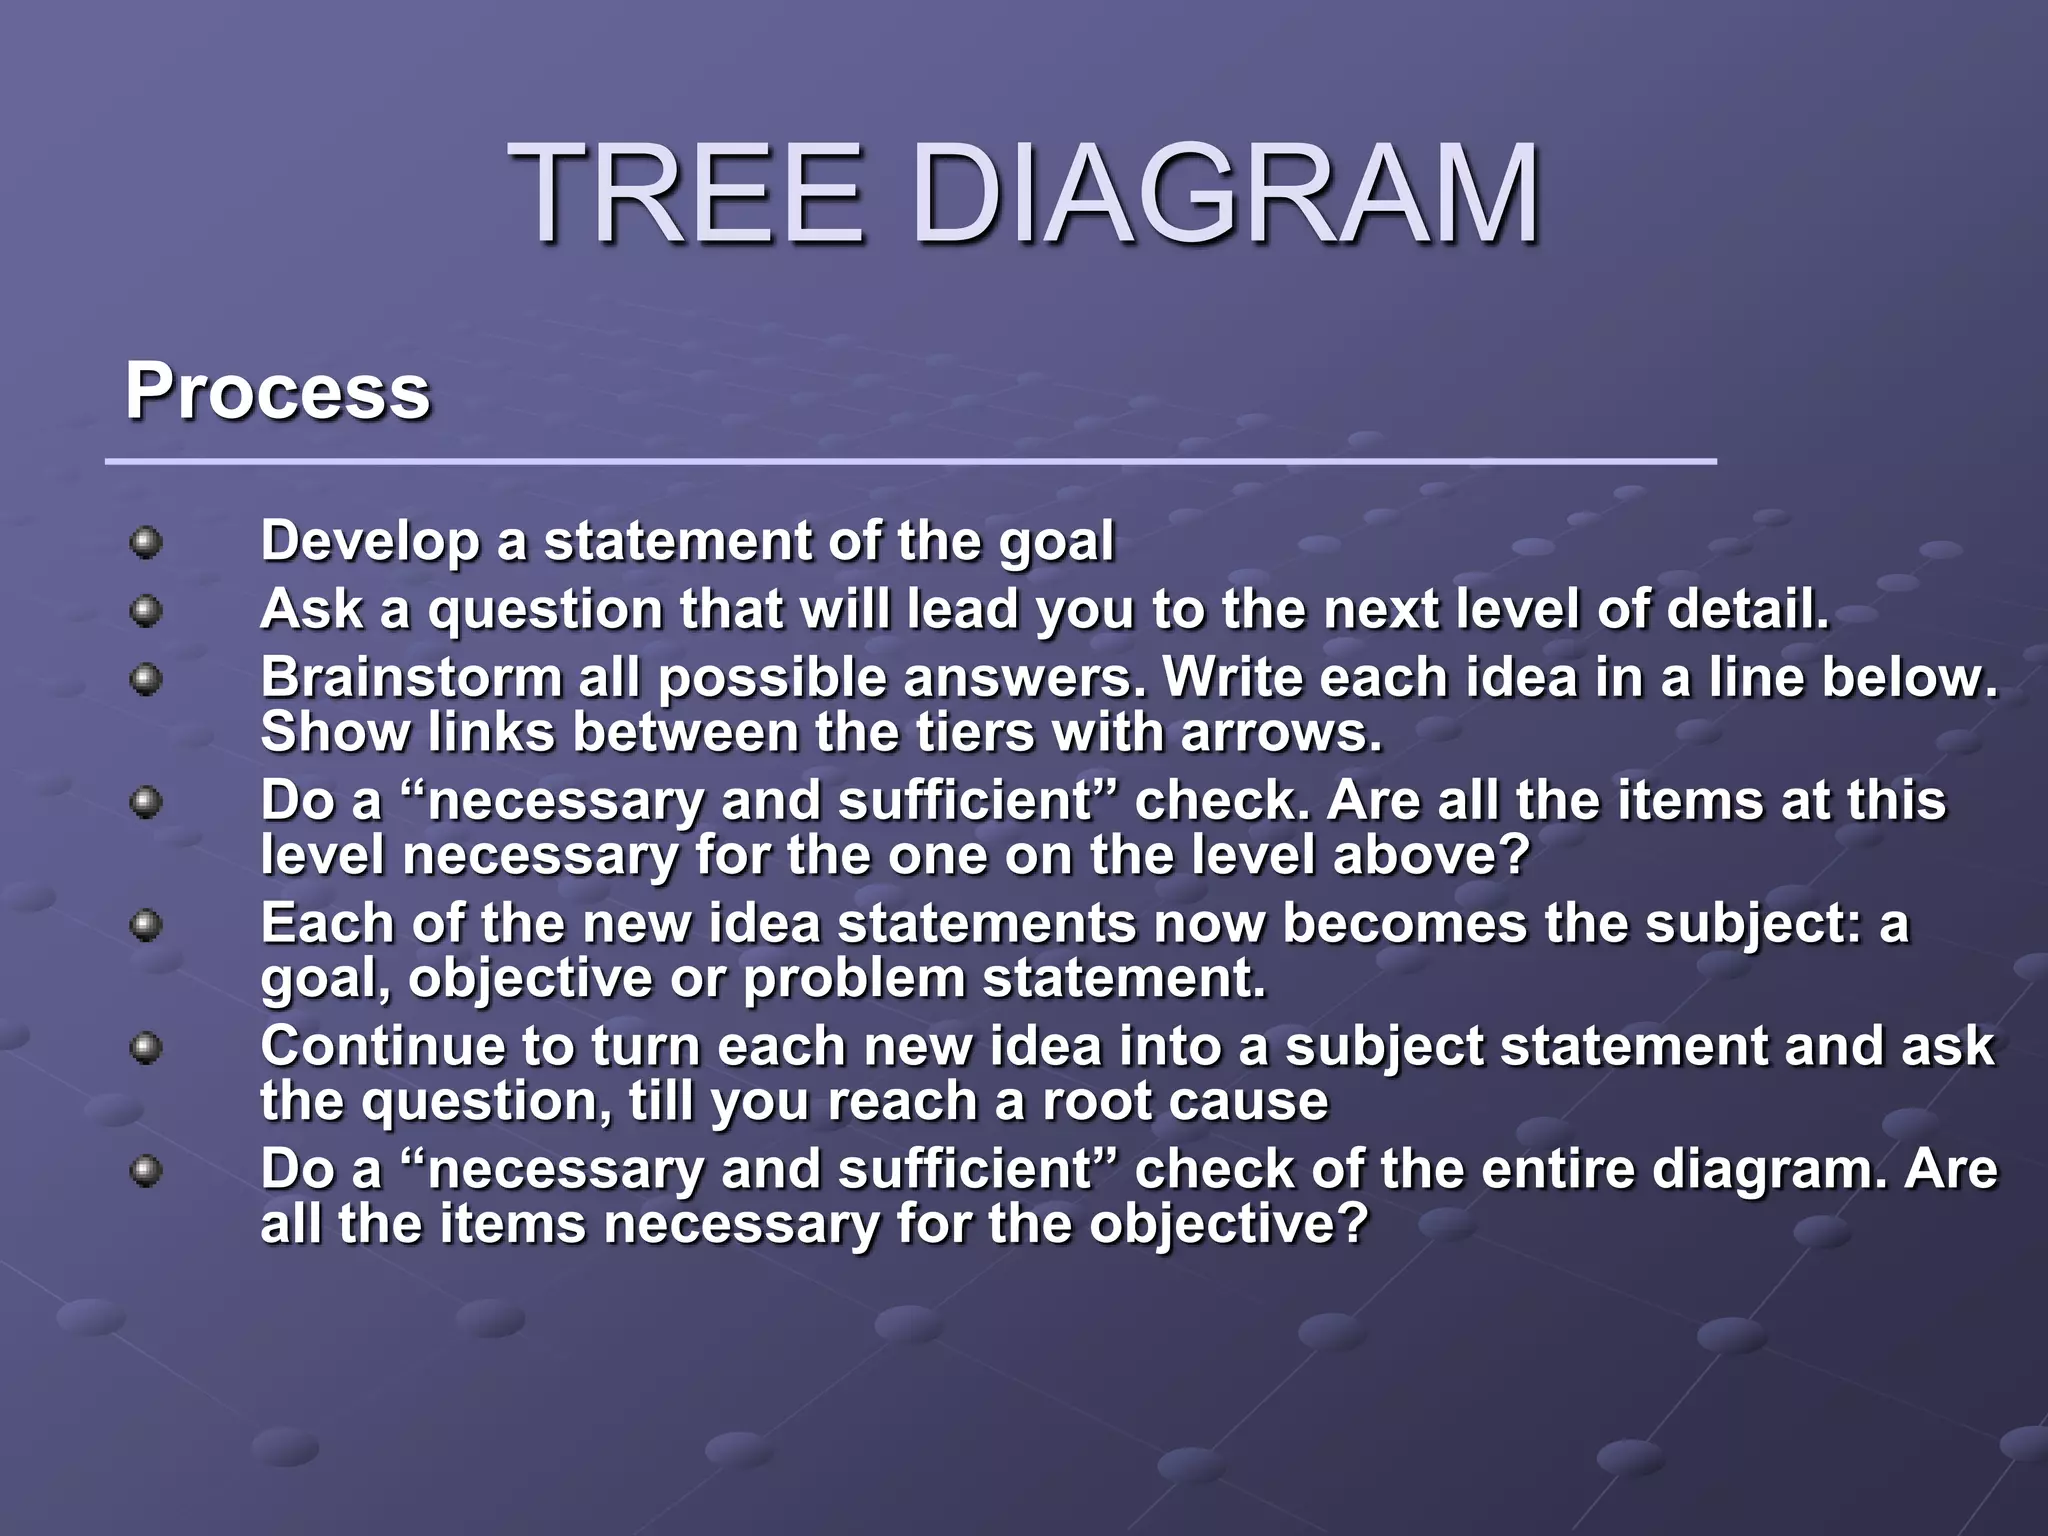
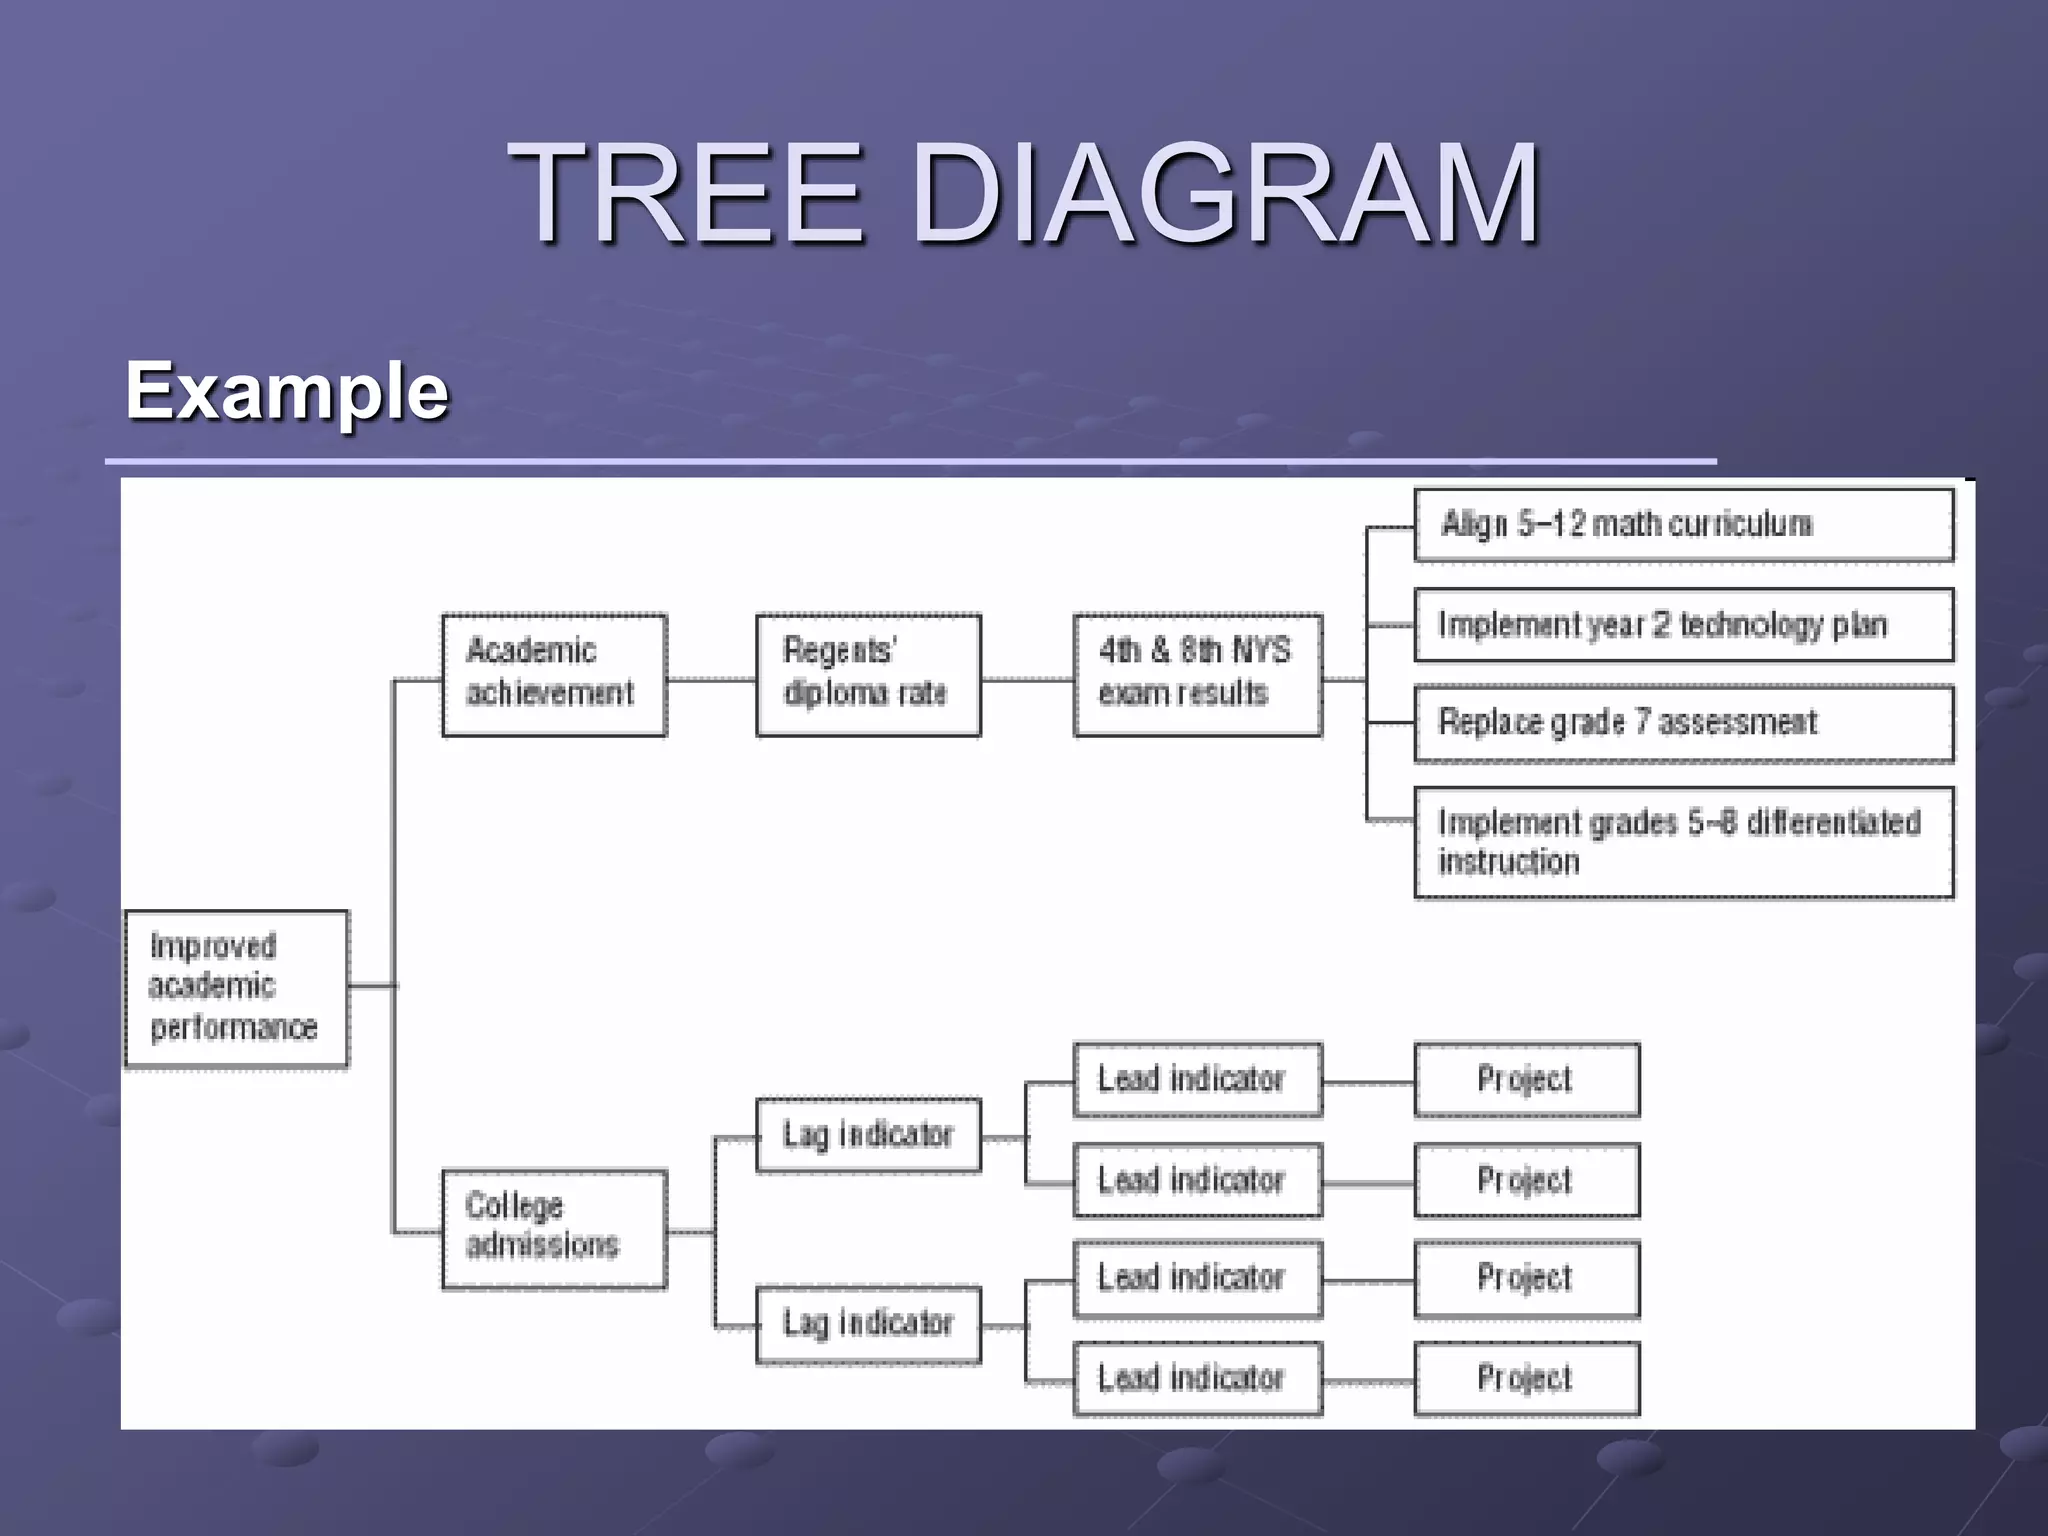
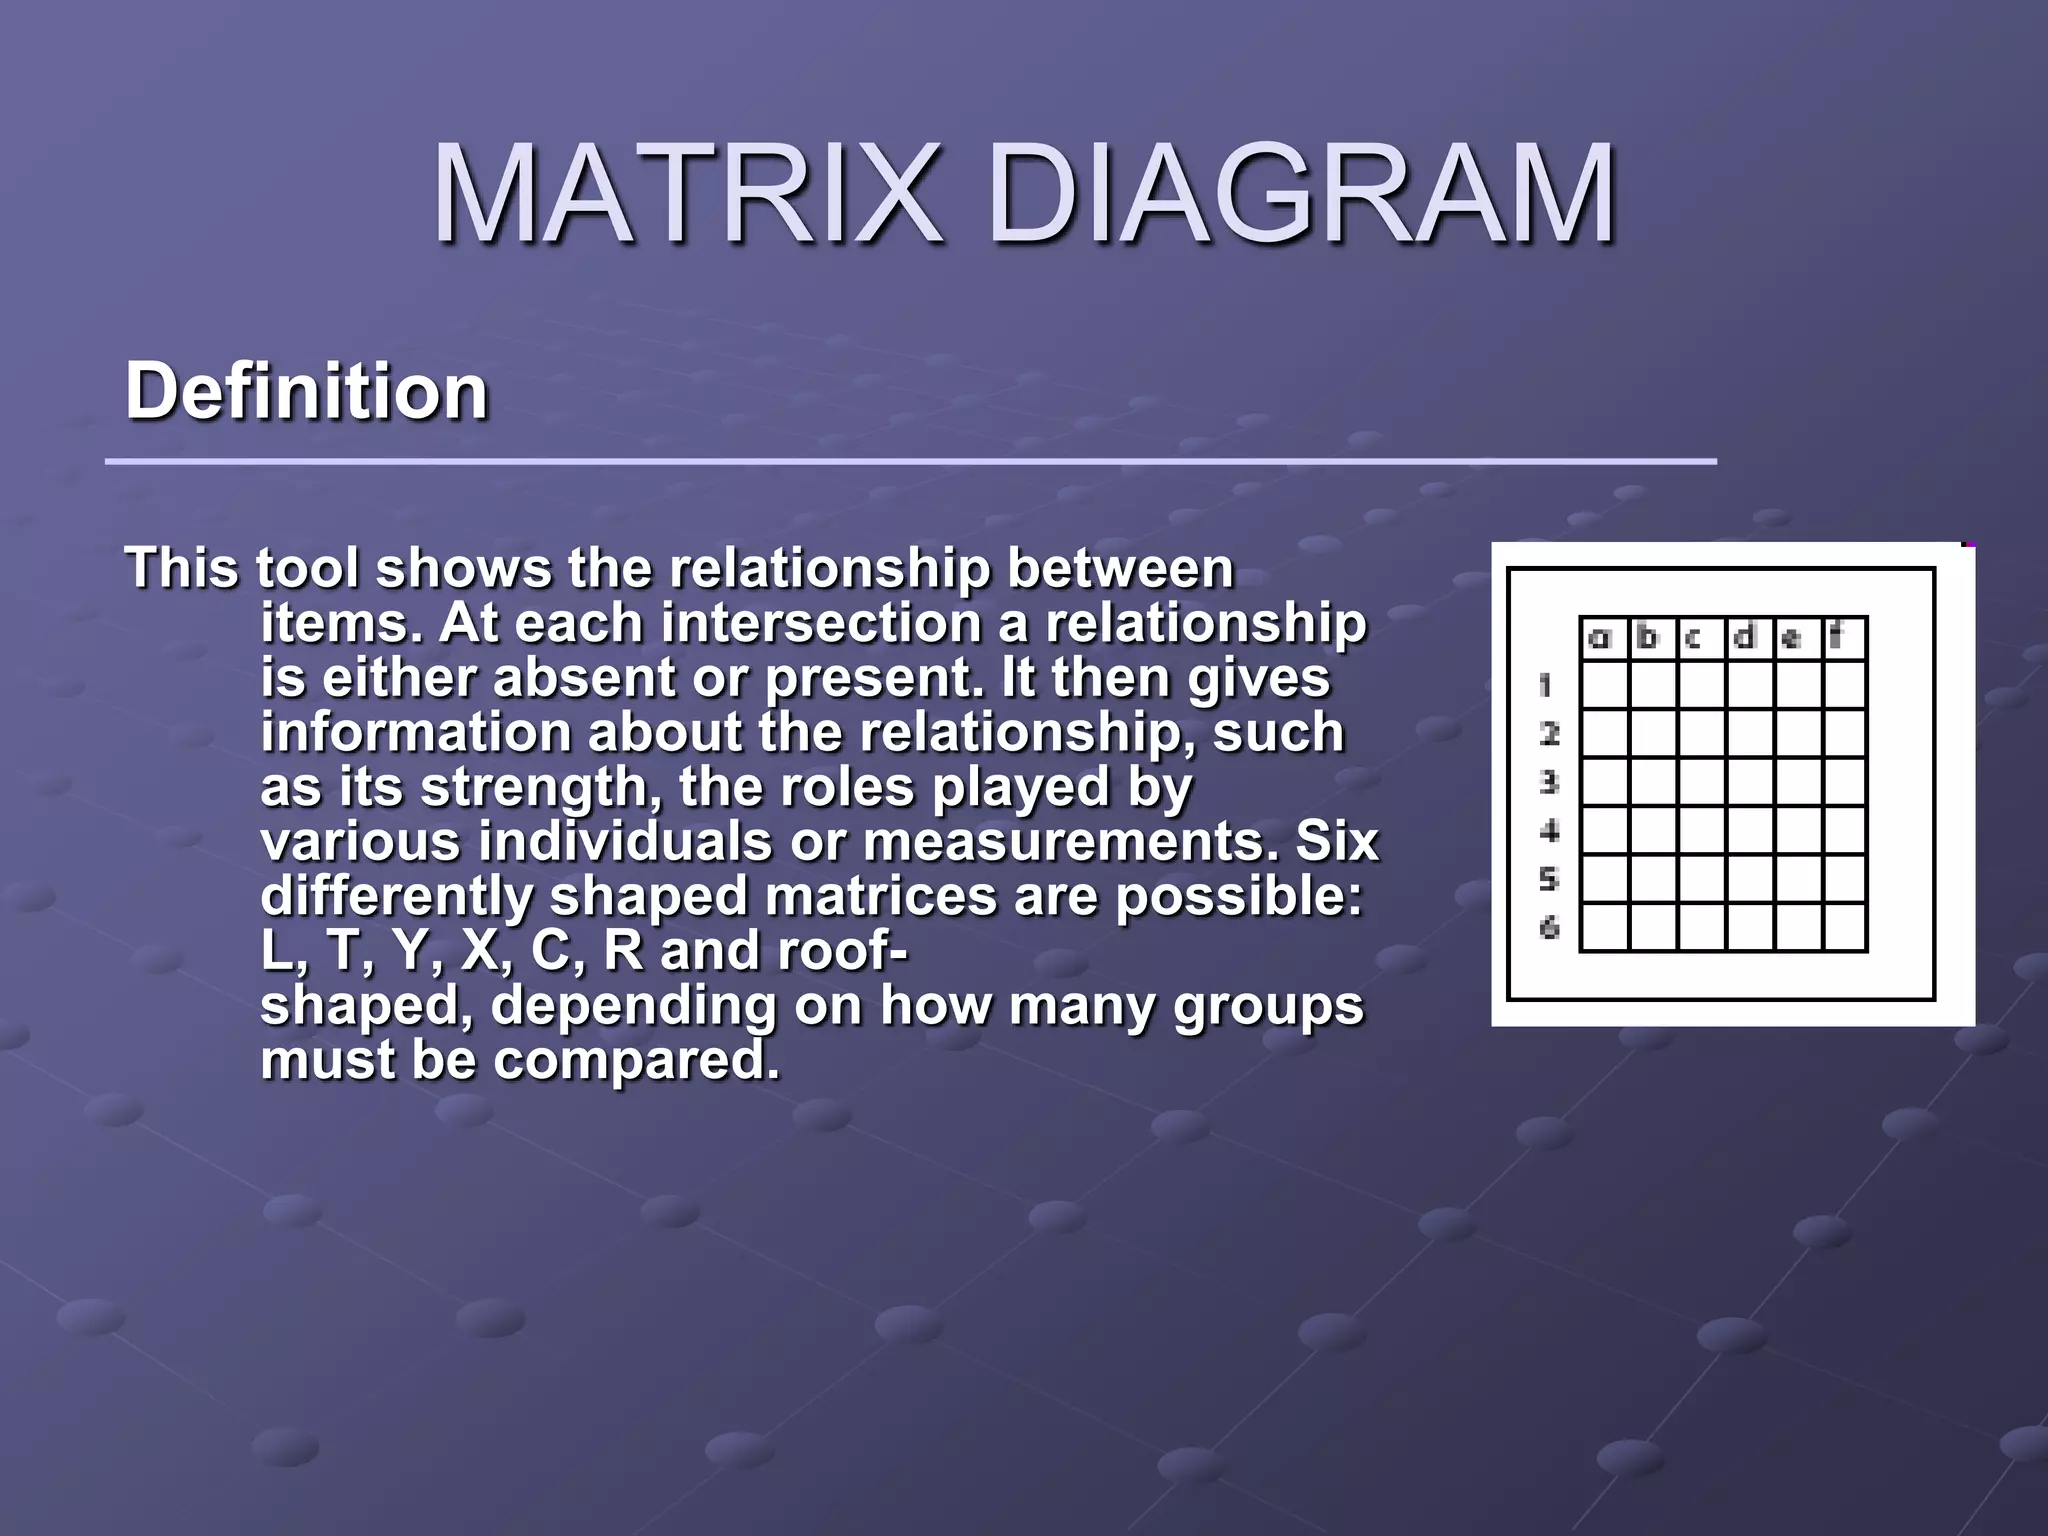
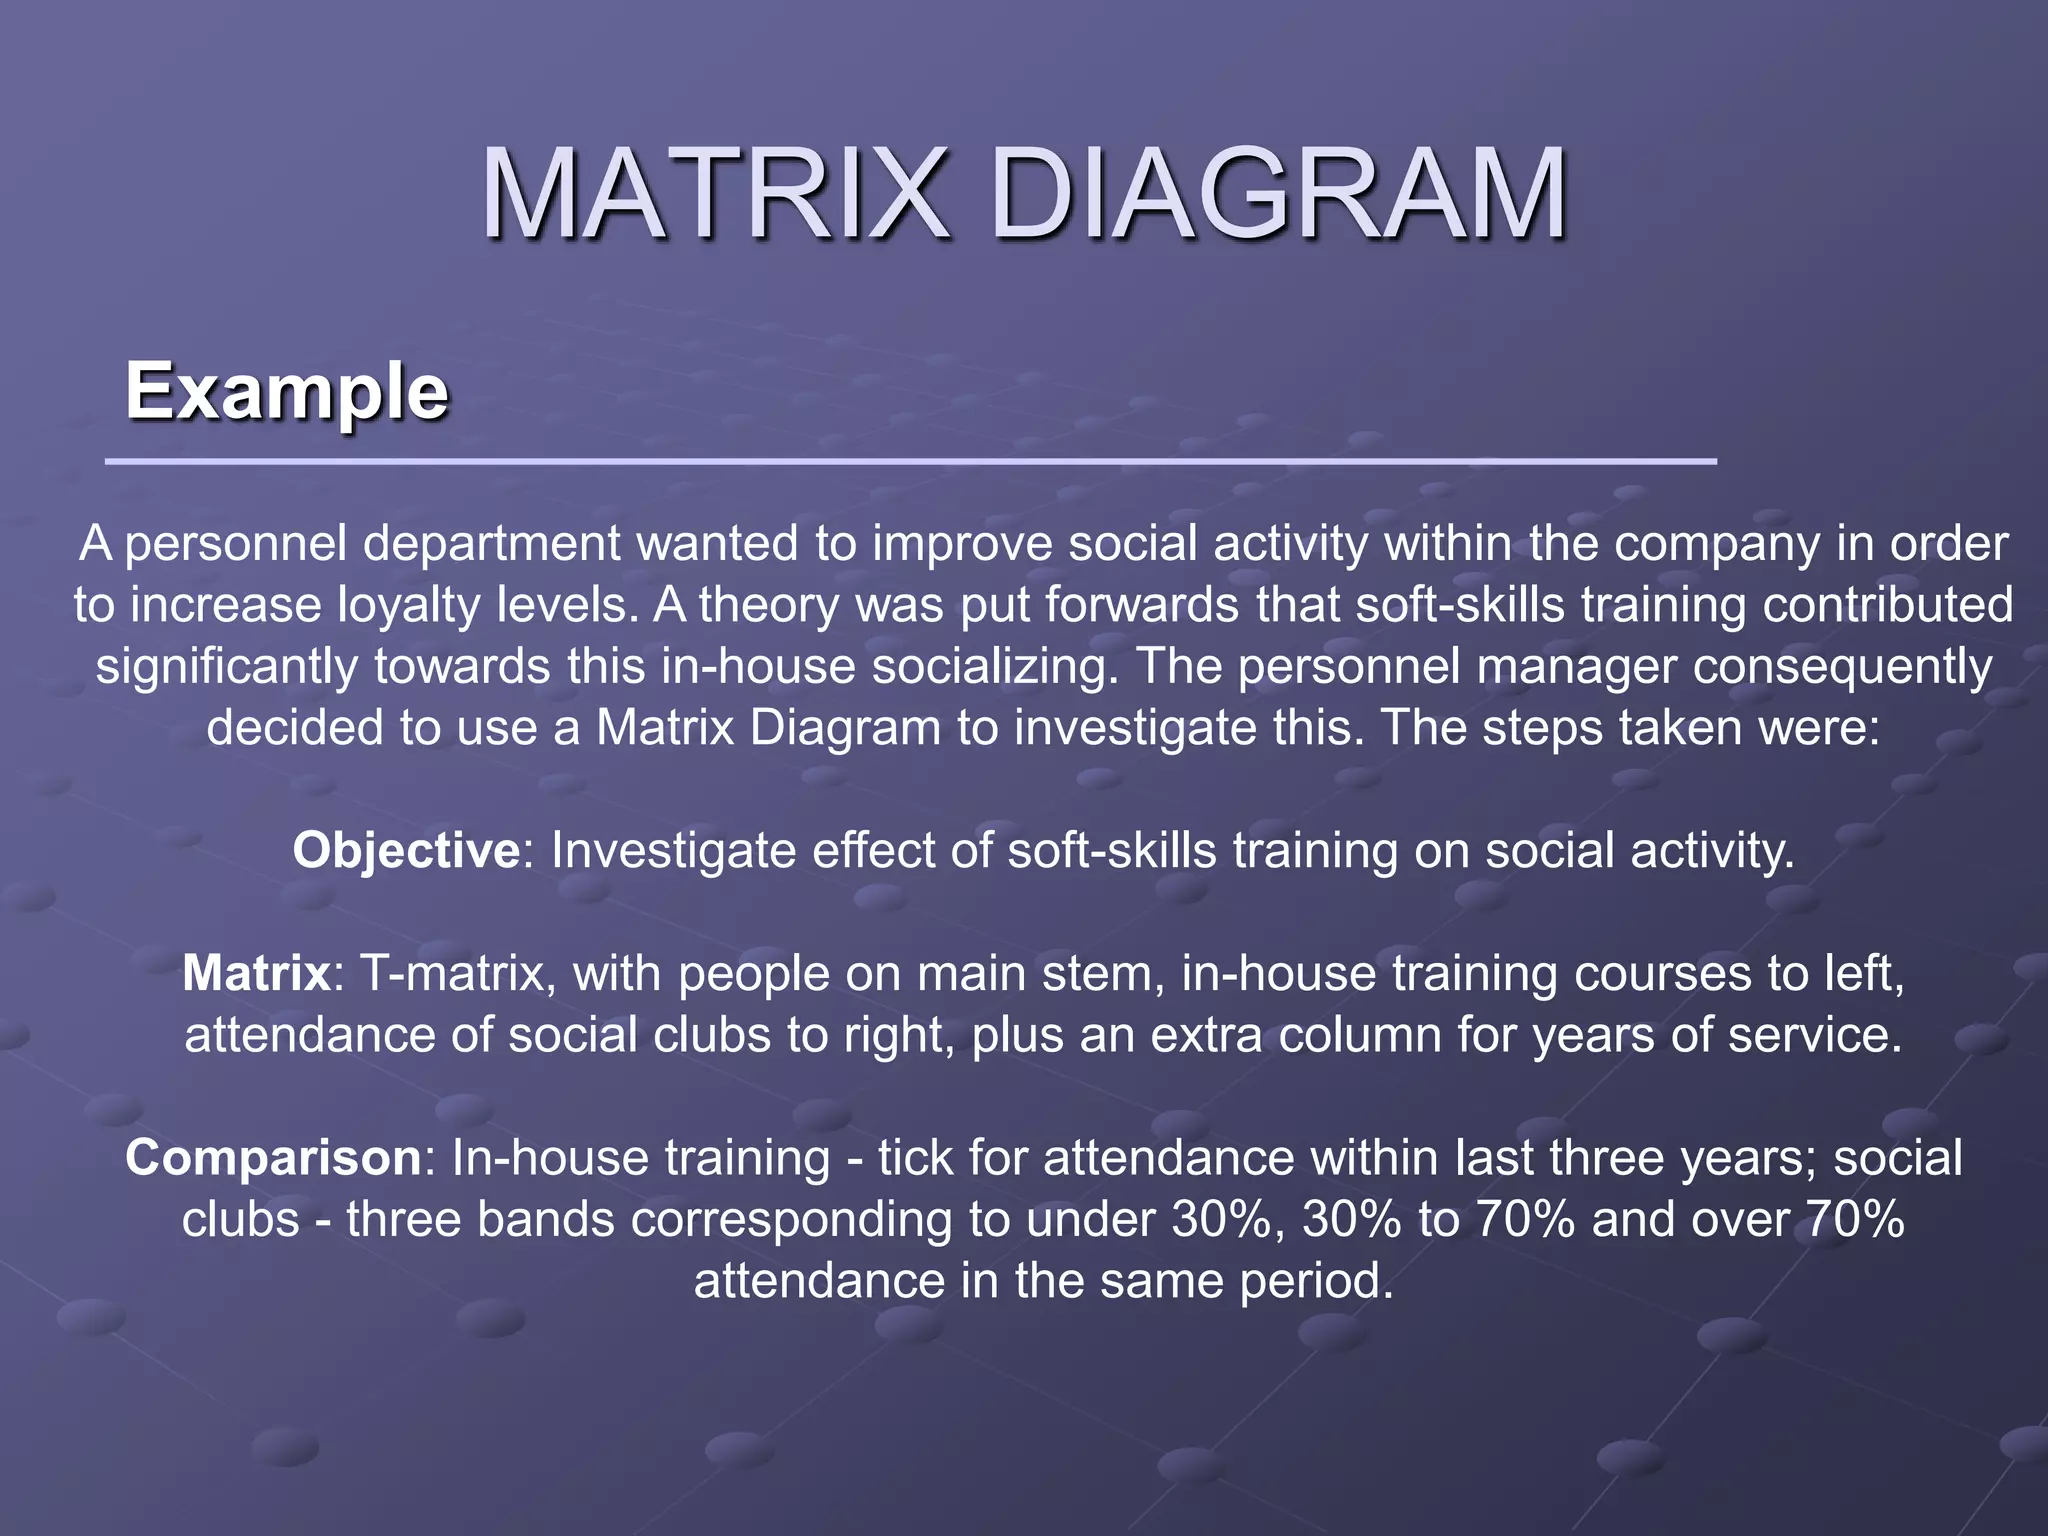
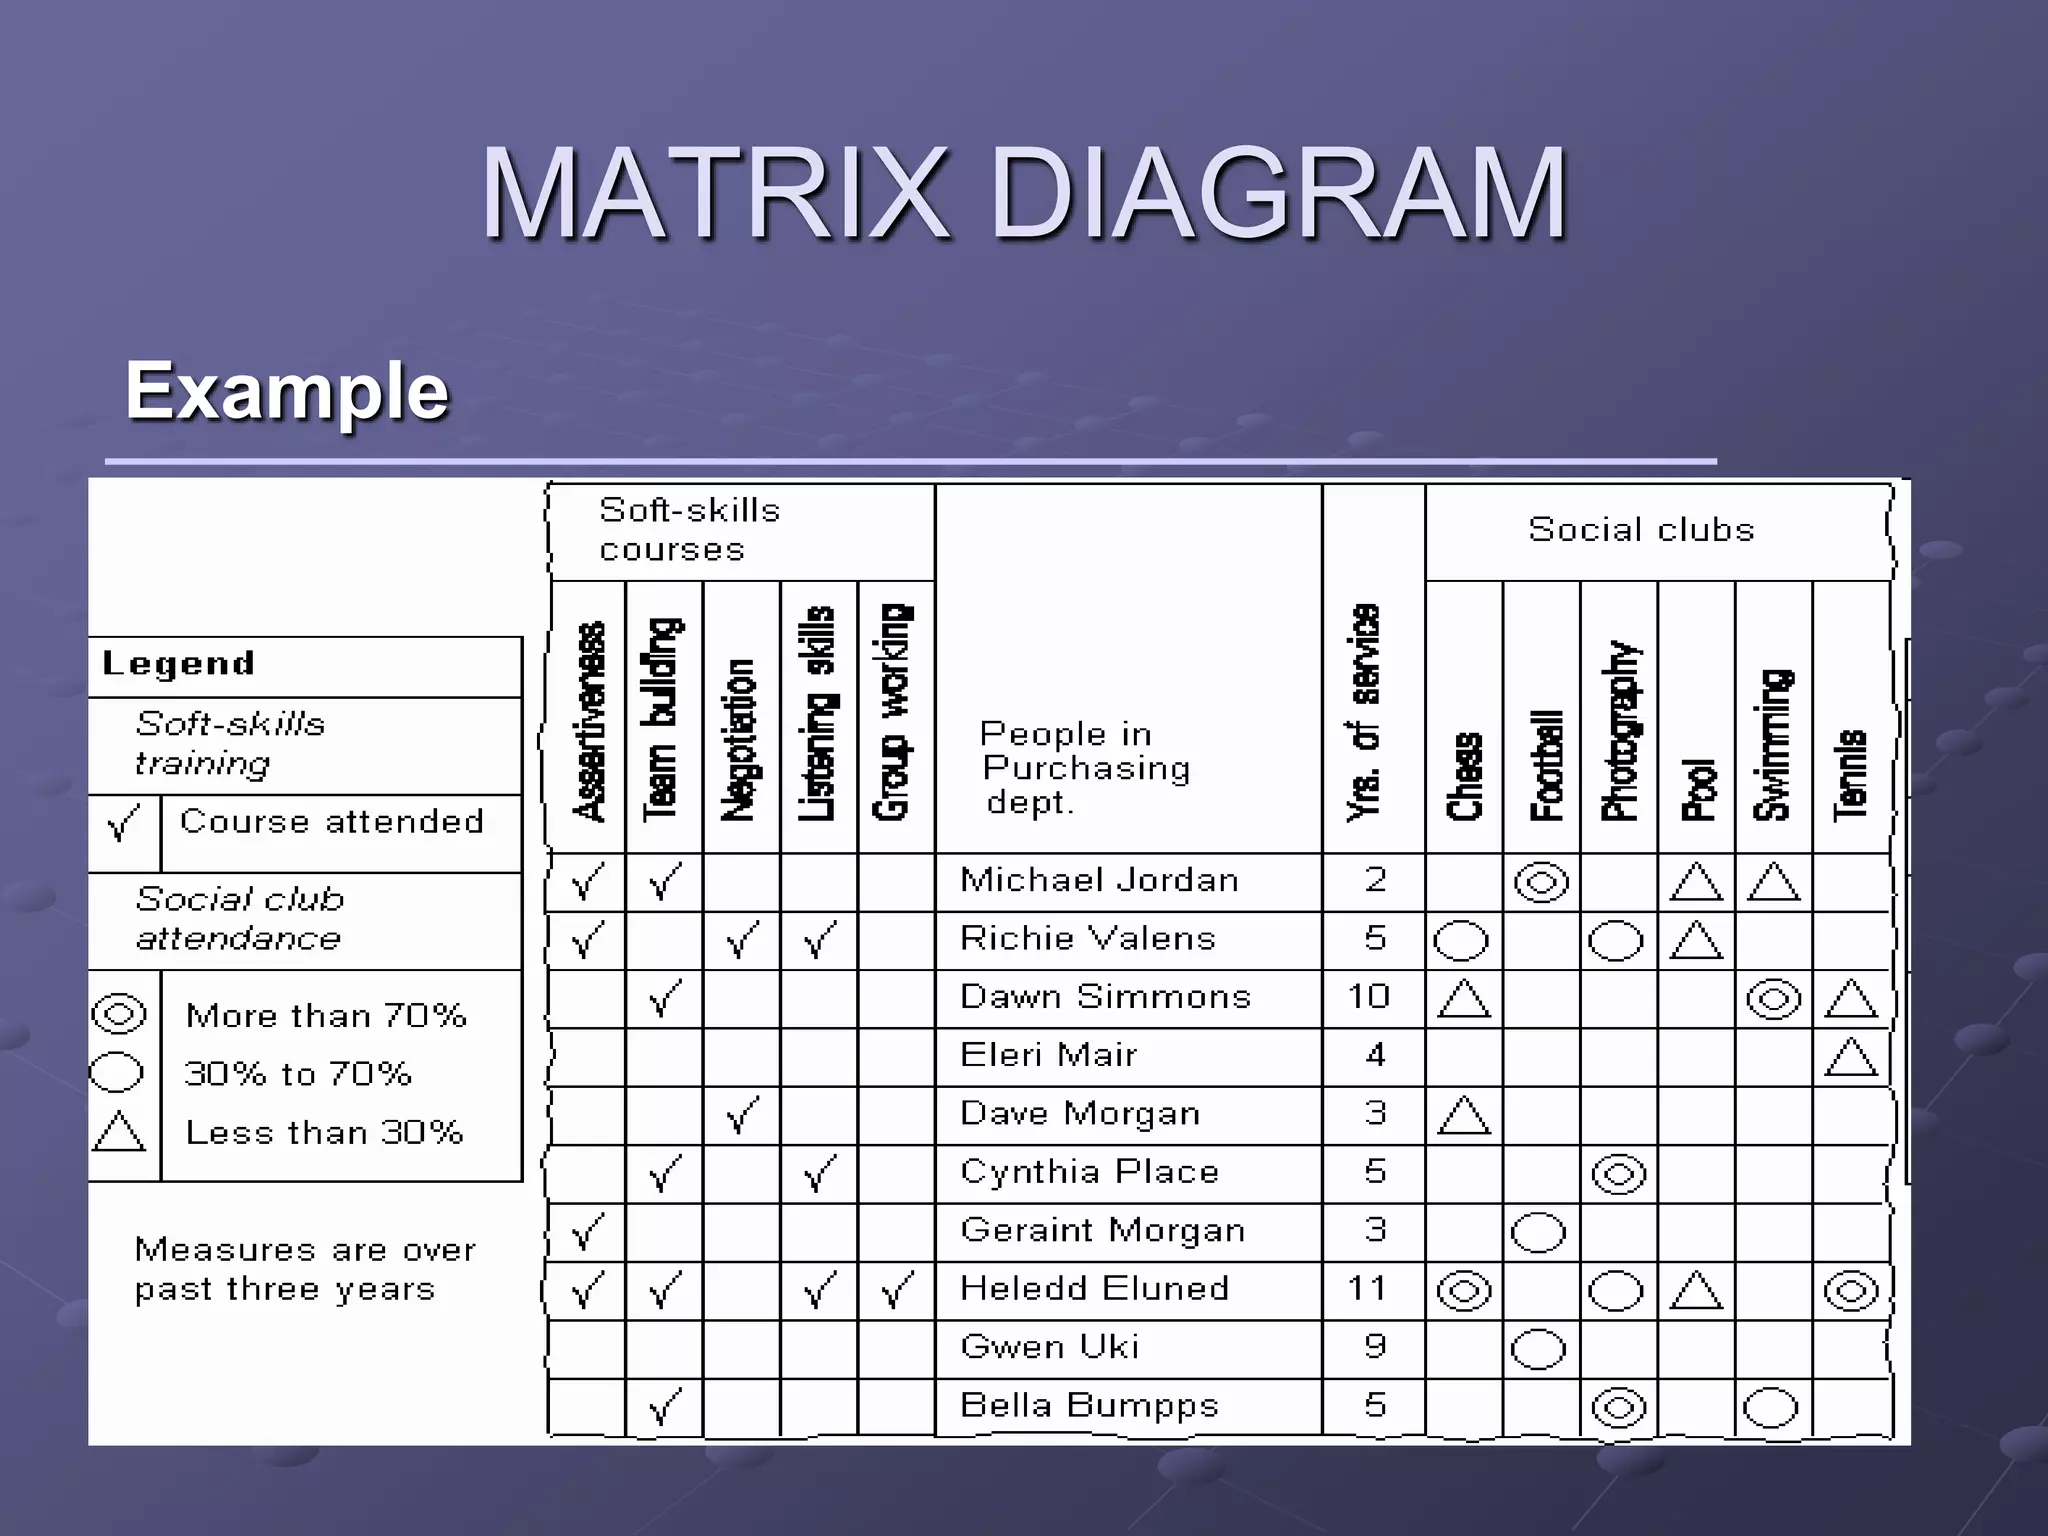
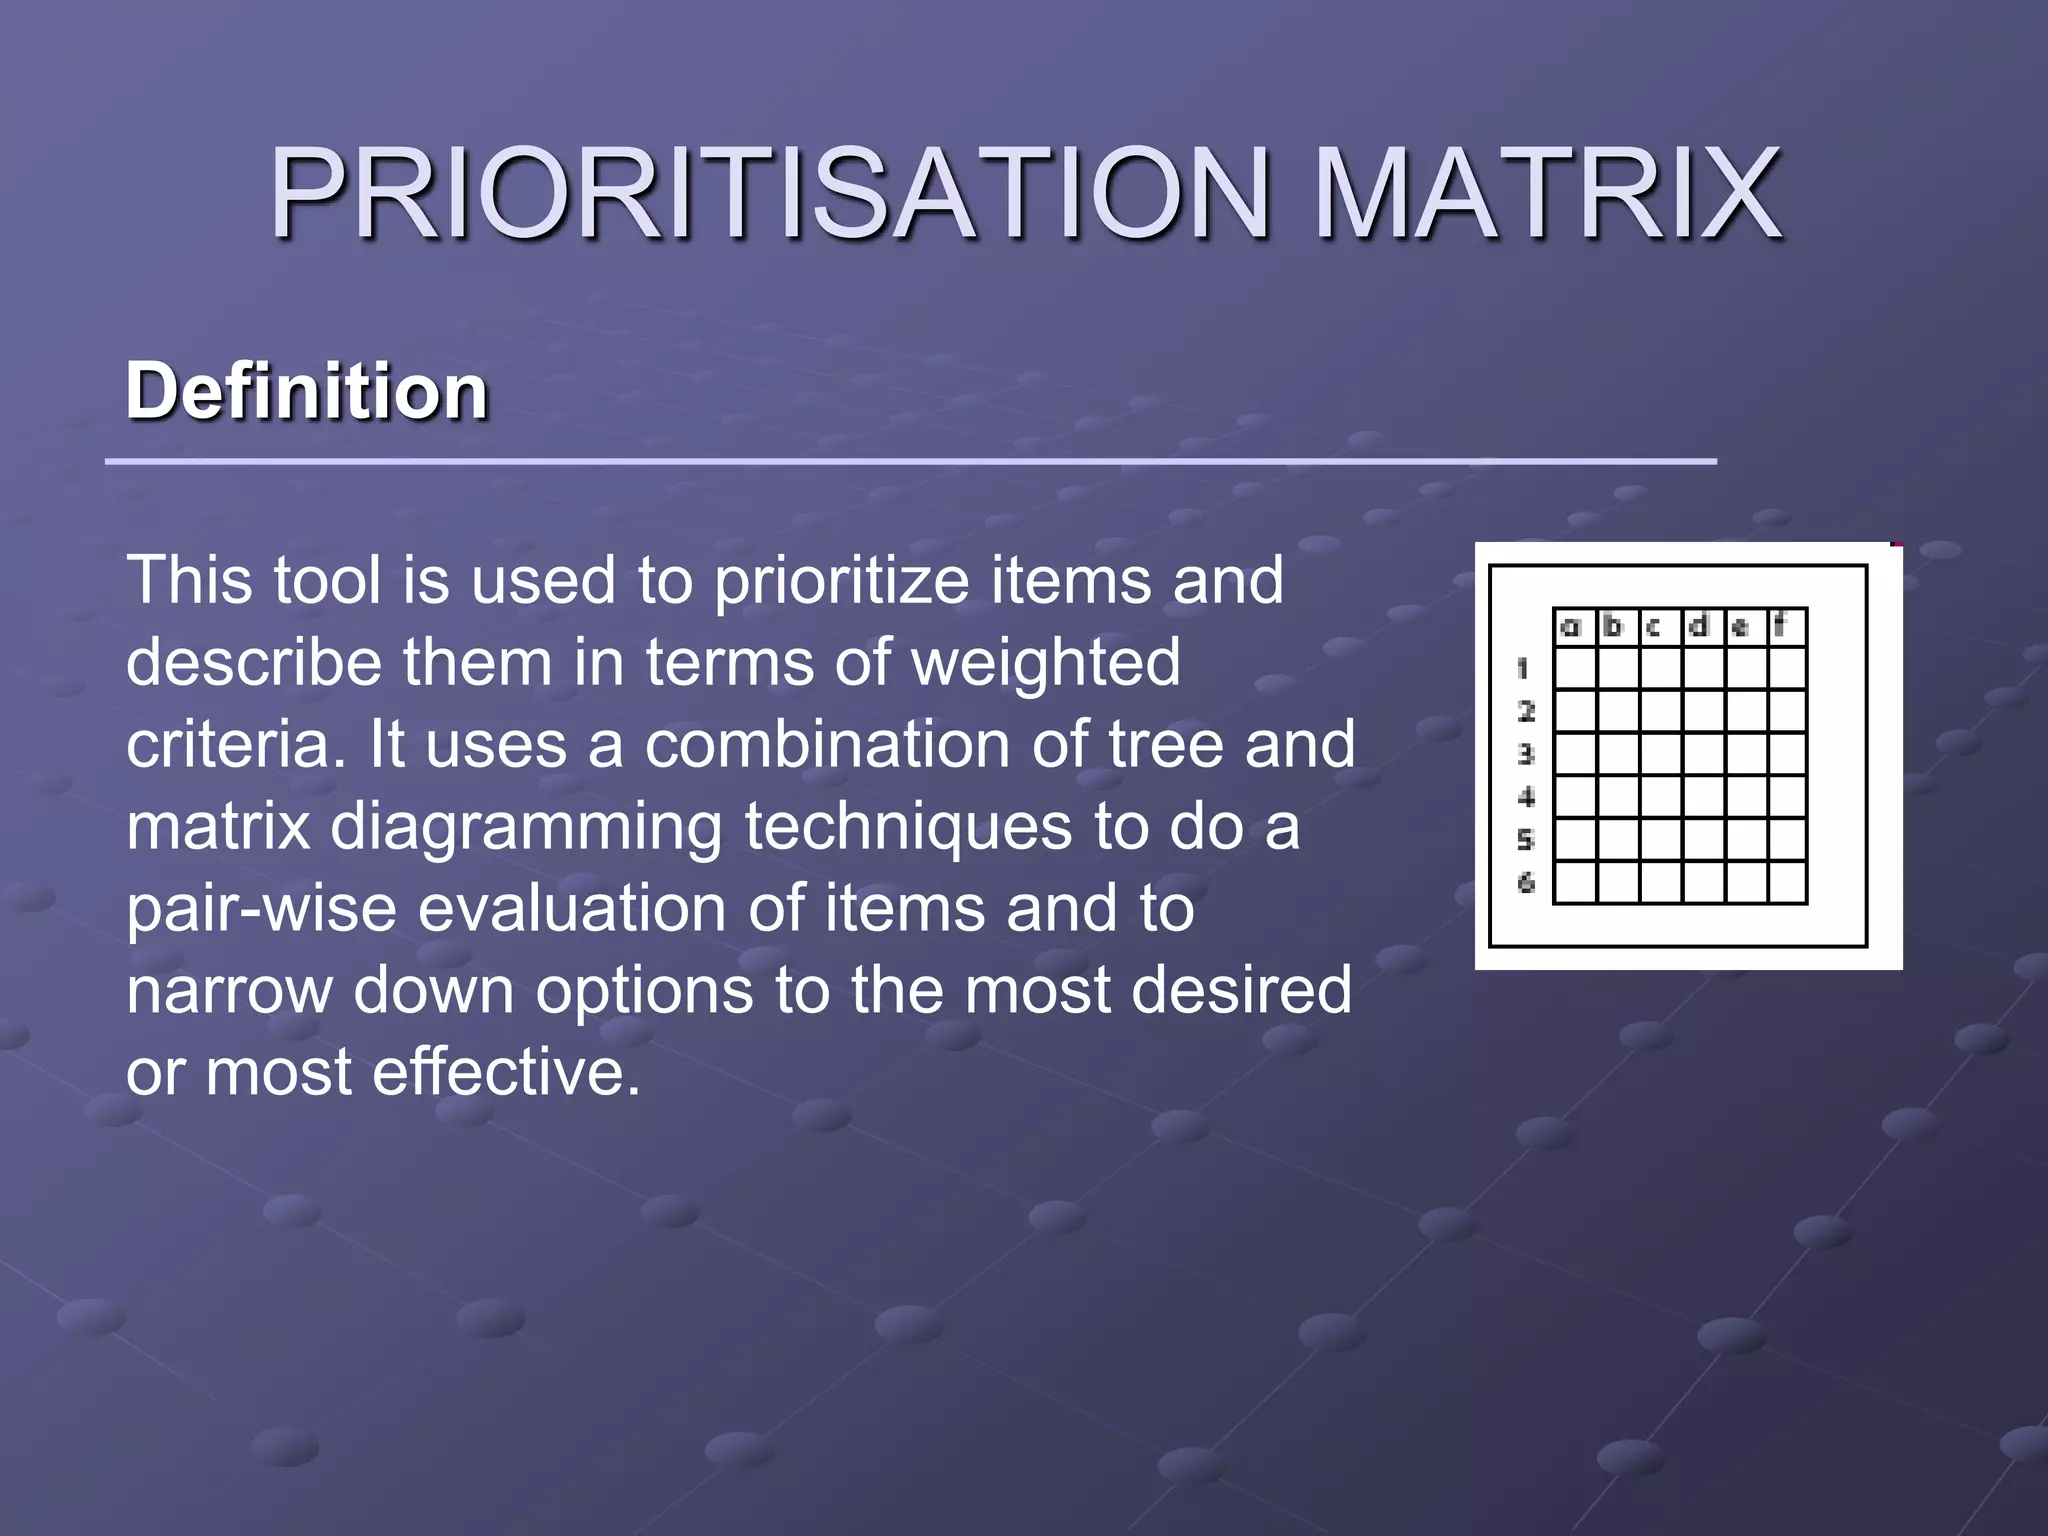
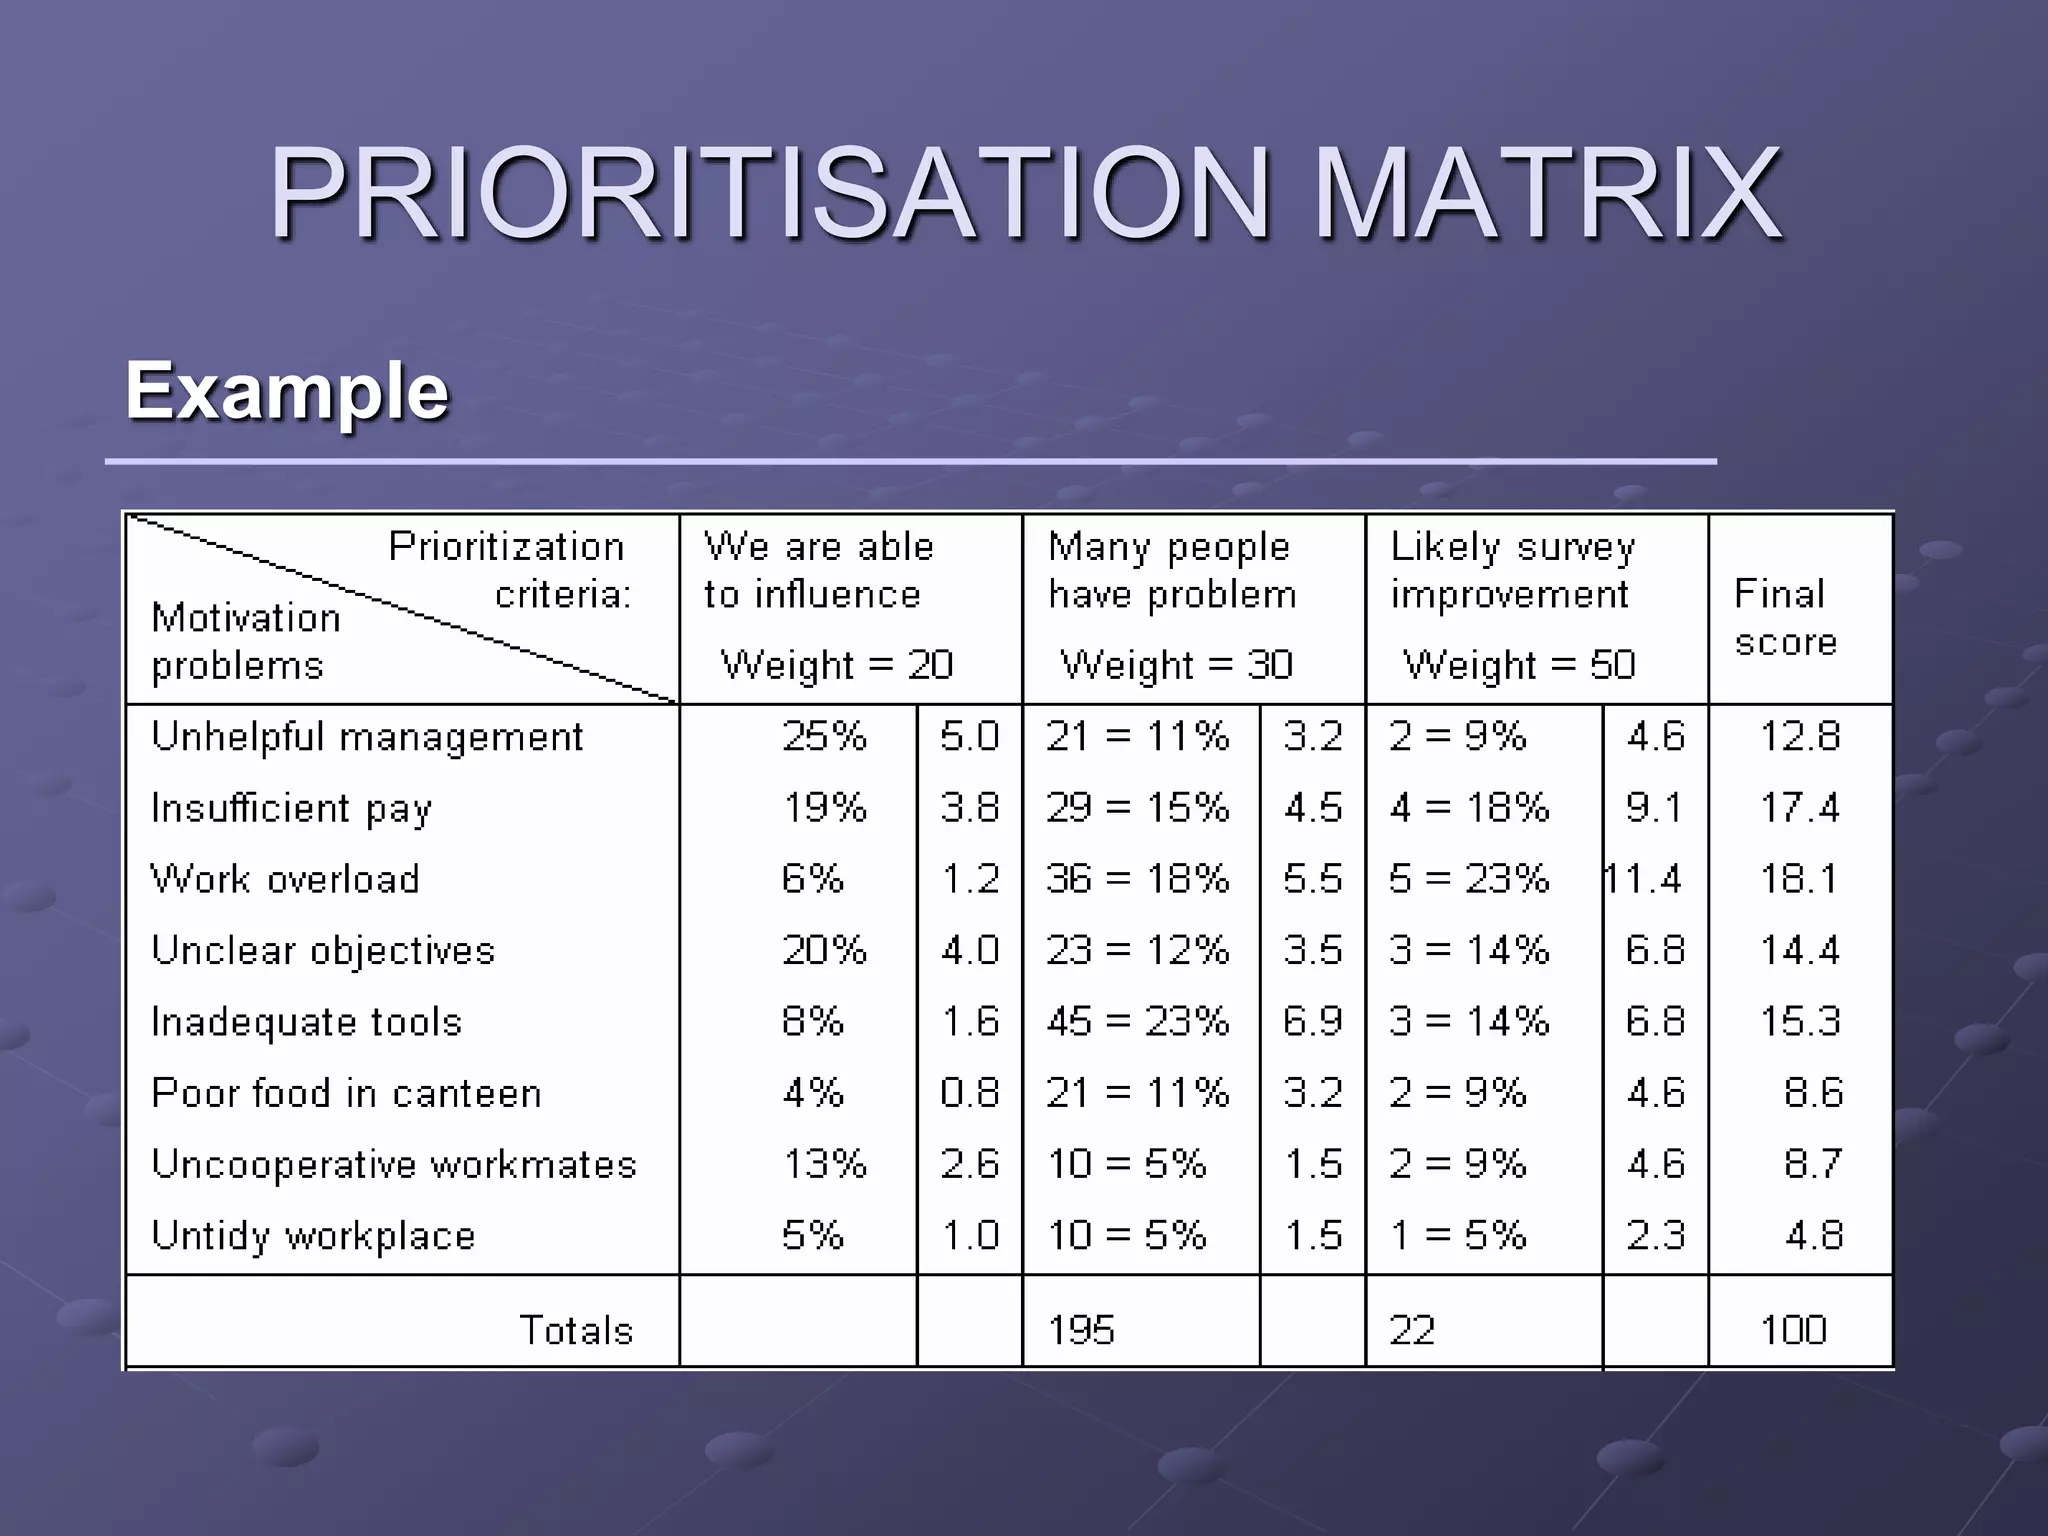
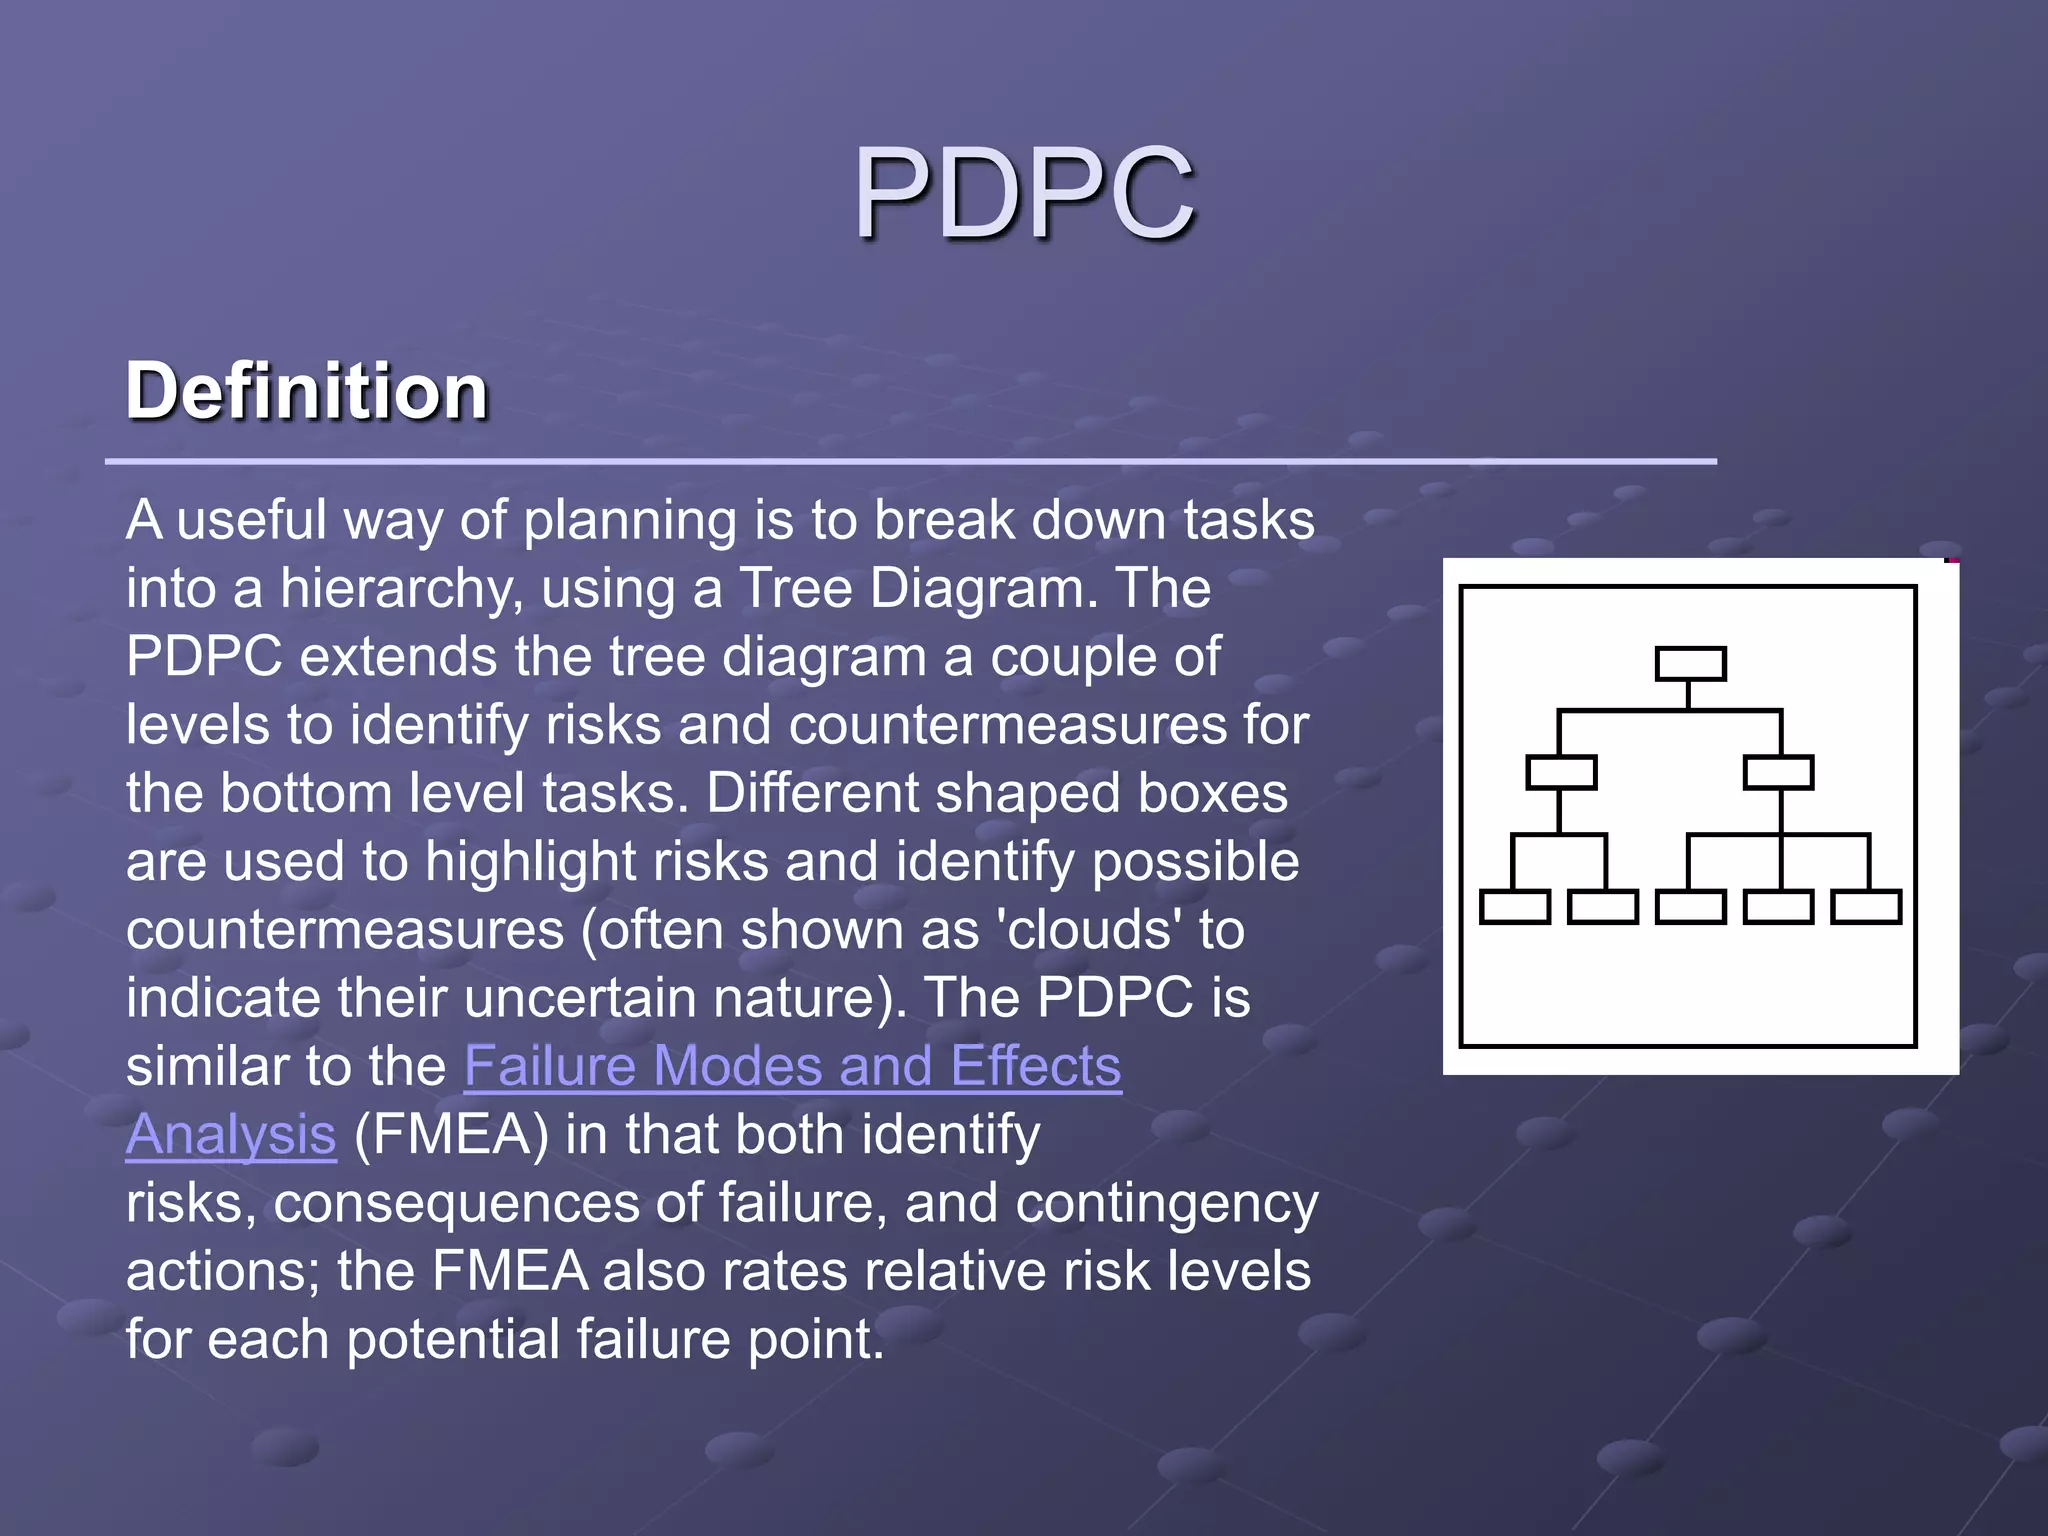
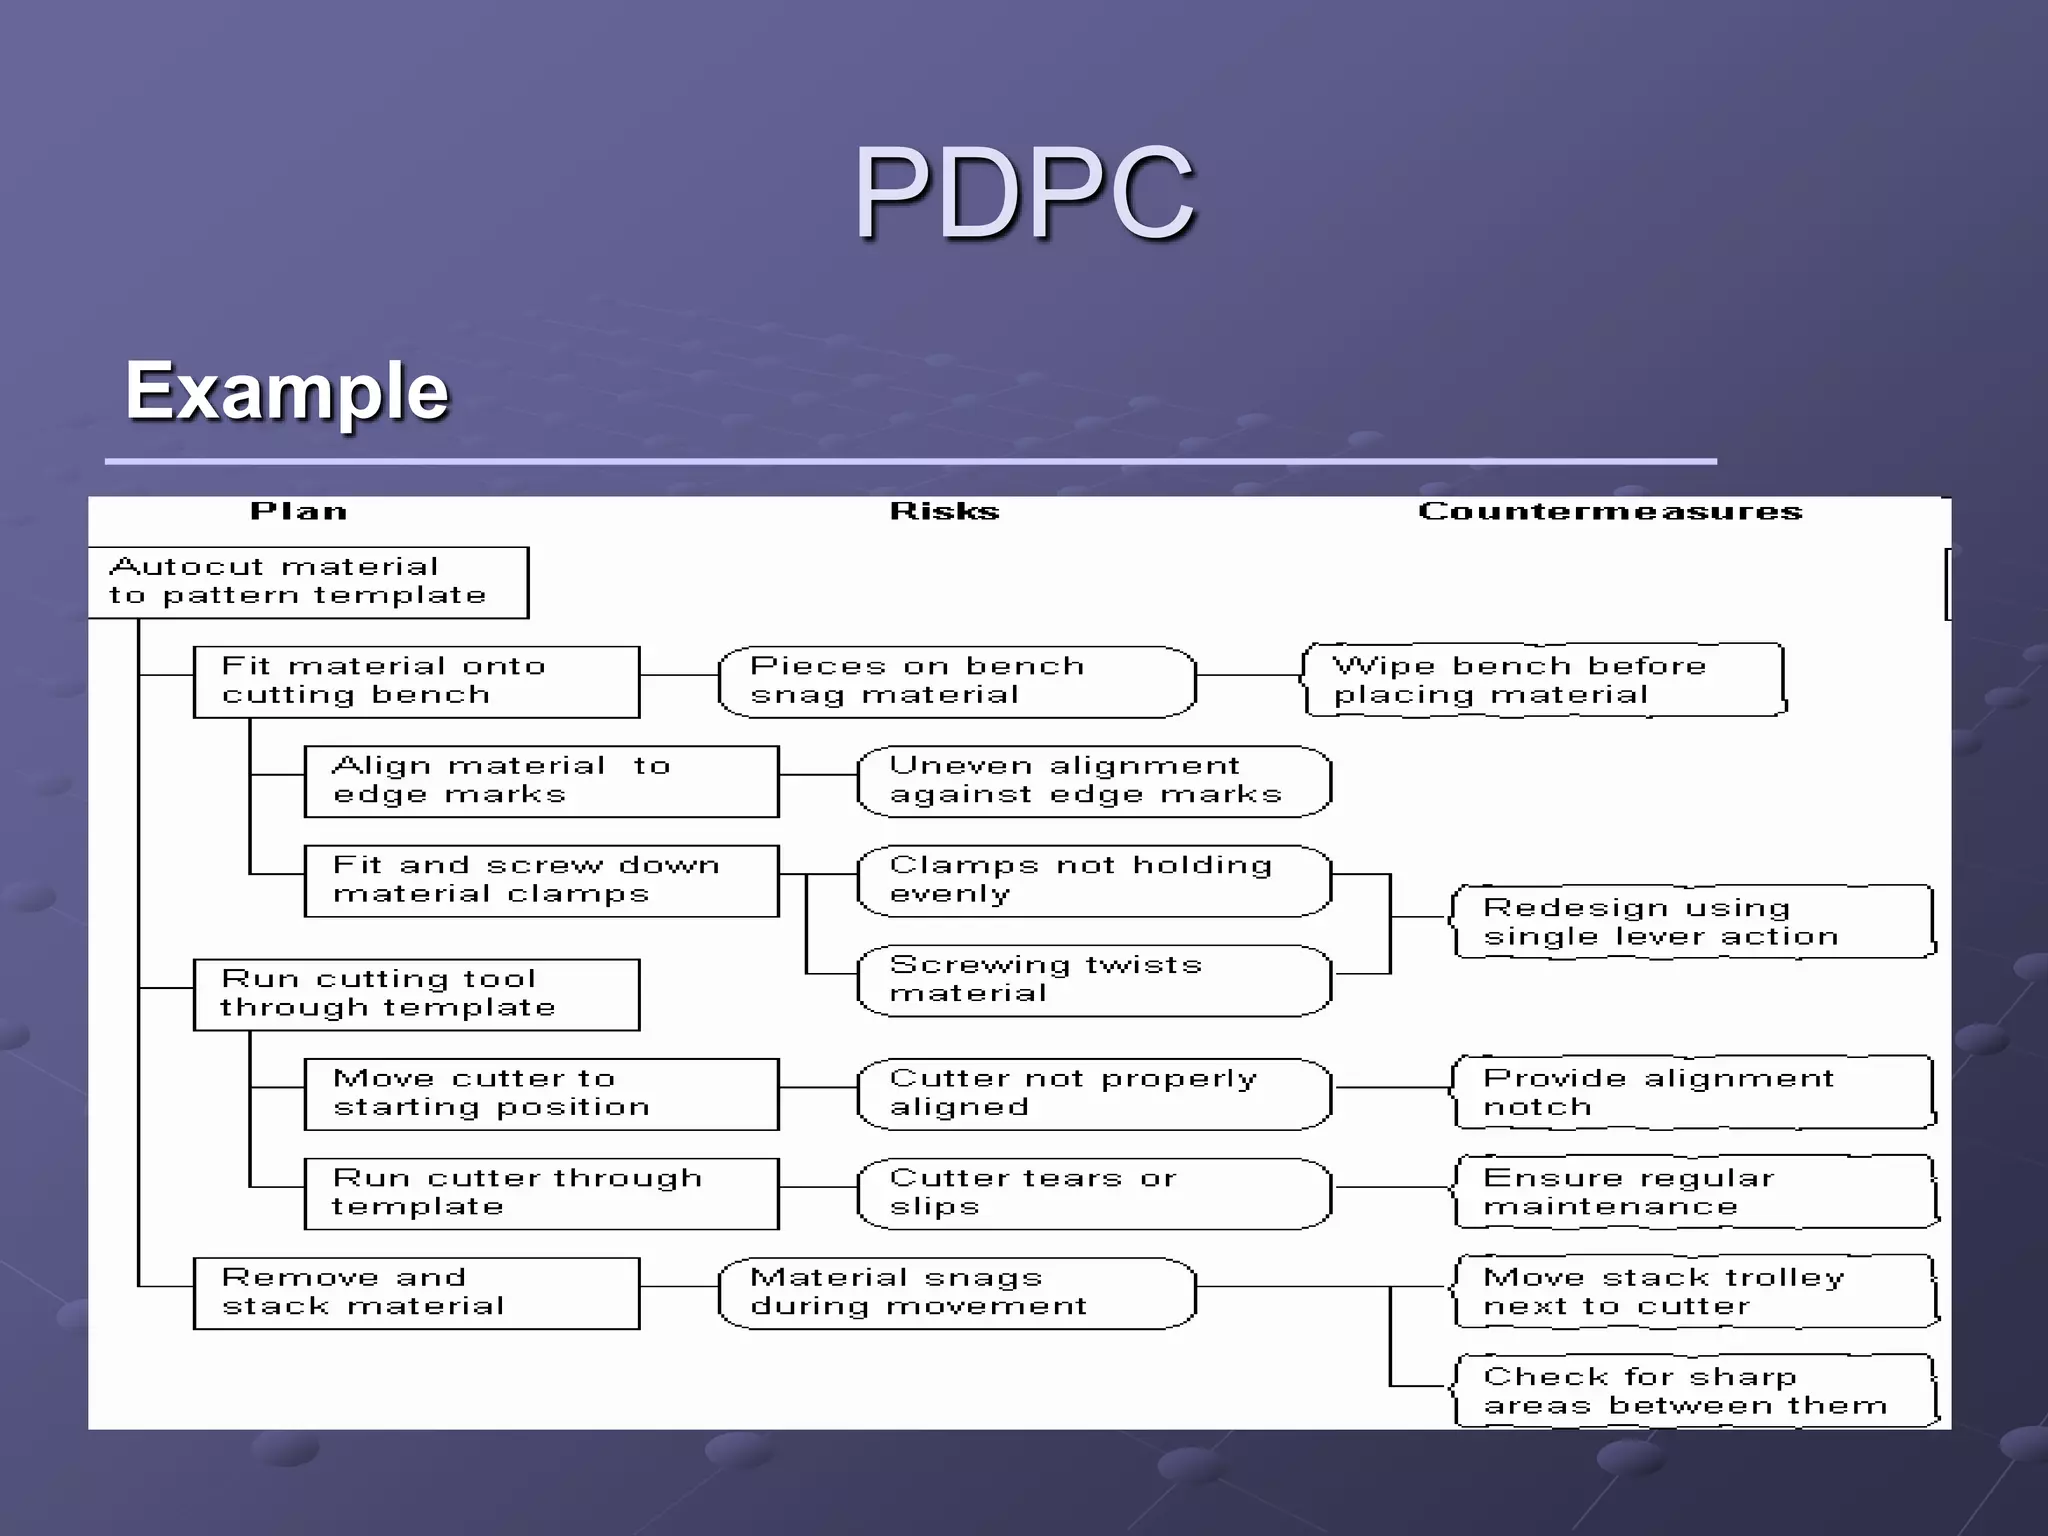
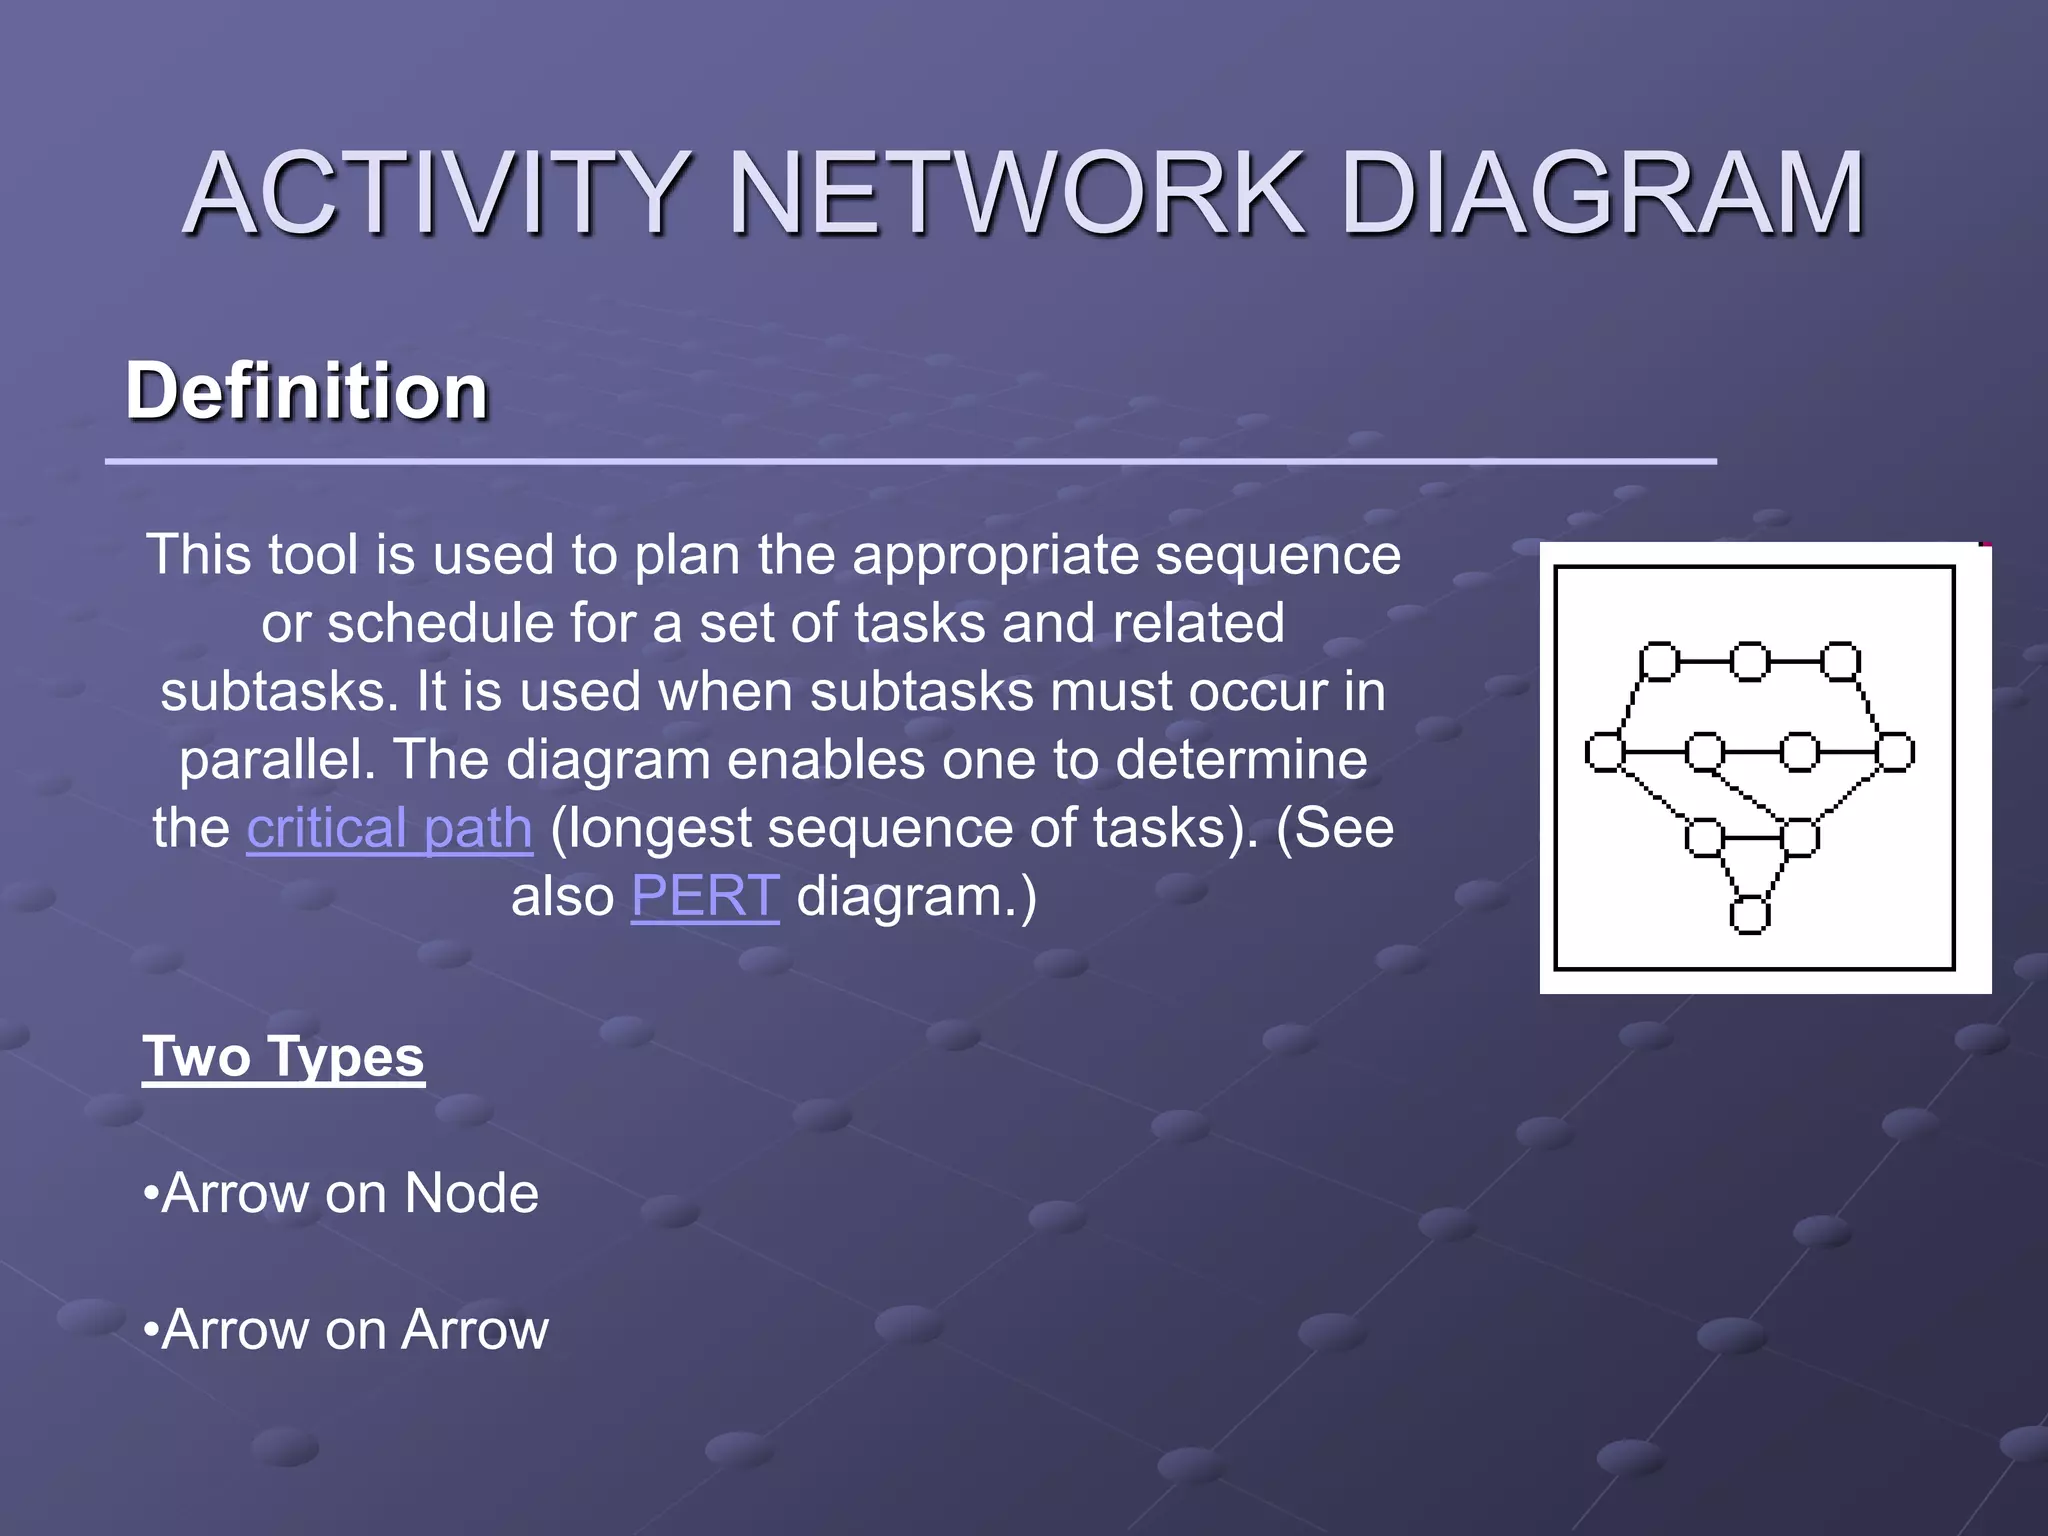


The document provides an overview of 7 management tools: Affinity Diagram, Interrelationship Diagraph, Tree Diagram, Matrix Diagrams, Prioritization Matrix, Process Decision Program Charts (PDPC), and Activity Network Diagrams. It defines each tool, explains how to use it through examples, and illustrates the tools with diagrams. The tools are designed to help structure thinking, simplify complex problems, improve analysis, and facilitate planning and decision making.