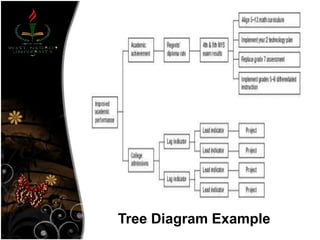
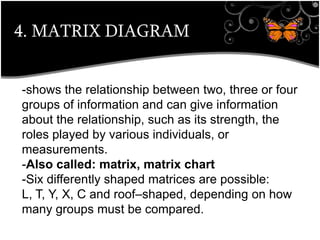
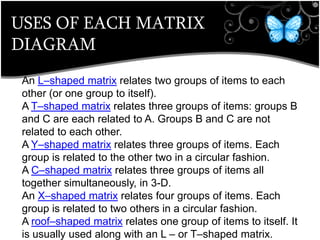
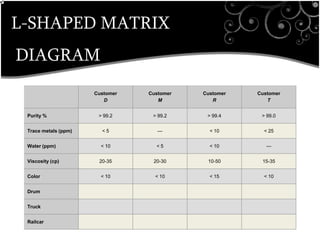
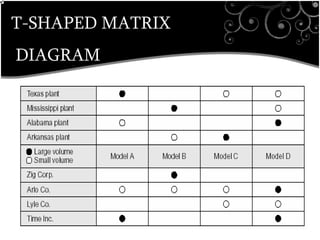
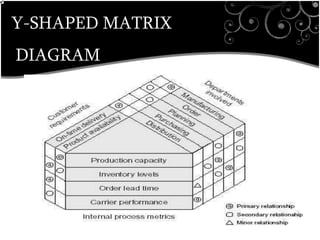
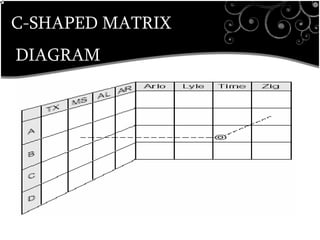
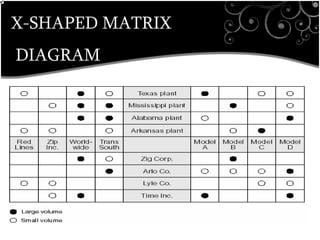
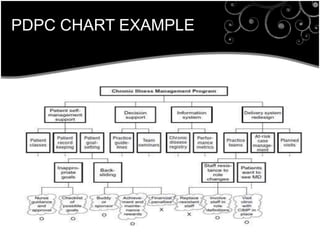
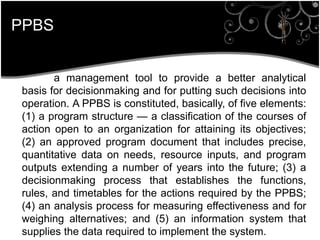
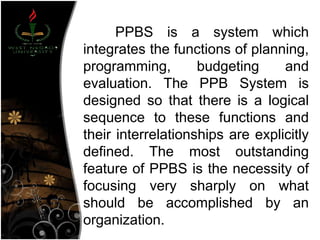
SEVEN NEW MANAGEMENT
TOOLS AND PLANNING
REPORTED BY: JOSE JOHN F. MENDEZ
PHED 556 EDUCATIONAL PLANNING
AND DECISION MAKING
In 1976, the union of
Japanese Scientist and
Engineers (JUSE) saw the
needs for tools to promote
innovation, communicate
information and sucessfully
plan the major projects.
1. Affinity Diagram
• Affinity means likeness based on
relationship or casual connection
(Merriam and Webster)
• Also called: affinity chart, K–J method
Variation: thematic analysis
• Organizes a large number of ideas into
their natural relationships.
USES:
• When you are confronted with many
facts or ideas in apparent chaos
• When issues seem too large and
complex to grasp
• When group consensus is necessary
Typical situations are:
• After a brainstorming exercise
• When analyzing verbal data, such as
survey results.
MATERIALS
• sticky notes or cards,
• marking pens,
• large work surface
(wall, table, or floor).
PROCEDURE
1. During a brainstorming
session, write directly onto
sticky notes or cards if you
suspect you will be following
the brainstorm with an affinity
diagram.
2. Look for ideas that seem to
be related in some way. Place
them side by side.
It is very important that no
one talk during this step.
3.You can talk now.
Participants can discuss the
shape of the chart, any
surprising patterns, and
especially reasons for moving
controversial notes.
4.Combine groups into
―supergroups‖ if appropriate.
Brainstorming for Affinity Diagram Example
Affinity Diagram Example
2. RELATIONS DIAGRAM
•shows cause-and-effect relationships and helps
you analyze the natural links between different
aspects of a complex situation.
•Also called: interrelationship diagram or
digraph, network diagram
•When trying to understand links
between ideas or cause–and–effect
relationships, such as when trying to
identify an area of greatest impact for
improvement.
•When a complex issue is being
analyzed for causes.
•When a complex solution is being
implemented.
•After generating an affinity diagram,
cause–and–effect diagram or tree
diagram, to more completely explore the
relations of ideas.
MATERIALS
• Sticky notes or cards,
•large paper surface (newsprint or
two flipchart pages taped
together),
•marking pens,
•tape.
PROCEDURES
1. Write a statement defining the issue that the relations
diagram will explore.
2. Brainstorm ideas about the issue and write them on cards or
notes.
3. Place one idea at a time on the work surface and ask: ―Is
this idea related to any others?‖ Place ideas that are related
near the first.
4. For each idea, ask, ―Does this idea cause or influence any
other idea?‖ Draw arrows from each idea
5. Analyze the diagram:
RELATIONSHIP DIAGRAM
EXAMPLE
3. TREE DIAGRAM
•breaks down broad categories into finer and finer levels of detail, helping you move your thinking step by step from generalities to specifics.
-breaks down broad categories into finer and finer
levels of detail, helping you move your thinking
step by step from generalities to specifics.
-Also called: systematic diagram, tree
analysis, analytical tree, hierarchy diagram
USES
•breaks down broad categories into finer and finer levels of detail, helping you move your thinking step by step from generalities to specifics.
-When an issue is known or being addressed in broad
generalities and you must move to specific details, such as
-when developing logical steps to achieve an objective.
When developing actions to carry out a solution or other
plan.
-When analyzing processes in detail.
-When probing for the root cause of a problem.
-When evaluating implementation issues for several
potential solutions.
-After an affinity diagram or relations diagram has
uncovered key issues.
-As a communication tool, to explain details to others.
PROCEDURE
1. Develop a statement of the
goal, project, plan, problem or whatever is
being studied. Write it at the top
2. Ask a question that will lead you to the next
level of detail.
3. Do a ―necessary and sufficient‖ check. Are
all the items at this level necessary for the
one on the level above?
4. Each of the new idea statements now
becomes the subject: a goal, objective or
problem statement.
5. Continue to turn each new idea into a
subject statement and ask the question.
Tree Diagram Example
4. MATRIX DIAGRAM
•breaks down broad categories into finer and finer levels of detail, helping you move your thinking step by step from generalities to specifics.
-shows the relationship between two, three or four
groups of information and can give information
about the relationship, such as its strength, the
roles played by various individuals, or
measurements.
-Also called: matrix, matrix chart
-Six differently shaped matrices are possible:
L, T, Y, X, C and roof–shaped, depending on how
many groups must be compared.
USES OF EACH MATRIX
DIAGRAM
•breaks down broad categories into finer and finer levels of detail, helping you move your thinking step by step from generalities to specifics.
An L–shaped matrix relates two groups of items to each
other (or one group to itself).
A T–shaped matrix relates three groups of items: groups B
and C are each related to A. Groups B and C are not
related to each other.
A Y–shaped matrix relates three groups of items. Each
group is related to the other two in a circular fashion.
A C–shaped matrix relates three groups of items all
together simultaneously, in 3-D.
An X–shaped matrix relates four groups of items. Each
group is related to two others in a circular fashion.
A roof–shaped matrix relates one group of items to itself. It
is usually used along with an L – or T–shaped matrix.
L-SHAPED MATRIX
DIAGRAM
•breaks down broad categories into finer and finer levels of detail, helping you move your thinking step by step from generalities to specifics.
Customer
D
Customer
M
Customer
R
Customer
T
Purity % > 99.2 > 99.2 > 99.4 > 99.0
Trace metals (ppm) < 5 — < 10 < 25
Water (ppm) < 10 < 5 < 10 —
Viscosity (cp) 20-35 20-30 10-50 15-35
Color < 10 < 10 < 15 < 10
Drum
Truck
Railcar
Customer Requirements
T-SHAPED MATRIX
DIAGRAM
•breaks down broad categories into finer and finer levels of detail, helping you move your thinking step by step from generalities to specifics.
Customer Requirements
Y-SHAPED MATRIX
DIAGRAM
•breaks down broad categories into finer and finer levels of detail, helping you move your thinking step by step from generalities to specifics.
Customer Requirements
C-SHAPED MATRIX
DIAGRAM
•breaks down broad categories into finer and finer levels of detail, helping you move your thinking step by step from generalities to specifics.
Customer Requirements
X-SHAPED MATRIX
DIAGRAM
•breaks down broad categories into finer and finer levels of detail, helping you move your thinking step by step from generalities to specifics.
Customer Requirements
ROOF-SHAPED MATRIX
DIAGRAM
•breaks down broad categories into finer and finer levels of detail, helping you move your thinking step by step from generalities to specifics.
Customer Requirements
5. MATRIX DATA ANALYSIS
•breaks down broad categories into finer and finer levels of detail, helping you move your thinking step by step from generalities to specifics.
Customer Requirements
a complex mathematical technique for
analyzing matrices, often replaced in this list by
the similar prioritization matrix. One of the most
rigorous, careful and time-consuming of decision-
making tools, a prioritization matrix is an L-
shaped matrix that uses pairwise comparisons of
a list of options to a set of criteria in order to
choose the best option(s).
6. ARROW DIAGRAM
•breaks down broad categories into finer and finer levels of detail, helping you move your thinking step by step from generalities to specifics.
Customer Requirements
-shows the required order of tasks in a project or process,
the best schedule for the entire project, and potential
scheduling and resource problems and their solutions.
-Also called: activity network diagram, network
diagram, activity chart, node diagram, CPM (critical
path method) chart
-The arrow diagram shows the required order of tasks in
a project or process, the best schedule for the entire
project, and potential scheduling and resource problems
and their solutions. The arrow diagram lets you calculate
the ―critical path‖ of the project.
USES
•breaks down broad categories into finer and finer levels of detail, helping you move your thinking step by step from generalities to specifics.
Customer Requirements
-When scheduling and monitoring tasks within a complex
project or process with interrelated tasks and resources.
-When you know the steps of the project or process, their
sequence and how long each step takes, and.
-When project schedule is critical, with serious
consequences for completing the project late or
significant advantage to completing the project early.
MATERIALS:
Sticky notes or cards,
marking pens,
large writing surface (newsprint or
flipchart pages)
PROCEDURE
1. List all the necessary tasks in the
project or process.
2. Determine the correct sequence of
the tasks. Do this by asking three
questions for each task.
3. Diagram the network of tasks.
4. Between each two tasks, draw circles
for ―events.‖
5. Look for three common problem
situations and redraw them using
―dummies‖ or extra events:
PDPC
Systematically identifies what might go
wrong in a plan under development.
Countermeasures are developed to prevent
or offset those problems. By using
PDPC, you can either revise the plan to avoid
the problems or be ready with the best
response when a problem occurs.
6. PROCESS DECISION PROGRAM
CHART (PDPC)
- Before implementing a
plan, especially when the plan is
large and complex.
- When the plan must be completed
on schedule.
- When the price of failure is high.
USES
PROCEDURE
1. Obtain or develop a tree diagram of
the proposed plan.
2. For each task on the third
level, brainstorm what could go
wrong.
3. Review all the potential problems and
eliminate any that are improbable or
whose consequences would be
insignificant.
4. For each potential problem, brainstorm
possible countermeasures.
5. Decide how practical each countermeasure
PDPC CHART EXAMPLE
PPBS
PLANNING
PROGRAMMING
BUDGETING SYSTEM
PPBS
a management tool to provide a better analytical
basis for decisionmaking and for putting such decisions into
operation. A PPBS is constituted, basically, of five elements:
(1) a program structure — a classification of the courses of
action open to an organization for attaining its objectives;
(2) an approved program document that includes precise,
quantitative data on needs, resource inputs, and program
outputs extending a number of years into the future; (3) a
decisionmaking process that establishes the functions,
rules, and timetables for the actions required by the PPBS;
(4) an analysis process for measuring effectiveness and for
weighing alternatives; and (5) an information system that
supplies the data required to implement the system.
PPBS is a system which
integrates the functions of planning,
programming, budgeting and
evaluation. The PPB System is
designed so that there is a logical
sequence to these functions and
their interrelationships are explicitly
defined. The most outstanding
feature of PPBS is the necessity of
focusing very sharply on what
should be accomplished by an
organization.
The PPBS is a formal,
systematic structure for making
decisions on policy, strategy, and
the development of forces and
capabilities to accomplish
anticipated missions. The PPBS is
a cyclic process containing three
distinct but interrelated phases
PPBS are about how
resources are going to be achieve
the various objectives of the
organization for example, the care
of the elderly, once the objectives
have been established programs
are identified to meet those
objectives and the cost/benefits of
alternative programs are assessed.
Planning, programming
and budgeting system (PPBS) is a
middle type of budget between the
traditional character and object
budget, on the one hand, and the
performance budget on the other.
The major contribution of PPBS lies
in the planning process, i.e- the
process of making program policy
decisions that lead to a specific
budget and specific multi-year
plans.
PPBS in practice are both
"time and labor" intensive but it
does link fiscal discussion directly
to the planning processes and
program implementations
processes of the institution.
Effective PPBS systems rely on
agreed upon goals and objectives
for the institution and the unit and
achievement of goals is directly
related to funding.
LINEAR
PROGRAMMING
BASIC ASSUMPTION
useful method for analyzing and solving
certain types of management decision
problems.
proven to be an adept tool for solving
problems encountered in a number of
business, engineering, financial, and
scientific applications. In a practical
sense, typically encountered constrained
optimization problems seldom have a simple
rule-of-thumb solution.
BASIC ASSUMPTION
handles such constraint inequalities
easily, making it a useful technique for finding
theoptimal solution to many management
decision problems.
linear programming can be applied only in
situations in which the relevant objective function
and constraint conditions are linear. Typical
managerial decision problems that can be solved
using the linear programming method involve
revenue and cost functions and their
composite, the profit function.
BASIC ASSUMPTION
REQUIRING LIMITED
RESOURCES TO PRODUCE A
NUMBER OF OUTPUT MIXES.
USES
Many practical problems in operations
research can be expressed as linear programming
problems. Certain special cases of linear
programming, such as network flow problems
and multicommodity flow problems are considered
important enough to have generated much
research on specialized algorithms for their
solution.
EXAMPLE
BREAK EVEN
ANALYSIS
CONCEPT
One of the common challenges in business
planning is that one often has a better handle on
predicting expenses than revenues. It doesn’t
mean you’re 100% sure about what your costs are
going to be, but for many folks, when they start
looking at sales, it’s a crap shoot. As a result,
many business plans tend to ―make up‖ revenue
numbers to show a profit, confident that they’ll
somehow get there.
CONCEPT
METHOD OF DETERMINING THE
RELATIONSHIP BETWEEN TOTAL COST
REVENUES AT VARIOUS LEVEL OF
PRODUCTION OR SALES ACTIVITY.
TELLS THE MANAGER THE POINT AT
WHICH IT IS PROFITABLE TO GO AHEAD
WITH A NEW VENTURE.
USES
all you need are two numbers: estimated annual
fixed costs (that one’s often pretty straightforward), and
something called unit contribution. Fixed costs reflect those
expenses that you’ll incur regardless of sales levels. It
normally includes things like salaries and
benefits, space, technology
costs, accounting/legal/marketing, and so on. Unit
contribution, on the other hand, represents how much of
each unit or dollar of sales you get to keep — after
subtracting all variable costs required to produce that
unit, typically accounted for as cost of goods sold.
USES
MANAGER USE THIS ANALYSIS
BECAUSE BEFORE ADDING NEW
PRODUCTS; EQUIPMENT OR
HUMAN RESOURCES THEY WANT
TO BE SURE THAT THE CHANGE
WILL PAY OFF.
EXAMPLE
FOR LISTENING

Mgt tools and planning prof. moyani

  • 1.
    SEVEN NEW MANAGEMENT TOOLSAND PLANNING REPORTED BY: JOSE JOHN F. MENDEZ PHED 556 EDUCATIONAL PLANNING AND DECISION MAKING
  • 2.
    In 1976, theunion of Japanese Scientist and Engineers (JUSE) saw the needs for tools to promote innovation, communicate information and sucessfully plan the major projects.
  • 4.
    1. Affinity Diagram •Affinity means likeness based on relationship or casual connection (Merriam and Webster) • Also called: affinity chart, K–J method Variation: thematic analysis • Organizes a large number of ideas into their natural relationships.
  • 5.
    USES: • When youare confronted with many facts or ideas in apparent chaos • When issues seem too large and complex to grasp • When group consensus is necessary Typical situations are: • After a brainstorming exercise • When analyzing verbal data, such as survey results.
  • 6.
    MATERIALS • sticky notesor cards, • marking pens, • large work surface (wall, table, or floor).
  • 7.
    PROCEDURE 1. During abrainstorming session, write directly onto sticky notes or cards if you suspect you will be following the brainstorm with an affinity diagram. 2. Look for ideas that seem to be related in some way. Place them side by side.
  • 8.
    It is veryimportant that no one talk during this step. 3.You can talk now. Participants can discuss the shape of the chart, any surprising patterns, and especially reasons for moving controversial notes. 4.Combine groups into ―supergroups‖ if appropriate.
  • 9.
  • 10.
  • 12.
    2. RELATIONS DIAGRAM •showscause-and-effect relationships and helps you analyze the natural links between different aspects of a complex situation. •Also called: interrelationship diagram or digraph, network diagram
  • 13.
    •When trying tounderstand links between ideas or cause–and–effect relationships, such as when trying to identify an area of greatest impact for improvement. •When a complex issue is being analyzed for causes. •When a complex solution is being implemented. •After generating an affinity diagram, cause–and–effect diagram or tree diagram, to more completely explore the relations of ideas.
  • 14.
    MATERIALS • Sticky notesor cards, •large paper surface (newsprint or two flipchart pages taped together), •marking pens, •tape.
  • 15.
    PROCEDURES 1. Write astatement defining the issue that the relations diagram will explore. 2. Brainstorm ideas about the issue and write them on cards or notes. 3. Place one idea at a time on the work surface and ask: ―Is this idea related to any others?‖ Place ideas that are related near the first. 4. For each idea, ask, ―Does this idea cause or influence any other idea?‖ Draw arrows from each idea 5. Analyze the diagram:
  • 16.
  • 18.
    3. TREE DIAGRAM •breaksdown broad categories into finer and finer levels of detail, helping you move your thinking step by step from generalities to specifics. -breaks down broad categories into finer and finer levels of detail, helping you move your thinking step by step from generalities to specifics. -Also called: systematic diagram, tree analysis, analytical tree, hierarchy diagram
  • 19.
    USES •breaks down broadcategories into finer and finer levels of detail, helping you move your thinking step by step from generalities to specifics. -When an issue is known or being addressed in broad generalities and you must move to specific details, such as -when developing logical steps to achieve an objective. When developing actions to carry out a solution or other plan. -When analyzing processes in detail. -When probing for the root cause of a problem. -When evaluating implementation issues for several potential solutions. -After an affinity diagram or relations diagram has uncovered key issues. -As a communication tool, to explain details to others.
  • 20.
    PROCEDURE 1. Develop astatement of the goal, project, plan, problem or whatever is being studied. Write it at the top 2. Ask a question that will lead you to the next level of detail. 3. Do a ―necessary and sufficient‖ check. Are all the items at this level necessary for the one on the level above? 4. Each of the new idea statements now becomes the subject: a goal, objective or problem statement. 5. Continue to turn each new idea into a subject statement and ask the question.
  • 21.
  • 22.
    4. MATRIX DIAGRAM •breaksdown broad categories into finer and finer levels of detail, helping you move your thinking step by step from generalities to specifics. -shows the relationship between two, three or four groups of information and can give information about the relationship, such as its strength, the roles played by various individuals, or measurements. -Also called: matrix, matrix chart -Six differently shaped matrices are possible: L, T, Y, X, C and roof–shaped, depending on how many groups must be compared.
  • 23.
    USES OF EACHMATRIX DIAGRAM •breaks down broad categories into finer and finer levels of detail, helping you move your thinking step by step from generalities to specifics. An L–shaped matrix relates two groups of items to each other (or one group to itself). A T–shaped matrix relates three groups of items: groups B and C are each related to A. Groups B and C are not related to each other. A Y–shaped matrix relates three groups of items. Each group is related to the other two in a circular fashion. A C–shaped matrix relates three groups of items all together simultaneously, in 3-D. An X–shaped matrix relates four groups of items. Each group is related to two others in a circular fashion. A roof–shaped matrix relates one group of items to itself. It is usually used along with an L – or T–shaped matrix.
  • 25.
    L-SHAPED MATRIX DIAGRAM •breaks downbroad categories into finer and finer levels of detail, helping you move your thinking step by step from generalities to specifics. Customer D Customer M Customer R Customer T Purity % > 99.2 > 99.2 > 99.4 > 99.0 Trace metals (ppm) < 5 — < 10 < 25 Water (ppm) < 10 < 5 < 10 — Viscosity (cp) 20-35 20-30 10-50 15-35 Color < 10 < 10 < 15 < 10 Drum Truck Railcar Customer Requirements
  • 27.
    T-SHAPED MATRIX DIAGRAM •breaks downbroad categories into finer and finer levels of detail, helping you move your thinking step by step from generalities to specifics. Customer Requirements
  • 29.
    Y-SHAPED MATRIX DIAGRAM •breaks downbroad categories into finer and finer levels of detail, helping you move your thinking step by step from generalities to specifics. Customer Requirements
  • 31.
    C-SHAPED MATRIX DIAGRAM •breaks downbroad categories into finer and finer levels of detail, helping you move your thinking step by step from generalities to specifics. Customer Requirements
  • 33.
    X-SHAPED MATRIX DIAGRAM •breaks downbroad categories into finer and finer levels of detail, helping you move your thinking step by step from generalities to specifics. Customer Requirements
  • 35.
    ROOF-SHAPED MATRIX DIAGRAM •breaks downbroad categories into finer and finer levels of detail, helping you move your thinking step by step from generalities to specifics. Customer Requirements
  • 36.
    5. MATRIX DATAANALYSIS •breaks down broad categories into finer and finer levels of detail, helping you move your thinking step by step from generalities to specifics. Customer Requirements a complex mathematical technique for analyzing matrices, often replaced in this list by the similar prioritization matrix. One of the most rigorous, careful and time-consuming of decision- making tools, a prioritization matrix is an L- shaped matrix that uses pairwise comparisons of a list of options to a set of criteria in order to choose the best option(s).
  • 38.
    6. ARROW DIAGRAM •breaksdown broad categories into finer and finer levels of detail, helping you move your thinking step by step from generalities to specifics. Customer Requirements -shows the required order of tasks in a project or process, the best schedule for the entire project, and potential scheduling and resource problems and their solutions. -Also called: activity network diagram, network diagram, activity chart, node diagram, CPM (critical path method) chart -The arrow diagram shows the required order of tasks in a project or process, the best schedule for the entire project, and potential scheduling and resource problems and their solutions. The arrow diagram lets you calculate the ―critical path‖ of the project.
  • 39.
    USES •breaks down broadcategories into finer and finer levels of detail, helping you move your thinking step by step from generalities to specifics. Customer Requirements -When scheduling and monitoring tasks within a complex project or process with interrelated tasks and resources. -When you know the steps of the project or process, their sequence and how long each step takes, and. -When project schedule is critical, with serious consequences for completing the project late or significant advantage to completing the project early.
  • 40.
    MATERIALS: Sticky notes orcards, marking pens, large writing surface (newsprint or flipchart pages)
  • 41.
    PROCEDURE 1. List allthe necessary tasks in the project or process. 2. Determine the correct sequence of the tasks. Do this by asking three questions for each task. 3. Diagram the network of tasks. 4. Between each two tasks, draw circles for ―events.‖ 5. Look for three common problem situations and redraw them using ―dummies‖ or extra events:
  • 43.
  • 44.
    Systematically identifies whatmight go wrong in a plan under development. Countermeasures are developed to prevent or offset those problems. By using PDPC, you can either revise the plan to avoid the problems or be ready with the best response when a problem occurs. 6. PROCESS DECISION PROGRAM CHART (PDPC)
  • 45.
    - Before implementinga plan, especially when the plan is large and complex. - When the plan must be completed on schedule. - When the price of failure is high. USES
  • 46.
    PROCEDURE 1. Obtain ordevelop a tree diagram of the proposed plan. 2. For each task on the third level, brainstorm what could go wrong. 3. Review all the potential problems and eliminate any that are improbable or whose consequences would be insignificant. 4. For each potential problem, brainstorm possible countermeasures. 5. Decide how practical each countermeasure
  • 47.
  • 48.
  • 49.
    PPBS a management toolto provide a better analytical basis for decisionmaking and for putting such decisions into operation. A PPBS is constituted, basically, of five elements: (1) a program structure — a classification of the courses of action open to an organization for attaining its objectives; (2) an approved program document that includes precise, quantitative data on needs, resource inputs, and program outputs extending a number of years into the future; (3) a decisionmaking process that establishes the functions, rules, and timetables for the actions required by the PPBS; (4) an analysis process for measuring effectiveness and for weighing alternatives; and (5) an information system that supplies the data required to implement the system.
  • 50.
    PPBS is asystem which integrates the functions of planning, programming, budgeting and evaluation. The PPB System is designed so that there is a logical sequence to these functions and their interrelationships are explicitly defined. The most outstanding feature of PPBS is the necessity of focusing very sharply on what should be accomplished by an organization.
  • 51.
    The PPBS isa formal, systematic structure for making decisions on policy, strategy, and the development of forces and capabilities to accomplish anticipated missions. The PPBS is a cyclic process containing three distinct but interrelated phases
  • 52.
    PPBS are abouthow resources are going to be achieve the various objectives of the organization for example, the care of the elderly, once the objectives have been established programs are identified to meet those objectives and the cost/benefits of alternative programs are assessed.
  • 53.
    Planning, programming and budgetingsystem (PPBS) is a middle type of budget between the traditional character and object budget, on the one hand, and the performance budget on the other. The major contribution of PPBS lies in the planning process, i.e- the process of making program policy decisions that lead to a specific budget and specific multi-year plans.
  • 54.
    PPBS in practiceare both "time and labor" intensive but it does link fiscal discussion directly to the planning processes and program implementations processes of the institution. Effective PPBS systems rely on agreed upon goals and objectives for the institution and the unit and achievement of goals is directly related to funding.
  • 55.
  • 56.
    BASIC ASSUMPTION useful methodfor analyzing and solving certain types of management decision problems. proven to be an adept tool for solving problems encountered in a number of business, engineering, financial, and scientific applications. In a practical sense, typically encountered constrained optimization problems seldom have a simple rule-of-thumb solution.
  • 57.
    BASIC ASSUMPTION handles suchconstraint inequalities easily, making it a useful technique for finding theoptimal solution to many management decision problems. linear programming can be applied only in situations in which the relevant objective function and constraint conditions are linear. Typical managerial decision problems that can be solved using the linear programming method involve revenue and cost functions and their composite, the profit function.
  • 58.
    BASIC ASSUMPTION REQUIRING LIMITED RESOURCESTO PRODUCE A NUMBER OF OUTPUT MIXES.
  • 59.
    USES Many practical problemsin operations research can be expressed as linear programming problems. Certain special cases of linear programming, such as network flow problems and multicommodity flow problems are considered important enough to have generated much research on specialized algorithms for their solution.
  • 60.
  • 61.
  • 62.
    CONCEPT One of thecommon challenges in business planning is that one often has a better handle on predicting expenses than revenues. It doesn’t mean you’re 100% sure about what your costs are going to be, but for many folks, when they start looking at sales, it’s a crap shoot. As a result, many business plans tend to ―make up‖ revenue numbers to show a profit, confident that they’ll somehow get there.
  • 63.
    CONCEPT METHOD OF DETERMININGTHE RELATIONSHIP BETWEEN TOTAL COST REVENUES AT VARIOUS LEVEL OF PRODUCTION OR SALES ACTIVITY. TELLS THE MANAGER THE POINT AT WHICH IT IS PROFITABLE TO GO AHEAD WITH A NEW VENTURE.
  • 64.
    USES all you needare two numbers: estimated annual fixed costs (that one’s often pretty straightforward), and something called unit contribution. Fixed costs reflect those expenses that you’ll incur regardless of sales levels. It normally includes things like salaries and benefits, space, technology costs, accounting/legal/marketing, and so on. Unit contribution, on the other hand, represents how much of each unit or dollar of sales you get to keep — after subtracting all variable costs required to produce that unit, typically accounted for as cost of goods sold.
  • 65.
    USES MANAGER USE THISANALYSIS BECAUSE BEFORE ADDING NEW PRODUCTS; EQUIPMENT OR HUMAN RESOURCES THEY WANT TO BE SURE THAT THE CHANGE WILL PAY OFF.
  • 66.
  • 67.