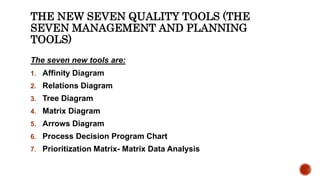
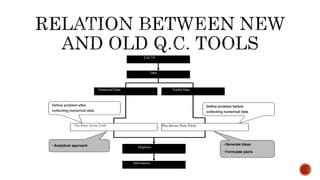
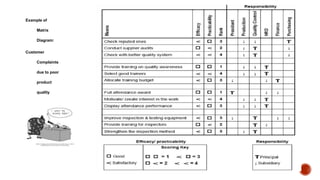
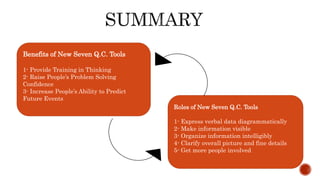
SlideShare a Scribd company logo
1 of 28
Presented by: Dennees Varughees K
Roll.no: 32425
Faculty Incharge: Mr. Susairaj
WHAT ARE THE NEW
SEVEN QUALITY TOOLS
In 1976, the Union of Japanese Scientists and Engineers
(JUSE) saw the need for tools to promote innovation,
communicate information and successfully plan major
projects.
A team researched and developed the seven new quality
control tools, to be used with the 7 basic quality tools.
Often called the seven management and planning (MP) tools,
or simply the seven management tools.
THE NEW SEVEN QUALITY TOOLS (THE
SEVEN MANAGEMENT AND PLANNING
TOOLS)
The seven new tools are:
1. Affinity Diagram
2. Relations Diagram
3. Tree Diagram
4. Matrix Diagram
5. Arrows Diagram
6. Process Decision Program Chart
7. Prioritization Matrix- Matrix Data Analysis
Developed to organize verbal data diagrammatically
Basic 7 tools effective for data analysis, process
control and quality improvement (numerical data)
Used together Increases Total quality management
effectiveness
FACTS
Data
Numerical Data Verbal Data
Organize
The Seven New Tools
Information
The Basic Seven Tools
• Generate Ideas
• Formulate plans
• Analytical approach
Define problem after
collecting numerical data
Define problem before
collecting numerical data
BENEFITS OF
INCORPORATING NEW SEVEN
Q.C. TOOLS
Five Objectives of Organizational Reform which will
establish a Culture that:
Identifies problems
Gives importance to planning
Stresses the importance of the process
Prioritizes tasks
Encourages everyone to think systematically
 Gathers large amounts of verbal data (ideas, opinions, issues); then
Organizes the data into groups based on natural relationship
 Makes it feasible for further analysis and to find a solution to the
problem.
Why use the Affinity Diagram?
To allow a team to creatively generate a large number of ideas/issues
and then organize and summarize natural groupings among them to
understand the essence of a problem and propose solutions.
 Select the topic to be analyzed
 Use brainstorming to collect verbal data and ideas
 Write each item on separate data card
 Spread out all cards on table or stick them on a board
 Move data cards into groups of similar themes (natural affinity for each other)
 Combine statements on data cards to new Affinity statement
 Make new card with Affinity statement
 Continue to combine until less than 5 groups
 Draw the final Affinity Diagram for the problem discussed
Verbal data generated
by brainstorming and
written on cards
Organized cards
through natural
relations =
Affinity
diagram
For Finding Solutions Strategies by Clarifying Relationships with
Complex Interrelated Causes.To allow a team to systematically identify,
analyze, and classify the cause and effect relationships that exist among
all critical issues.
 Useful at planning stage for obtaining perspective on overall situation.
 Facilitates consensus among team
 Assists to develop and change people’s thinking
 Enables priorities to be identified accurately
 Express the problem in form of “Why isn’t something happening?”
 Each member lists 5 causes affecting problem
 Discuss info collected until everyone understands it thoroughly
 Write each item on a card
 Move cards into similar groups
 Asking why, explore the cause-effect relationships, and divide the cards into
primary, secondary and tertiary causes
 Connect all cards by these relationships
 Further discuss until all possible causes have been identified
 Review whole diagram looking for relationships among causes
 Connect all related groups
 Next, complete the diagram
Makes the problem recognizable by clarifying the relationships among causes
Why does
X happen?
Primary Cause
Primary Cause
Primary Cause
Primary Cause
Tertiary
Cause
Secondary
Cause
Secondary
Cause
Secondary
Cause
Secondary
Cause
Tertiary
Cause
th level4
Cause
Tertiary
Cause
Tertiary
Cause
th level4
Cause
5 th level
Cause
th level6
Cause
Tertiary
Cause
Secondary
Cause
For Systematically Pursuing the Best Strategies for Attaining an
Objective
 Develops a succession of strategies for achieving objectives
 Reveals methods to achieve the results.
 Also known as Systematic diagrams or Dendrograms
Advantages of Tree Diagram
 Systematic and logical approach is less likely that items are omitted
 Facilitates agreement among team
 Are extremely convincing with strategies
 Write Relations Diagram topic (Objective card)
 Identify constraints on how objective can be achieved
 Take each primary mean, write objective for achieving it (secondary
means)
 Continue to expand to the fourth level
 Review each system of means in both directions (from objective to
means and means to objective)
 Add more cards if needed
 Connect all levels
 Next, complete the diagram
:Example of Customer complaints due to poor quality
 Consists of a two-dimensional array to determine location and nature of
problem
 Discovers key ideas by relationships represented by the cells in matrix.
 Enable data on ideas based on extensive experience
 Clarifies relationships among different elements
 Makes overall structure of problem immediately obvious
 Combined from two to four types of diagrams, location of problem is
clearer.
 Write final-level means from Tree diagram forming vertical axis
 Write in Evaluation categories (efficacy, practicability, and rank) on horizontal axis.
 Write names along horizontal axis
 Examine final-level means to identify whom will implement them
 Label group of columns as “Responsibilities”
 Label right-hand end of horizontal axis as “Remarks”
 Examine each cell and insert the appropriate symbol:
 O=good, =satisfactory, X=none
 Determine score for each combination of symbols, record in rank column.
 Examine cells under Responsibility Columns, insert double-circle for Principal and single-circle
for Subsidiary
 Fill out remarks column and record meanings of symbol
 Next, complete the diagram
Example of
Matrix
Diagram:
Customer
Complaints
due to poor
product
quality
For Working Out Optimal Schedules and Controlling Them
Effectively
 Shows relationships among tasks needed to implement a plan
 Network technique using nodes for events and arrows for activities
 Allows overall task to viewed and potential snags to be identified
before work starts
 Leads to discovery of possible improvements
 Makes it easy to monitor progress of work
 Deals promptly with changes to plan
 Improves communication among team
 From strategies on Tree diagram, select one (Objective of Arrow Diagram)
 Identify constraints to Objective
 Write all essential activities on separate cards
 List all activities necessary to achieving Objective
 Organize cards in sequential order of activities
 Remove any duplicate activities
 Review order of activities, find sequence with greatest amount of activities
 Arrange parallel activities
 Record names and other necessary information
 Next, complete the diagram
 Examine path, number nodes in sequence from left to right
Arrow Diagram:
Example of building a room.
 PDPCs are used for planning the activities needed to solve problem
when information is incomplete or the situation is fluid and hard to
forecast.
 Examples include planning an R & D project, mapping out
countermeasure against long-term chronic problems, and planning a
sales campaign.
 A PDPC consists of a series of steps linked in sequence. Its goal is to
depict the events and contingencies likely to occur when progressing
from a starting point to one or more final outcomes
Process Decisions Program
Chart
 Technique quantifies and arranges data presented in Matrix
 Based solely on numerical data.
 Finds indicators that differentiate and attempt to clarify large amount of
information.
Prioritization Matrix is used by teams to
narrow down options through a systematic
approach of comparing choices by
selecting, weighting, and applying criteria.
 Determine your goal, your alternatives, and criteria for decision
 Place selection in order of importance
 Sum individual ratings to establish overall ranking (Divide by number of options for
average ranking)
 Apply percentage weight to each option
 Rank order each option with respect to criterion (Average the rankings and apply a
completed ranking)
 Multiply weight by associated rank in Matrix (in example, 4 is best, 1 is worst)
 Result is Importance Score
 Add up Importance Scores for each option
 Rank order the alternatives according to importance
Prioritization Matrix –Example from manufacturing
Source: Foster, S., Managing Quality (Upper Saddle River, NJ: Prentice Hall, 2001)
Benefits of New Seven Q.C. Tools
1- Provide Training in Thinking
2- Raise People’s Problem Solving
Confidence
3- Increase People’s Ability to Predict
Future Events
Roles of New Seven Q.C. Tools
1- Express verbal data diagrammatically
2- Make information visible
3- Organize information intelligibly
4- Clarify overall picture and fine details
5- Get more people involved
7 new QC TOOLS

More Related Content

What's hot

Basic quality tools and others
Basic quality tools and othersBasic quality tools and others
Basic quality tools and others
Lynja C. Refugio
 

What's hot (20)

WEBINAR: Introduction to DMAIC
WEBINAR: Introduction to DMAICWEBINAR: Introduction to DMAIC
WEBINAR: Introduction to DMAIC
 
7 qc tools
7 qc tools7 qc tools
7 qc tools
 
Six sigma
Six sigmaSix sigma
Six sigma
 
7 QC Tools training presentation
7 QC Tools training presentation7 QC Tools training presentation
7 QC Tools training presentation
 
Attribute MSA
Attribute MSAAttribute MSA
Attribute MSA
 
Basic quality tools and others
Basic quality tools and othersBasic quality tools and others
Basic quality tools and others
 
7 QC TOOLS PRESENTATION PPT
 7 QC TOOLS PRESENTATION PPT 7 QC TOOLS PRESENTATION PPT
7 QC TOOLS PRESENTATION PPT
 
Lean six sigma - Waste elimination (Yellow Belt)
Lean six sigma - Waste elimination (Yellow Belt)Lean six sigma - Waste elimination (Yellow Belt)
Lean six sigma - Waste elimination (Yellow Belt)
 
TQM - 7 NEW TOOLS - FINAL YEAR ECE - SRI SAIRAM INSTITUTE OF TECHNOLOGY, CHEN...
TQM - 7 NEW TOOLS - FINAL YEAR ECE - SRI SAIRAM INSTITUTE OF TECHNOLOGY, CHEN...TQM - 7 NEW TOOLS - FINAL YEAR ECE - SRI SAIRAM INSTITUTE OF TECHNOLOGY, CHEN...
TQM - 7 NEW TOOLS - FINAL YEAR ECE - SRI SAIRAM INSTITUTE OF TECHNOLOGY, CHEN...
 
7 qc tools
7 qc tools7 qc tools
7 qc tools
 
Basics Six Sigma Fresher Guide
Basics Six Sigma Fresher GuideBasics Six Sigma Fresher Guide
Basics Six Sigma Fresher Guide
 
7 tools of quality
7 tools of quality7 tools of quality
7 tools of quality
 
Qc story
Qc storyQc story
Qc story
 
Introduction to Lean Six Sigma
Introduction to Lean Six SigmaIntroduction to Lean Six Sigma
Introduction to Lean Six Sigma
 
Lean six sigma Yellow Belt Complete training
Lean six sigma Yellow Belt Complete trainingLean six sigma Yellow Belt Complete training
Lean six sigma Yellow Belt Complete training
 
8 D – Problem Solving Process
8 D – Problem Solving Process8 D – Problem Solving Process
8 D – Problem Solving Process
 
Lean Tools
Lean ToolsLean Tools
Lean Tools
 
Tqm new tools
Tqm new toolsTqm new tools
Tqm new tools
 
Six sigma ppt
Six sigma pptSix sigma ppt
Six sigma ppt
 
Simple Process Mapping Techniques
Simple Process Mapping TechniquesSimple Process Mapping Techniques
Simple Process Mapping Techniques
 

Similar to 7 new QC TOOLS

NewSevenToolssssssssssssssssssssssssssssssss
NewSevenToolssssssssssssssssssssssssssssssssNewSevenToolssssssssssssssssssssssssssssssss
NewSevenToolssssssssssssssssssssssssssssssss
Nagaraju94925
 
New Seven QCTools.pptx
New Seven QCTools.pptxNew Seven QCTools.pptx
New Seven QCTools.pptx
Muthu Swamy
 
@Quality management tools
@Quality management tools@Quality management tools
@Quality management tools
keshavrasal
 
Continuos improvement tools ii
Continuos improvement tools iiContinuos improvement tools ii
Continuos improvement tools ii
DEPROCESS
 
Root Cause Analysis
Root Cause AnalysisRoot Cause Analysis
Root Cause Analysis
johnchuddle
 
Data Analysis Toolkit_Final v1.0
Data Analysis Toolkit_Final v1.0Data Analysis Toolkit_Final v1.0
Data Analysis Toolkit_Final v1.0
lee_anderson40
 

Similar to 7 new QC TOOLS (20)

Advanced quality tools
Advanced quality toolsAdvanced quality tools
Advanced quality tools
 
NewSevenTools.ppt
NewSevenTools.pptNewSevenTools.ppt
NewSevenTools.ppt
 
NewSevenToolssssssssssssssssssssssssssssssss
NewSevenToolssssssssssssssssssssssssssssssssNewSevenToolssssssssssssssssssssssssssssssss
NewSevenToolssssssssssssssssssssssssssssssss
 
NewSevenTools.ppt
NewSevenTools.pptNewSevenTools.ppt
NewSevenTools.ppt
 
NewSevenTools.ppt
NewSevenTools.pptNewSevenTools.ppt
NewSevenTools.ppt
 
Seven QC Tools New approach.pptx
Seven QC Tools New approach.pptxSeven QC Tools New approach.pptx
Seven QC Tools New approach.pptx
 
New Seven QCTools.pptx
New Seven QCTools.pptxNew Seven QCTools.pptx
New Seven QCTools.pptx
 
12. seven management & planning tools
12. seven management & planning tools12. seven management & planning tools
12. seven management & planning tools
 
@Quality management tools
@Quality management tools@Quality management tools
@Quality management tools
 
Pdpc, matrix data
Pdpc, matrix dataPdpc, matrix data
Pdpc, matrix data
 
Continuos improvement tools ii
Continuos improvement tools iiContinuos improvement tools ii
Continuos improvement tools ii
 
new quality tools
 new quality tools new quality tools
new quality tools
 
Root Cause Analysis
Root Cause AnalysisRoot Cause Analysis
Root Cause Analysis
 
New 7 Management Tools
New 7 Management ToolsNew 7 Management Tools
New 7 Management Tools
 
Tree, matrix and arrow diagram
Tree, matrix and arrow diagramTree, matrix and arrow diagram
Tree, matrix and arrow diagram
 
Seven New Quality Control Tools for Total Quality Management
Seven New Quality Control Tools for Total Quality ManagementSeven New Quality Control Tools for Total Quality Management
Seven New Quality Control Tools for Total Quality Management
 
New 7 QC Tools.pdf
New 7 QC Tools.pdfNew 7 QC Tools.pdf
New 7 QC Tools.pdf
 
Towards a Systemic Design Toolkit: A Practical Workshop - #RSD5 Workshop, Tor...
Towards a Systemic Design Toolkit: A Practical Workshop - #RSD5 Workshop, Tor...Towards a Systemic Design Toolkit: A Practical Workshop - #RSD5 Workshop, Tor...
Towards a Systemic Design Toolkit: A Practical Workshop - #RSD5 Workshop, Tor...
 
Seven Quality Tools.pptx
Seven Quality Tools.pptxSeven Quality Tools.pptx
Seven Quality Tools.pptx
 
Data Analysis Toolkit_Final v1.0
Data Analysis Toolkit_Final v1.0Data Analysis Toolkit_Final v1.0
Data Analysis Toolkit_Final v1.0
 

Recently uploaded

All Time Service Available Call Girls Baga Beach 📳 7427069034 For 18+ VIP Cal...
All Time Service Available Call Girls Baga Beach 📳 7427069034 For 18+ VIP Cal...All Time Service Available Call Girls Baga Beach 📳 7427069034 For 18+ VIP Cal...
All Time Service Available Call Girls Baga Beach 📳 7427069034 For 18+ VIP Cal...
rv4726893
 

Recently uploaded (9)

Satna Escorts Service Girl ^ 9332606886, WhatsApp Anytime Satna
Satna Escorts Service Girl ^ 9332606886, WhatsApp Anytime SatnaSatna Escorts Service Girl ^ 9332606886, WhatsApp Anytime Satna
Satna Escorts Service Girl ^ 9332606886, WhatsApp Anytime Satna
 
Effective Project Team Structure Template Excel
Effective Project Team Structure Template ExcelEffective Project Team Structure Template Excel
Effective Project Team Structure Template Excel
 
Webinar - Maximize the efficiency of your merit increase cycle
Webinar - Maximize the efficiency of your merit increase cycleWebinar - Maximize the efficiency of your merit increase cycle
Webinar - Maximize the efficiency of your merit increase cycle
 
Will Robots Steal Your Jobs? Will Robots Steal Your Jobs? 10 Eye-Opening Work...
Will Robots Steal Your Jobs? Will Robots Steal Your Jobs? 10 Eye-Opening Work...Will Robots Steal Your Jobs? Will Robots Steal Your Jobs? 10 Eye-Opening Work...
Will Robots Steal Your Jobs? Will Robots Steal Your Jobs? 10 Eye-Opening Work...
 
💰Call Girl In Bhubaneswar☎️977794-9614💰 Call Girl service in Bhubaneswar☎️Bhu...
💰Call Girl In Bhubaneswar☎️977794-9614💰 Call Girl service in Bhubaneswar☎️Bhu...💰Call Girl In Bhubaneswar☎️977794-9614💰 Call Girl service in Bhubaneswar☎️Bhu...
💰Call Girl In Bhubaneswar☎️977794-9614💰 Call Girl service in Bhubaneswar☎️Bhu...
 
Durg Escorts Service Girl ^ 9332606886, WhatsApp Anytime Durg
Durg Escorts Service Girl ^ 9332606886, WhatsApp Anytime DurgDurg Escorts Service Girl ^ 9332606886, WhatsApp Anytime Durg
Durg Escorts Service Girl ^ 9332606886, WhatsApp Anytime Durg
 
Abortion pills in Jeddah +966572737505 <> buy cytotec <> unwanted kit Saudi A...
Abortion pills in Jeddah +966572737505 <> buy cytotec <> unwanted kit Saudi A...Abortion pills in Jeddah +966572737505 <> buy cytotec <> unwanted kit Saudi A...
Abortion pills in Jeddah +966572737505 <> buy cytotec <> unwanted kit Saudi A...
 
Ulhasnagar Escorts Service Girl ^ 9332606886, WhatsApp Anytime Ulhasnagar
Ulhasnagar Escorts Service Girl ^ 9332606886, WhatsApp Anytime UlhasnagarUlhasnagar Escorts Service Girl ^ 9332606886, WhatsApp Anytime Ulhasnagar
Ulhasnagar Escorts Service Girl ^ 9332606886, WhatsApp Anytime Ulhasnagar
 
All Time Service Available Call Girls Baga Beach 📳 7427069034 For 18+ VIP Cal...
All Time Service Available Call Girls Baga Beach 📳 7427069034 For 18+ VIP Cal...All Time Service Available Call Girls Baga Beach 📳 7427069034 For 18+ VIP Cal...
All Time Service Available Call Girls Baga Beach 📳 7427069034 For 18+ VIP Cal...
 

7 new QC TOOLS

  • 1. Presented by: Dennees Varughees K Roll.no: 32425 Faculty Incharge: Mr. Susairaj
  • 2. WHAT ARE THE NEW SEVEN QUALITY TOOLS In 1976, the Union of Japanese Scientists and Engineers (JUSE) saw the need for tools to promote innovation, communicate information and successfully plan major projects. A team researched and developed the seven new quality control tools, to be used with the 7 basic quality tools. Often called the seven management and planning (MP) tools, or simply the seven management tools.
  • 3. THE NEW SEVEN QUALITY TOOLS (THE SEVEN MANAGEMENT AND PLANNING TOOLS) The seven new tools are: 1. Affinity Diagram 2. Relations Diagram 3. Tree Diagram 4. Matrix Diagram 5. Arrows Diagram 6. Process Decision Program Chart 7. Prioritization Matrix- Matrix Data Analysis
  • 4. Developed to organize verbal data diagrammatically Basic 7 tools effective for data analysis, process control and quality improvement (numerical data) Used together Increases Total quality management effectiveness
  • 5. FACTS Data Numerical Data Verbal Data Organize The Seven New Tools Information The Basic Seven Tools • Generate Ideas • Formulate plans • Analytical approach Define problem after collecting numerical data Define problem before collecting numerical data
  • 6. BENEFITS OF INCORPORATING NEW SEVEN Q.C. TOOLS Five Objectives of Organizational Reform which will establish a Culture that: Identifies problems Gives importance to planning Stresses the importance of the process Prioritizes tasks Encourages everyone to think systematically
  • 7.  Gathers large amounts of verbal data (ideas, opinions, issues); then Organizes the data into groups based on natural relationship  Makes it feasible for further analysis and to find a solution to the problem. Why use the Affinity Diagram? To allow a team to creatively generate a large number of ideas/issues and then organize and summarize natural groupings among them to understand the essence of a problem and propose solutions.
  • 8.  Select the topic to be analyzed  Use brainstorming to collect verbal data and ideas  Write each item on separate data card  Spread out all cards on table or stick them on a board  Move data cards into groups of similar themes (natural affinity for each other)  Combine statements on data cards to new Affinity statement  Make new card with Affinity statement  Continue to combine until less than 5 groups  Draw the final Affinity Diagram for the problem discussed
  • 9. Verbal data generated by brainstorming and written on cards Organized cards through natural relations = Affinity diagram
  • 10. For Finding Solutions Strategies by Clarifying Relationships with Complex Interrelated Causes.To allow a team to systematically identify, analyze, and classify the cause and effect relationships that exist among all critical issues.  Useful at planning stage for obtaining perspective on overall situation.  Facilitates consensus among team  Assists to develop and change people’s thinking  Enables priorities to be identified accurately
  • 11.  Express the problem in form of “Why isn’t something happening?”  Each member lists 5 causes affecting problem  Discuss info collected until everyone understands it thoroughly  Write each item on a card  Move cards into similar groups  Asking why, explore the cause-effect relationships, and divide the cards into primary, secondary and tertiary causes  Connect all cards by these relationships  Further discuss until all possible causes have been identified  Review whole diagram looking for relationships among causes  Connect all related groups  Next, complete the diagram
  • 12. Makes the problem recognizable by clarifying the relationships among causes Why does X happen? Primary Cause Primary Cause Primary Cause Primary Cause Tertiary Cause Secondary Cause Secondary Cause Secondary Cause Secondary Cause Tertiary Cause th level4 Cause Tertiary Cause Tertiary Cause th level4 Cause 5 th level Cause th level6 Cause Tertiary Cause Secondary Cause
  • 13. For Systematically Pursuing the Best Strategies for Attaining an Objective  Develops a succession of strategies for achieving objectives  Reveals methods to achieve the results.  Also known as Systematic diagrams or Dendrograms Advantages of Tree Diagram  Systematic and logical approach is less likely that items are omitted  Facilitates agreement among team  Are extremely convincing with strategies
  • 14.  Write Relations Diagram topic (Objective card)  Identify constraints on how objective can be achieved  Take each primary mean, write objective for achieving it (secondary means)  Continue to expand to the fourth level  Review each system of means in both directions (from objective to means and means to objective)  Add more cards if needed  Connect all levels  Next, complete the diagram
  • 15. :Example of Customer complaints due to poor quality
  • 16.  Consists of a two-dimensional array to determine location and nature of problem  Discovers key ideas by relationships represented by the cells in matrix.  Enable data on ideas based on extensive experience  Clarifies relationships among different elements  Makes overall structure of problem immediately obvious  Combined from two to four types of diagrams, location of problem is clearer.
  • 17.  Write final-level means from Tree diagram forming vertical axis  Write in Evaluation categories (efficacy, practicability, and rank) on horizontal axis.  Write names along horizontal axis  Examine final-level means to identify whom will implement them  Label group of columns as “Responsibilities”  Label right-hand end of horizontal axis as “Remarks”  Examine each cell and insert the appropriate symbol:  O=good, =satisfactory, X=none  Determine score for each combination of symbols, record in rank column.  Examine cells under Responsibility Columns, insert double-circle for Principal and single-circle for Subsidiary  Fill out remarks column and record meanings of symbol  Next, complete the diagram
  • 19. For Working Out Optimal Schedules and Controlling Them Effectively  Shows relationships among tasks needed to implement a plan  Network technique using nodes for events and arrows for activities  Allows overall task to viewed and potential snags to be identified before work starts  Leads to discovery of possible improvements  Makes it easy to monitor progress of work  Deals promptly with changes to plan  Improves communication among team
  • 20.  From strategies on Tree diagram, select one (Objective of Arrow Diagram)  Identify constraints to Objective  Write all essential activities on separate cards  List all activities necessary to achieving Objective  Organize cards in sequential order of activities  Remove any duplicate activities  Review order of activities, find sequence with greatest amount of activities  Arrange parallel activities  Record names and other necessary information  Next, complete the diagram  Examine path, number nodes in sequence from left to right
  • 21. Arrow Diagram: Example of building a room.
  • 22.  PDPCs are used for planning the activities needed to solve problem when information is incomplete or the situation is fluid and hard to forecast.  Examples include planning an R & D project, mapping out countermeasure against long-term chronic problems, and planning a sales campaign.  A PDPC consists of a series of steps linked in sequence. Its goal is to depict the events and contingencies likely to occur when progressing from a starting point to one or more final outcomes
  • 24.  Technique quantifies and arranges data presented in Matrix  Based solely on numerical data.  Finds indicators that differentiate and attempt to clarify large amount of information. Prioritization Matrix is used by teams to narrow down options through a systematic approach of comparing choices by selecting, weighting, and applying criteria.
  • 25.  Determine your goal, your alternatives, and criteria for decision  Place selection in order of importance  Sum individual ratings to establish overall ranking (Divide by number of options for average ranking)  Apply percentage weight to each option  Rank order each option with respect to criterion (Average the rankings and apply a completed ranking)  Multiply weight by associated rank in Matrix (in example, 4 is best, 1 is worst)  Result is Importance Score  Add up Importance Scores for each option  Rank order the alternatives according to importance
  • 26. Prioritization Matrix –Example from manufacturing Source: Foster, S., Managing Quality (Upper Saddle River, NJ: Prentice Hall, 2001)
  • 27. Benefits of New Seven Q.C. Tools 1- Provide Training in Thinking 2- Raise People’s Problem Solving Confidence 3- Increase People’s Ability to Predict Future Events Roles of New Seven Q.C. Tools 1- Express verbal data diagrammatically 2- Make information visible 3- Organize information intelligibly 4- Clarify overall picture and fine details 5- Get more people involved