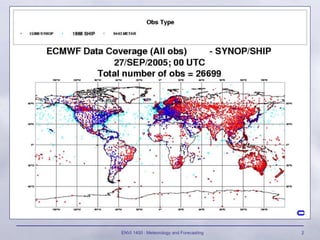
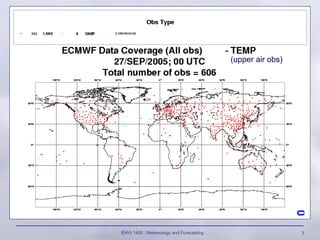
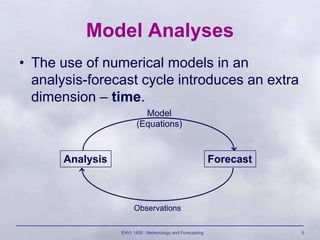
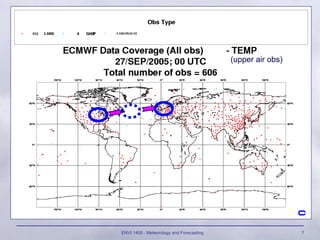
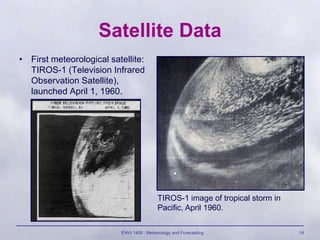
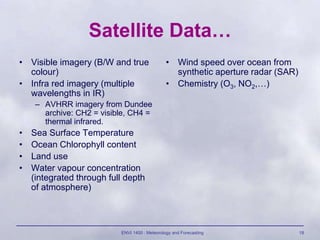
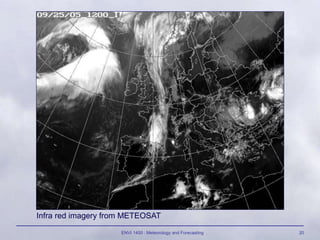
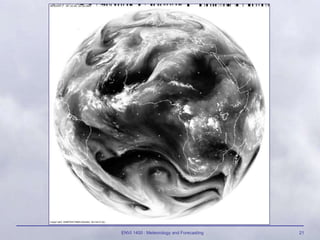
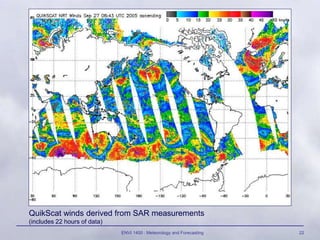
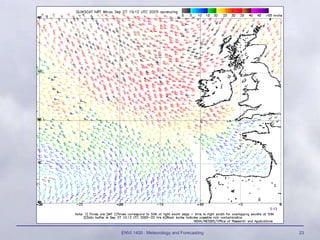
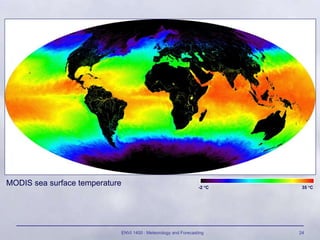
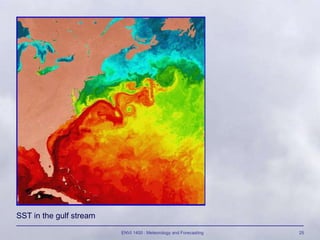
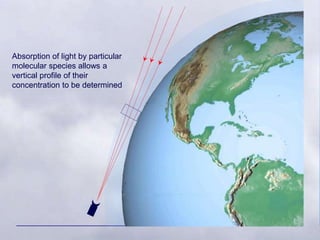
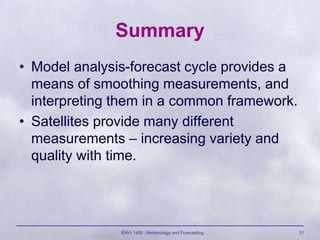
Model & Satellite Data
Dr Ian Brooks
ENVI 1400 : Meteorology and Forecasting 2
ENVI 1400 : Meteorology and Forecasting 3
(upper air obs)
ENVI 1400 : Meteorology and Forecasting 4
Synoptic Analysis
• A simple analysis based on the observed
synoptic data provides an instantaneous
snapshot of the state of the atmosphere
• Problems:
– Very scattered observations…excessive
interpolation in data sparse regions
– Bias by individual measurements
• Instrument error
• Sample unrepresentative of general conditions
ENVI 1400 : Meteorology and Forecasting 5
Model Analyses
• The use of numerical models in an
analysis-forecast cycle introduces an extra
dimension – time.
Analysis Forecast
Model
(Equations)
Observations
ENVI 1400 : Meteorology and Forecasting 6
• ADVANTAGES:
– Data from past observations affects present analysis
(4D variable assimilation)
– Regions without observations are handled more
realistically because information from past
observation upwind propagates into data-sparse
region.
– Raw observations are smoothed during interpolation
onto model grid – helps remove bias from non-
representative measurements.
• LIMITATIONS
– Generally better than just sparse observations, BUT it
is not real data – errors are very hard to assess.
ENVI 1400 : Meteorology and Forecasting 7
(upper air obs)
ENVI 1400 : Meteorology and Forecasting 8
REANALYSIS
• ECMWF (and NCEP in USA) conduct
reanalyses of past  forecasts of past weather.
– Not all observations are available in time to be
included in regular forecast cycle
– Allows time for extra quality control and corrections to
be applied
• ECMWF:
– ERA-15 : 1978-1993
– ERA-40 : 1958-1997
ENVI 1400 : Meteorology and Forecasting 9
• Reanalysis data is used for:
– Climatological studies
– As model initialization fields (for research) in
data-sparse regions or upper atmosphere
• Atmospheric chemistry modelling studies
– To provide boundary conditions for regional-
scale modelling studies (Research)
ENVI 1400 : Meteorology and Forecasting 10
MODELS
• Global models divide the
world into a grid, data is
held on the intersections
of the grid.
• Figure shows a 10 grid
• MetOffice global model
uses a grid of
approximately 0.8
longitude by 0.5 latitude
– UK represented by ~10x20
grid points (~60km
spacing)
ENVI 1400 : Meteorology and Forecasting 11
• MetOffice mesoscale
model – higher resolution,
limited area model.
• Uses the global model to
provide initialization and
boundary conditions.
– 0.11° by 0.11° grid:
approximately 11km
resolution.
– 38 vertical levels in both global
and mesoscale models,
spacing increases with
altitude.
ENVI 1400 : Meteorology and Forecasting 12
Pennines Vale of York North Sea
Model resolution is too low to resolve:
• Individual clouds, even large thunderstorms.
• Full details of topography
• Details of changes of surface type
Processes on scales smaller than the grid must be parameterized.
ENVI 1400 : Meteorology and Forecasting 13
Parameterization
• Parameterization is the simplification of a
complex physical process in terms of
parameters that are available to the model, or
readily measured.
• Models must use parameterizations of
processes that :
– Take place on scales smaller than the model grid
– Involve parameters that are not explicitly defined in
the model
ENVI 1400 : Meteorology and Forecasting 14
Satellite Data
• First meteorological satellite:
TIROS-1 (Television Infrared
Observation Satellite),
launched April 1, 1960.
TIROS-1 image of tropical storm in
Pacific, April 1960.
ENVI 1400 : Meteorology and Forecasting 15
• Geostationary satellites:
– remain above the same spot
on the Earth’s surface – orbital
period = period of rotation of
earth.
– Approximately 36000km
above surface.
– 5 or 6 satellites spaced to give
coverage of whole earth.
– e.g: METEOSAT (EU), GOES
series (USA)
• Polar Orbiting:
– Orbit is oriented north-south
(inclined slightly). Often sun-
synchronous.
– Orbital period ~100 minutes.
– Pass over different part of
surface on every orbit –
passes over same spot at
irregular intervals.
– Low-altitude (700-800km)
allows much higher resolution
imagery than geostationary
satellites.
See: http://www.sat.dundee.ac.uk, http://www.goes.noaa.gov/
ENVI 1400 : Meteorology and Forecasting 16
ENVI 1400 : Meteorology and Forecasting 17
NOAA-15 polar orbiter ground track for September 28 2005.
ENVI 1400 : Meteorology and Forecasting 18
Satellite Data…
• Visible imagery (B/W and true
colour)
• Infra red imagery (multiple
wavelengths in IR)
– AVHRR imagery from Dundee
archive: CH2 = visible, CH4 =
thermal infrared.
• Sea Surface Temperature
• Ocean Chlorophyll content
• Land use
• Water vapour concentration
(integrated through full depth
of atmosphere)
• Wind speed over ocean from
synthetic aperture radar (SAR)
• Chemistry (O3, NO2,…)
ENVI 1400 : Meteorology and Forecasting 19
Visible imagery from METEOSAT
ENVI 1400 : Meteorology and Forecasting 20
Infra red imagery from METEOSAT
ENVI 1400 : Meteorology and Forecasting 21
ENVI 1400 : Meteorology and Forecasting 22
QuikScat winds derived from SAR measurements
(includes 22 hours of data)
ENVI 1400 : Meteorology and Forecasting 23
ENVI 1400 : Meteorology and Forecasting 24
MODIS sea surface temperature -2 C 35 C
ENVI 1400 : Meteorology and Forecasting 25
SST in the gulf stream
ENVI 1400 : Meteorology and Forecasting 26
Carbon monoxide from biomass burning
ENVI 1400 : Meteorology and Forecasting 27
• Most satellites look vertically
downwards – data is either:
– Vertical integral through
atmosphere (e.g. water
vapour)
– Represents value at some
upper altitude (cloud top)
– Surface value
• In latter two cases, it can
sometimes be difficult to
determine vertical location e.g:
– distinguishing cloud from
snow/ice,
– low cloud temperature from
surface temperature.
• Vertical profiles of some
quantities can be obtained via
limb-sounding – looking at the
edge (limb) of the visible disk
of earth, i.e. sideways through
the atmosphere.
– Vertical resolution is good
– Horizontal resolution is poor
• Particularly useful for chemical
measurements, where certain
wavelengths of light are
absorbed by known chemical
species.
ENVI 1400 : Meteorology and Forecasting 28
Absorption of light by particular
molecular species allows a
vertical profile of their
concentration to be determined
ENVI 1400 : Meteorology and Forecasting 29
ENVI 1400 : Meteorology and Forecasting 30
Profiles of temperature and humidity derived from limb-soundings, using
propagation delays in GPS signals.
http://www.gfz-potsdam.de/pb1/op/champ/index_CHAMP.html
ENVI 1400 : Meteorology and Forecasting 31
Summary
• Model analysis-forecast cycle provides a
means of smoothing measurements, and
interpreting them in a common framework.
• Satellites provide many different
measurements – increasing variety and
quality with time.

11-model-and-satellite-data.ppt

  • 1.
    Model & SatelliteData Dr Ian Brooks
  • 2.
    ENVI 1400 :Meteorology and Forecasting 2
  • 3.
    ENVI 1400 :Meteorology and Forecasting 3 (upper air obs)
  • 4.
    ENVI 1400 :Meteorology and Forecasting 4 Synoptic Analysis • A simple analysis based on the observed synoptic data provides an instantaneous snapshot of the state of the atmosphere • Problems: – Very scattered observations…excessive interpolation in data sparse regions – Bias by individual measurements • Instrument error • Sample unrepresentative of general conditions
  • 5.
    ENVI 1400 :Meteorology and Forecasting 5 Model Analyses • The use of numerical models in an analysis-forecast cycle introduces an extra dimension – time. Analysis Forecast Model (Equations) Observations
  • 6.
    ENVI 1400 :Meteorology and Forecasting 6 • ADVANTAGES: – Data from past observations affects present analysis (4D variable assimilation) – Regions without observations are handled more realistically because information from past observation upwind propagates into data-sparse region. – Raw observations are smoothed during interpolation onto model grid – helps remove bias from non- representative measurements. • LIMITATIONS – Generally better than just sparse observations, BUT it is not real data – errors are very hard to assess.
  • 7.
    ENVI 1400 :Meteorology and Forecasting 7 (upper air obs)
  • 8.
    ENVI 1400 :Meteorology and Forecasting 8 REANALYSIS • ECMWF (and NCEP in USA) conduct reanalyses of past  forecasts of past weather. – Not all observations are available in time to be included in regular forecast cycle – Allows time for extra quality control and corrections to be applied • ECMWF: – ERA-15 : 1978-1993 – ERA-40 : 1958-1997
  • 9.
    ENVI 1400 :Meteorology and Forecasting 9 • Reanalysis data is used for: – Climatological studies – As model initialization fields (for research) in data-sparse regions or upper atmosphere • Atmospheric chemistry modelling studies – To provide boundary conditions for regional- scale modelling studies (Research)
  • 10.
    ENVI 1400 :Meteorology and Forecasting 10 MODELS • Global models divide the world into a grid, data is held on the intersections of the grid. • Figure shows a 10 grid • MetOffice global model uses a grid of approximately 0.8 longitude by 0.5 latitude – UK represented by ~10x20 grid points (~60km spacing)
  • 11.
    ENVI 1400 :Meteorology and Forecasting 11 • MetOffice mesoscale model – higher resolution, limited area model. • Uses the global model to provide initialization and boundary conditions. – 0.11° by 0.11° grid: approximately 11km resolution. – 38 vertical levels in both global and mesoscale models, spacing increases with altitude.
  • 12.
    ENVI 1400 :Meteorology and Forecasting 12 Pennines Vale of York North Sea Model resolution is too low to resolve: • Individual clouds, even large thunderstorms. • Full details of topography • Details of changes of surface type Processes on scales smaller than the grid must be parameterized.
  • 13.
    ENVI 1400 :Meteorology and Forecasting 13 Parameterization • Parameterization is the simplification of a complex physical process in terms of parameters that are available to the model, or readily measured. • Models must use parameterizations of processes that : – Take place on scales smaller than the model grid – Involve parameters that are not explicitly defined in the model
  • 14.
    ENVI 1400 :Meteorology and Forecasting 14 Satellite Data • First meteorological satellite: TIROS-1 (Television Infrared Observation Satellite), launched April 1, 1960. TIROS-1 image of tropical storm in Pacific, April 1960.
  • 15.
    ENVI 1400 :Meteorology and Forecasting 15 • Geostationary satellites: – remain above the same spot on the Earth’s surface – orbital period = period of rotation of earth. – Approximately 36000km above surface. – 5 or 6 satellites spaced to give coverage of whole earth. – e.g: METEOSAT (EU), GOES series (USA) • Polar Orbiting: – Orbit is oriented north-south (inclined slightly). Often sun- synchronous. – Orbital period ~100 minutes. – Pass over different part of surface on every orbit – passes over same spot at irregular intervals. – Low-altitude (700-800km) allows much higher resolution imagery than geostationary satellites. See: http://www.sat.dundee.ac.uk, http://www.goes.noaa.gov/
  • 16.
    ENVI 1400 :Meteorology and Forecasting 16
  • 17.
    ENVI 1400 :Meteorology and Forecasting 17 NOAA-15 polar orbiter ground track for September 28 2005.
  • 18.
    ENVI 1400 :Meteorology and Forecasting 18 Satellite Data… • Visible imagery (B/W and true colour) • Infra red imagery (multiple wavelengths in IR) – AVHRR imagery from Dundee archive: CH2 = visible, CH4 = thermal infrared. • Sea Surface Temperature • Ocean Chlorophyll content • Land use • Water vapour concentration (integrated through full depth of atmosphere) • Wind speed over ocean from synthetic aperture radar (SAR) • Chemistry (O3, NO2,…)
  • 19.
    ENVI 1400 :Meteorology and Forecasting 19 Visible imagery from METEOSAT
  • 20.
    ENVI 1400 :Meteorology and Forecasting 20 Infra red imagery from METEOSAT
  • 21.
    ENVI 1400 :Meteorology and Forecasting 21
  • 22.
    ENVI 1400 :Meteorology and Forecasting 22 QuikScat winds derived from SAR measurements (includes 22 hours of data)
  • 23.
    ENVI 1400 :Meteorology and Forecasting 23
  • 24.
    ENVI 1400 :Meteorology and Forecasting 24 MODIS sea surface temperature -2 C 35 C
  • 25.
    ENVI 1400 :Meteorology and Forecasting 25 SST in the gulf stream
  • 26.
    ENVI 1400 :Meteorology and Forecasting 26 Carbon monoxide from biomass burning
  • 27.
    ENVI 1400 :Meteorology and Forecasting 27 • Most satellites look vertically downwards – data is either: – Vertical integral through atmosphere (e.g. water vapour) – Represents value at some upper altitude (cloud top) – Surface value • In latter two cases, it can sometimes be difficult to determine vertical location e.g: – distinguishing cloud from snow/ice, – low cloud temperature from surface temperature. • Vertical profiles of some quantities can be obtained via limb-sounding – looking at the edge (limb) of the visible disk of earth, i.e. sideways through the atmosphere. – Vertical resolution is good – Horizontal resolution is poor • Particularly useful for chemical measurements, where certain wavelengths of light are absorbed by known chemical species.
  • 28.
    ENVI 1400 :Meteorology and Forecasting 28 Absorption of light by particular molecular species allows a vertical profile of their concentration to be determined
  • 29.
    ENVI 1400 :Meteorology and Forecasting 29
  • 30.
    ENVI 1400 :Meteorology and Forecasting 30 Profiles of temperature and humidity derived from limb-soundings, using propagation delays in GPS signals. http://www.gfz-potsdam.de/pb1/op/champ/index_CHAMP.html
  • 31.
    ENVI 1400 :Meteorology and Forecasting 31 Summary • Model analysis-forecast cycle provides a means of smoothing measurements, and interpreting them in a common framework. • Satellites provide many different measurements – increasing variety and quality with time.