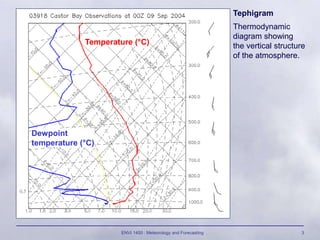
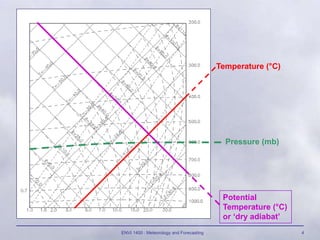
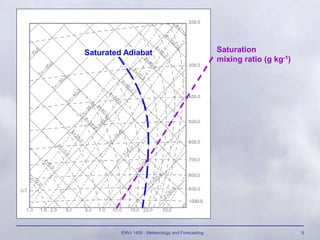
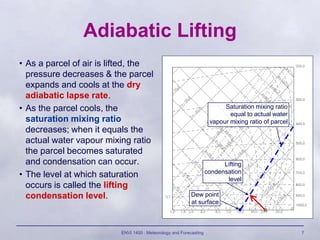
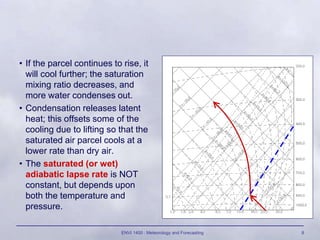
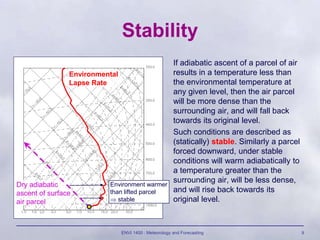
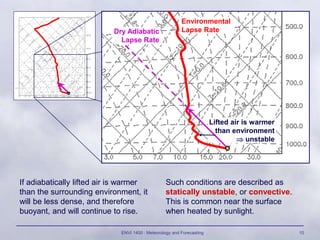
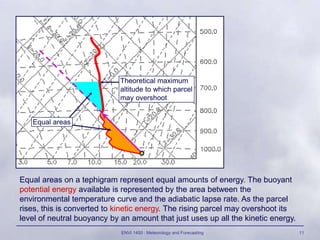
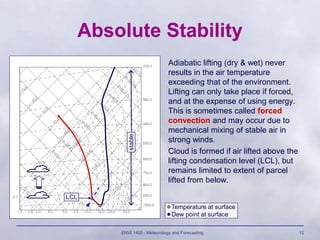
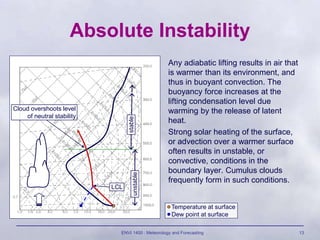
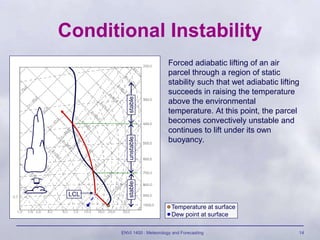
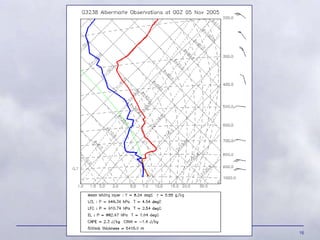
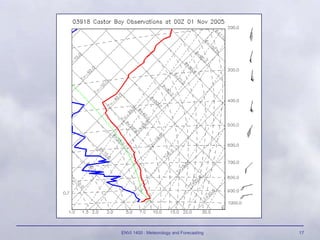
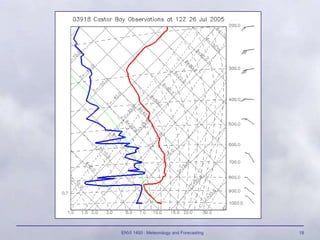
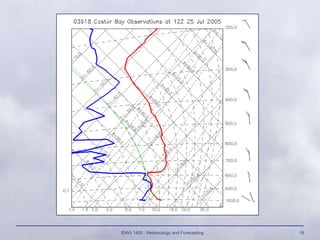
Tephigrams are thermodynamic diagrams that show the vertical structure of the atmosphere. They have the property that equal areas on the diagram represent equal amounts of energy. Tephigrams depict the temperature, dewpoint, potential temperature, and saturation mixing ratio to analyze atmospheric stability and potential for cloud formation and convection. Areas between environmental temperature curves and adiabatic lapse rates indicate the potential buoyant energy available for parcel lifting.
![ENVI 1400 : Meteorology and Forecasting 15
Convective Instability
The column of air A-B has a
lapse rate less than the dry
adiabatic lapse rate, and is
thus stable.
If the column is forced to lift
adiabatically, the whole
column cools. If the lower part
of the column reaches
saturation [A'], it starts to cool
at the wet adiabatic lapse rate
– if this is less than the lapse
rate of the column A'-B‘, the
column becomes unstable.
This type of instability may
occur during large scale lifting
up frontal surfaces or flow over
mountain ranges.
A'
B
B'
A
LCL](https://image.slidesharecdn.com/08-tephigrams-230129130727-d62ed7aa/85/08-Tephigrams-ppt-15-320.jpg)


![18.2[1] cloud formation](https://cdn.slidesharecdn.com/ss_thumbnails/18-21cloudformation-100415125441-phpapp01-thumbnail.jpg?width=640&height=640&fit=bounds)