Downloaded 30 times


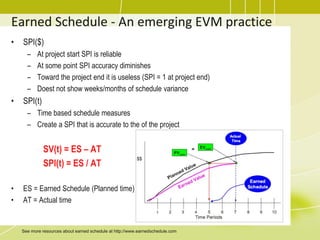
![Forecasting EAC
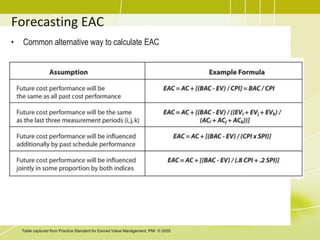
• There are many ways to calculate EAC, depending on the
assumption made.
• Simple EAC calculation (EAC = BAC/CPI) assume that the
cumulative CPI adequately reflects past performance that will
continue to the end of the project.
• AC+(BAC-EV)
– Used when current variances are thought to be atypical of the future
• AC+[(BAC-EV)/(Cumulative CPI + Cumulative SPI)]
– It assumes poor cost performance and need to hit a firm completion date.](https://image.slidesharecdn.com/07-projectcostmanagement-151021083104-lva1-app6891/85/07-projectcostmanagement-21-320.jpg)


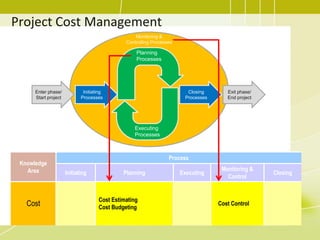
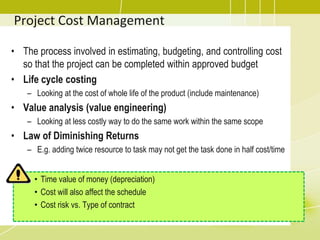
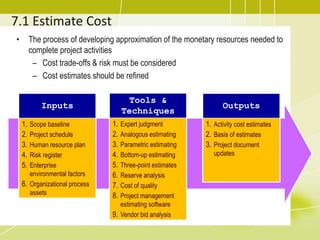
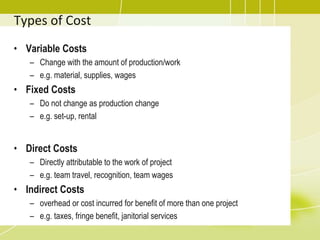
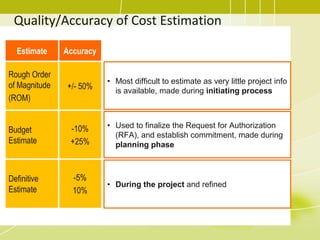
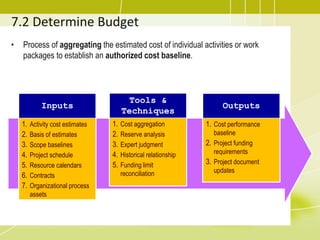
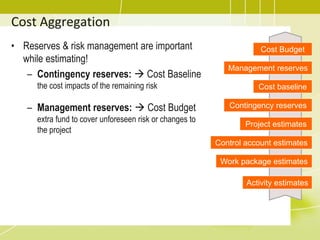
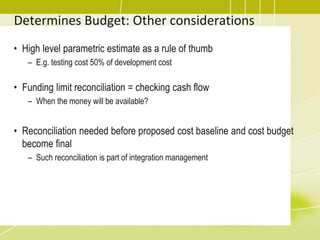
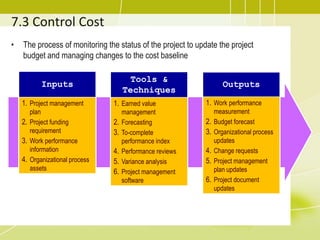
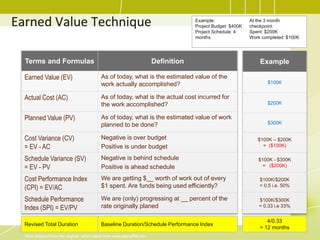
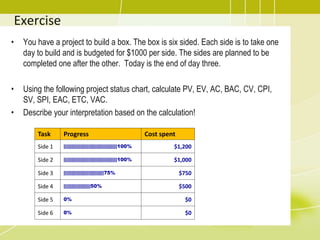
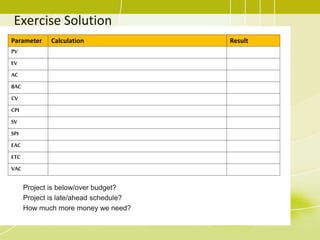
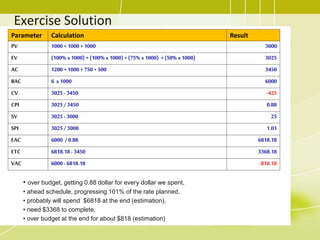
This document provides an overview of project cost management. It discusses estimating, budgeting, and controlling costs so the project can be completed within the approved budget. Key aspects covered include developing cost estimates using various techniques, determining an authorized cost baseline by aggregating estimates, and monitoring costs against the baseline using earned value management. Formulas for calculating important metrics like cost and schedule variance, cost performance index, and estimate at completion are also presented to aid in cost control.


