SlideShare a Scribd company logo
Water Demand
Water Demand
• Designed capacity of the water supply system (WSS)
– Meeting water demands at the end of the design period
– Design period: service life of different components of a water
supply system (varies from 15 years to 100 years)
• Water demands at the end of the design periods are basis for
the water supply systems design
– Water demands at each of the supply nodes may be needed
• Average Day Demand (ADD); Maximum Day Demand (MDD);
and Peak Hour Demand (PHD) are actually required
– ADD is annual water consumption divided by 365 days
– MDD is taken as 1.8 times the ADD
– PHD is taken as (1.5/24) MDD (distribution pumps, reservoirs
and system are designed for the PHD)
• Water demand = (Per capita demand)EDP x (Population)EDP
• Using urban population history, (Population)EDP is forecasted
Design Period
• Usually taken as 30 years after completion of the project
– 50 years for certain components and 15 years for certain other
components
– Time lag between design and completion of project can be 2 to 5 years
• Future expansion and duplication provisions can be incorporated
into the project
• Water supply should match with water demand at the end of design
period
– Water requirements at the end of the design period should be known
– Requires population and its spatial distribution at the end of the
design period.
• Commercial, institutional and industrial development patterns of
the city should be known
• Life styles and Improvements in living standards affect the water
demands
• Water conservation measures (source minimization and recycling
and reuse of treated effluents) minimize water demands
Per capita water demand
• Diverse urban water demands need expression as per capita
water demands
– Residential, commercial, institutional, industrial, public &
ecological, and fire water (and unaccounted for water!)
• Assorting the water demands between the duel water supply
systems may also be needed
– Virgin water supply systems
– Reclaimed and local water supply systems
• Per capita water demand is dynamic and changing
– Currently increasing but may show a decreasing trend in future
• Per capita demand varies widely among the urban population,
and average per capita demand must be considered
• Water demands are also influenced by
– Water availability and supplies
– Water costs and water charging
– Water conservation measures
Water demands of urban population
• Residential water demands
– Indoor uses: Toilet flushing, Bathing, Washing clothes, Kitchens
(cooking and drinking), Wash basins (miscellaneous washing),
Desert coolers and Miscellaneous (house cleaning!) uses.
– Outdoor uses: Kitchen gardening and irrigation of lawns and
hedges; Car wash and vehicle cleaning; Yard/road wetting, etc.
• Commercial and institutional water demands
– Shops, molls and markets
– Food joints, restaurants and hotels
– Clinics, nursing homes, health centers and hospitals
– Cinema houses, concert halls and theaters
– Temples and other religious places
– Schools, colleges, institutions and universities
– Offices and administrative buildings
– Railway stations, bus stations, air ports and sea ports
Water demands of urban population
• Industrial water demands (including animal keeping)
– Number, type and size of industries and their water intensities
• Public and ecological water demands
– Public taps
– Public urinals and community toilets
– Swimming pools and community baths
– Street washing/wetting
– Sewer flushing
– Irrigation of public parks and gardens
– Public fountains
• Fire water
• Unaccounted for water
– Leaks
– Wastage of water
– Unauthorized and illegal connections
Factors affecting per capita water demands
• Size of the city:
– Demand increases with size
– Fluctuations in demand are larger with lower population size
• Climate conditions (temperature, precipitation, wind) and season
– Water demands peak during summer months
– Fire demands are higher in summers (hourly demands increase)
• Commercial, institutional and industrial development and activities
• Population density and urban landscaping: Public and ecological
uses of water are influenced.
• Housing: Slums, independent houses and multistoried buildings;
Ground floor dwellings or dwellings in the other floors; Per capita
floor area and plot area.
• Income groups (low, middle and high income groups, and EWS) and
Standard of living
– High income households consume 250-400 LPCD
– For EWS (economically weaker sections) 135 LPCD requirement
– Some households consume as low as 40 LPCD water
Factors affecting per capita water demands
• Social and cultural conditions and life styles: Habits, social
status, and customs of people
• Time of the day and day of the week
– Normal days, weekend days, and festive days or special days
– Most of the day’s water is consumed between 6 – 10 AM and
between 4 – 8 PM (demand for the rest 16 hrs is negligible)
• Quality, quantity and availability of water
– Reliability of water supply
– Water supply patterns (continuous and intermittent supplies)
– Water pressure in the water distribution system (Increasing
pressure increases wastage and leaks)
– Water metering and charging
• Water conservation measures
– Use of water efficient taps, showers, washing machines, toilet
flushes, garden hoses, etc.
1. For communities of <20,000 population
Water supply through stand posts 40 LPCD
Water supply though house service connections 70 LPCD
2. For communities with 20,000 to 1,00,000 population
(with full flushing system)
100 to 150 LPCD
3. For communities with >1,00,000 population (with full
flushing system)
150 to 200 LPCD
Of the 150-200 LPCD 45 LPCD is meant for toilet flushing
For LIG (low income group) and EWS (economically weaker section) housing
water requirements are reduced to 135 LPCD
IS 1172 (1993, Reaffirmed 2007): Code of basic requirements for
water supply, drainage and sanitation (4th revision).
Typical domestic water demand in India: 135 LPCD
Bathing: 55 LPCD (20) Toilet flushing: 30 LPCD (40)
Cloths washing: 20 LPCD (25) Utensil washing: 10 LPCD (20)
Cooking and Drinking:10 LPCD (7) House washing/cleaning: 10 LPCD
Urban water requirements
(Outdoor uses, and uses like desert coolers not considered; Too much water
for bathing and relatively less water for toilet flushing and utensil cleaning)
1. Factories with bath room facilities 45 LPCD
Factories with no bathroom facilities 30 LPCD
2. Hospitals with <100 beds (including laundry facilities) 340 LPCD
Hospitals with >100 beds (including laundry facilities) 450 LPCD
Nurses’ homes and medical quarters 135 LPCD
3. Hostels 135 LPCD
Hotels 180 LPCD
Restaurants 70/seat
4. Offices 45 LPCD
5. Cinema houses, concert halls and theaters 15/seat
6. Day schools 45 LPCD
7. Boarding schools 135 LPCD
8. Railway (no express/mail stops), bus stations and sea ports* 45/25# LPCD
Junction railway stations & stations with express/mail stops* 70/45# LPCD
Terminal stations* 45/45# LPCD
9. Air ports (international and domestic)* 70/70# LPCD
* Average number of passengers handled and staff and vendors are considered
# Requirement for without bathing facilities
Commercial and institutional water requirements (IS 1172)
Fire Water Requirements
For cities/towns with population <1,00,000 3600 L/min/50,000
population for 2 hr duration
For cities with population 1,00,000 to
3,00,000
1800 L/min./50,000
population for 2 hr duration
For cities with population >3,00,000 1800 L/min./1,00,000
population for 2 hr duration
Sufficient fire water should be available within 1 Km2 area.
For civil defense towns/cities the fire water requirements are doubled.
High rise buildings areas should have at least one fire water tank of 220 m3
capacity in every 1 km2 area.
IS 9668 (1990, Reaffirmed 2010): Provision and maintenance of
water supplies for fire fighting – code of practice (1st revision).
High risk areas (bazars, commercial centers, high rise buildings,
warehouses, industrial complexes, etc.
Extra high risk areas (petrochemical complexes)
Kuiching’s formula for fire water
demand estimation in Indian cities
populationisP
minisQHere
P
Q .min/,
1000
128.3 3

Public use demand: 5% of the total consumption
Public parks: 1.4L/m2./day
Street washing/wetting): 1.0 to 1.5 L/m2/day
Sewer cleaning: 4.5 LPCD
Industrial water demand: 20-25% of the total city water demand
Allowances for leaks, wastes and thefts: 15%
Average Indian town water demands
Domestic: 135 LPCD – 50% (65-300: 160 – 35%)
Commercial, institutional and industrial: 40 LPCD – 15% (45-450: 135 – 30%)
Public use: 25 LPCD – 9% (20-90: 45 – 10%)
Fire demand: 15 LPCD – 6% (fire + public use)
Losses, Wastage and thefts: 55 LPCD – 20% (45-150: 62 – 25%)
Total: 270 LPCD (402 LPCD)
Other water requirements (IS 1172?)
Population Forecasting
• Population projections are needed at the end of the design
period and for the intermediary period (+15, +30 & +50 years)
• Area wise population projections may be needed
• Trends in population growth in the recent past become basis
for future population projections
• Population to be served depends on population influx and
outflux; birth and death rates; annexation of new areas
• Many methods can be used
– Graphical methods
– Sigmoid growth (logistic growth model)
– Arithmetical increase method
– Incremental increase method
– Geometrical increase method
– Decreasing rate of growth method
– Method of density
• Selection of the method of forecasting is very important
Sigmoid growth (logistic growth model)
• Gives complete trend of growth of the city right from the
beginning to saturation limit of population
Population forecasting
Geometrical increase method / uniform rate of increase method
– Applicable for growing towns with vast scope for expansion
– Assumes uniform rate of increase
– Find decadal rate of increase and obtain geometric mean
– Uniform rate of increase: take average decadal rate of increase
Population forecasting
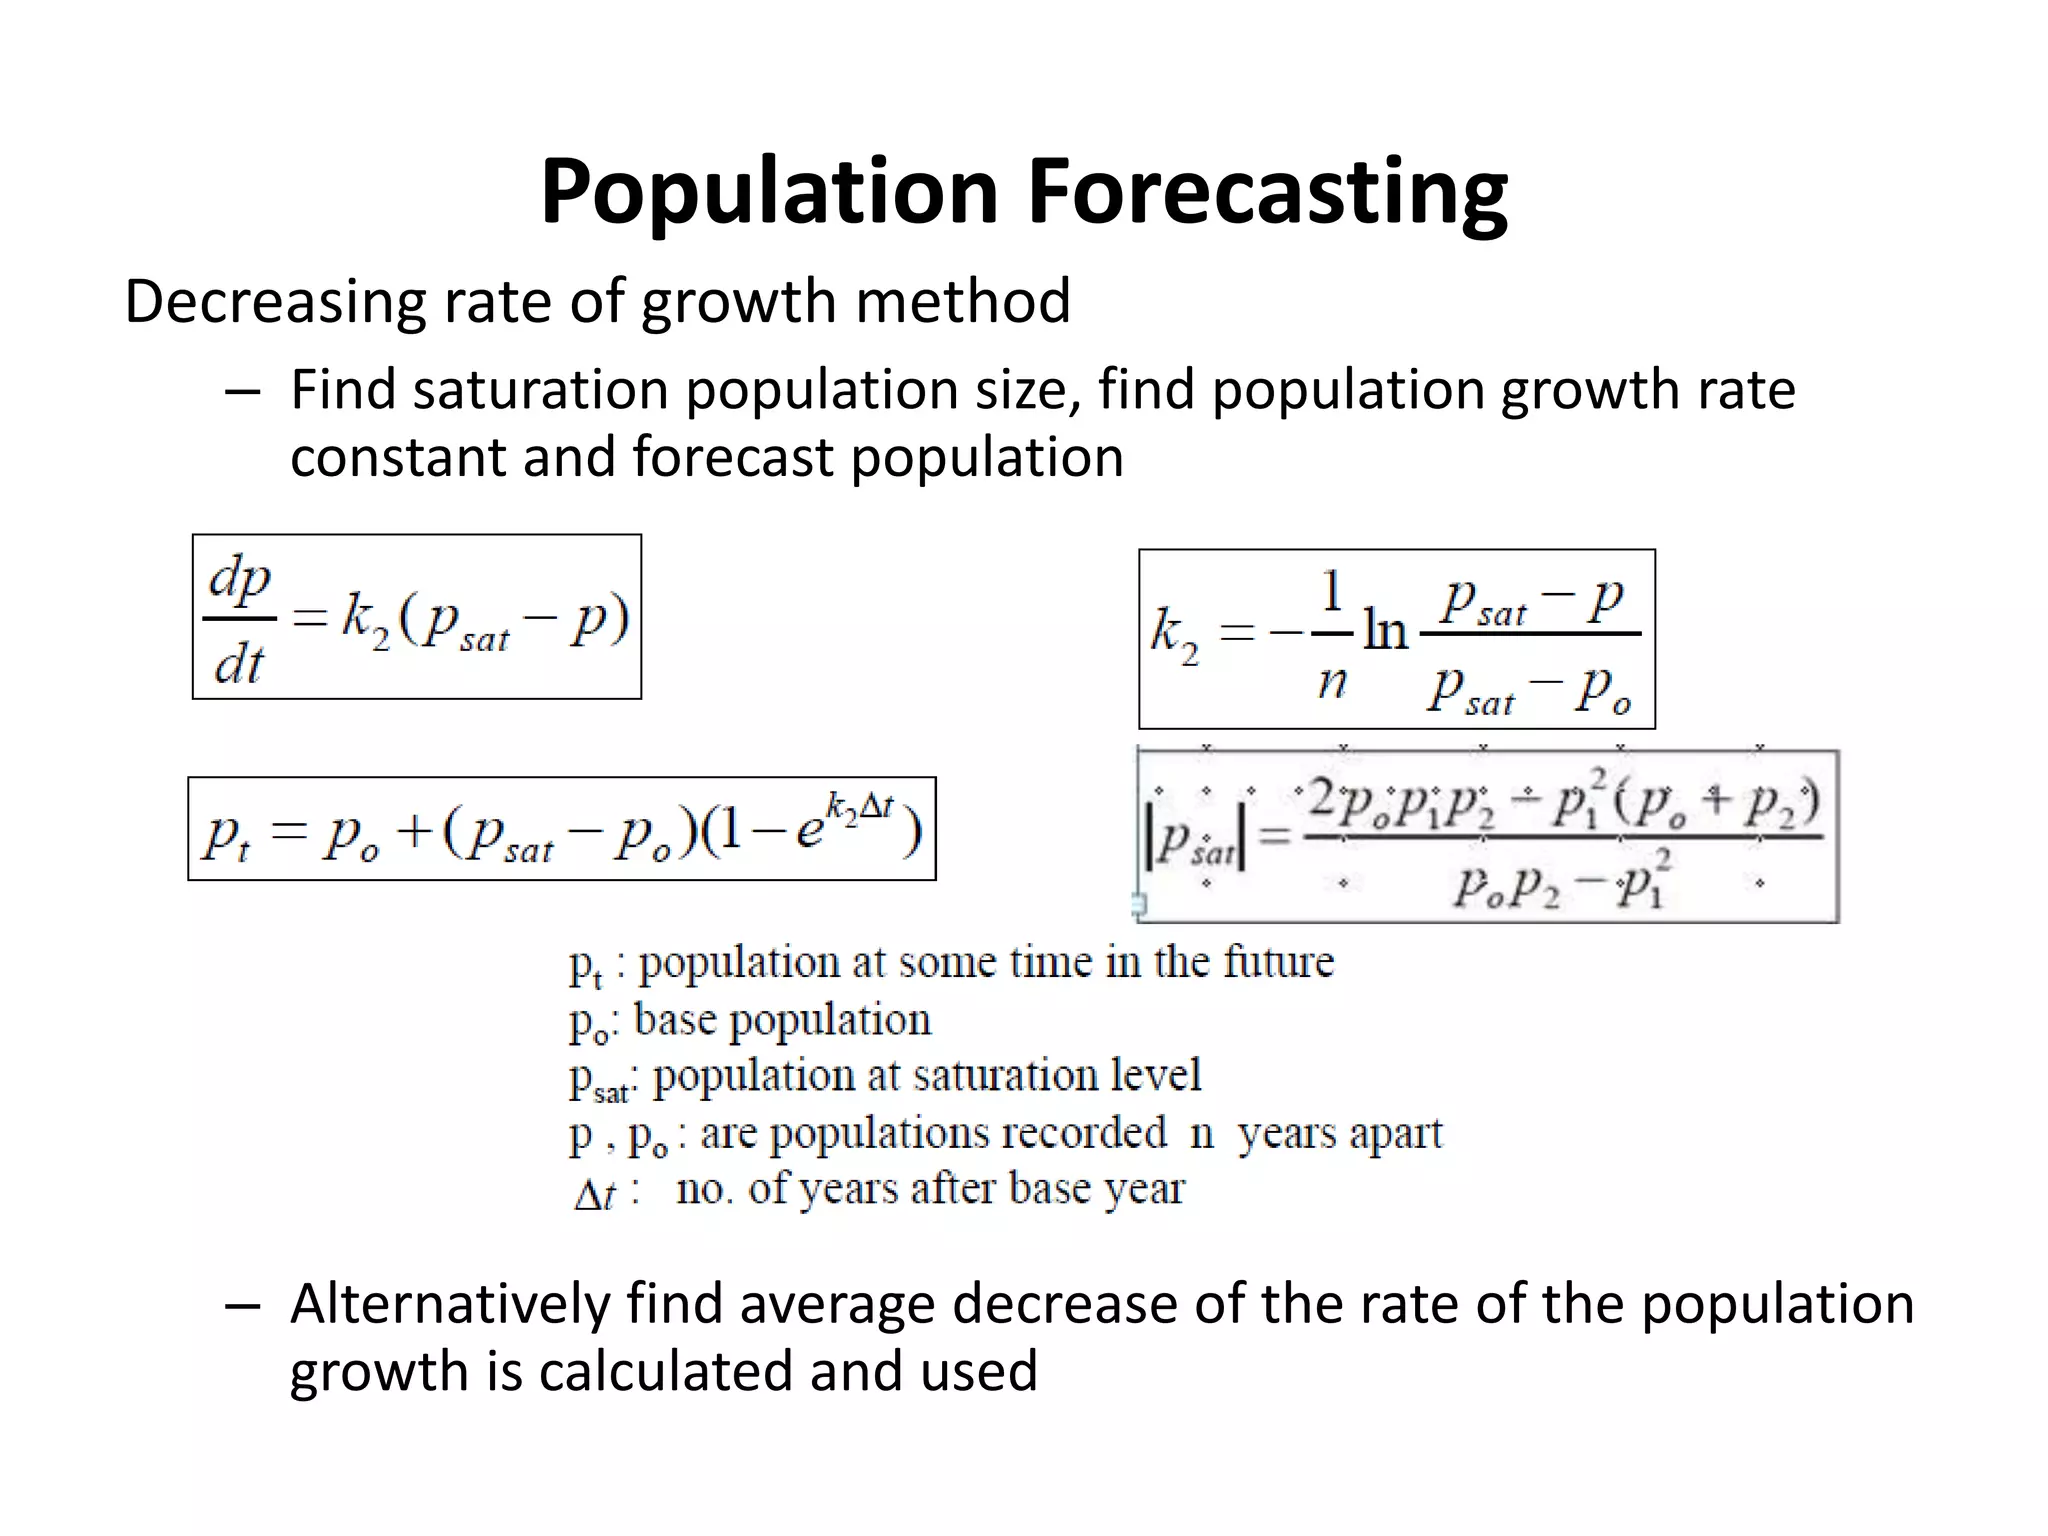
Decreasing rate of growth method
– Find saturation population size, find population growth rate
constant and forecast population
– Alternatively find average decrease of the rate of the population
growth is calculated and used
Population Forecasting
Arithmetical increase method
– Applicable to large old cities that achieved saturation conditions
and showing constant population growth rate
– Valid if approximately equal incremental increases have
occurred between recent censuses.
– Average increase of population per decade is calculated from
the past population records
Population Forecasting
Incremental increase method
• Increment in the arithmetical
increase is determined and
used
• Average of increase in
population is taken as per the
arithmetic method and to this,
average of the net incremental
increase (one for every future
decade) is added
• a progressive decrease in the
average increase can also be
adopted
 
2
1
030
Ynn
nXPP


‘n’ is number of decades
‘X’ average arithmetic increase
‘Y’ is average incremental increase
Graphical method
The city in question considered
The cities similar are taken into
consideration
Population Forecasting
Water Demand Assessment
Area/sector/zone wise demand assessments needed
Average Day Demand (ADD), Maximum Day Demand MDD) and
Peak Hour Demand (PHD) needed
Can be done from the forecasted population, per capita water
consumption and service factor values
Wdn = (Pn x C x F ) + Dn
Wdn = water demand at the end of year “n”
Pn = projected population at the end of year “n”
C = per capita consumption at the end of year “n”
F = service factor at the end of year “n” (population fraction served)
Dn = additional demand at the end of year “n”
– Knowing per capita water demand is a problem
– Only domestic demands (commercial and institutional
demands!) assessed – assessment of Dn is a problem
Demographic data, stock data and end use data all influence the
water demand – technology influences
Water Demand Assessment
Clearly delineate the service area
– Current service area and proposed expansion of the service area
are shown on a map
Make population projections
– Subtract the population that will not be served (other on-site
sources of water – rainwater, borewell water may be used)
Find current per capita water use
– Historical data may be used ( preferably of last 5 years)
Find per capita water use to be used in the assessment
– Make conservation corrections to per capita water use
– Make adjustments to the unaccounted for water (UFW)
Consider large independent users (industrial, institutional and
commercial users) separately
– Population equivalents or equivalent residential units
Make water demand assessments
Water Demands
The demand assessment should include
• Residential, Commercial, Institutional and industrial demands
• Public water, ecological water and other special water demands
• Fire fighting demand
• Unaccounted for water (wastage, leakage, illegal taping, damaged
meters)

More Related Content

What's hot

L 3 and l-4 water demand
L 3  and l-4 water demandL 3  and l-4 water demand
L 3 and l-4 water demand
Dr. shrikant jahagirdar
 
Water demand and factor affecting water demand
Water demand and factor affecting water demandWater demand and factor affecting water demand
Water demand and factor affecting water demandAnkit Gola
 
Quality &amp; quantity of water
Quality &amp; quantity of waterQuality &amp; quantity of water
Quality &amp; quantity of water
dhara dattani
 
Introduction to water supply engg. by Prof. D S.Shah
Introduction to water supply engg. by Prof. D S.ShahIntroduction to water supply engg. by Prof. D S.Shah
Introduction to water supply engg. by Prof. D S.Shah
dhavalsshah
 
Planning and management of water
Planning and management of waterPlanning and management of water
Planning and management of water
Siddhi Vakharia
 
P.P.T on water distribution system by Manish Pandey
P.P.T on water distribution system by Manish PandeyP.P.T on water distribution system by Manish Pandey
P.P.T on water distribution system by Manish Pandey
Manish Pandey
 
Water supply system
Water supply systemWater supply system
Water supply system
aishah
 
Environmental Engineering-I
Environmental Engineering-IEnvironmental Engineering-I
Environmental Engineering-I
GAURAV. H .TANDON
 
Sources of water
Sources of waterSources of water
Sources of water
Muhammad Nouman
 
SEWERAGE SYSTEMS ppt by mayank oza
SEWERAGE SYSTEMS ppt by mayank ozaSEWERAGE SYSTEMS ppt by mayank oza
SEWERAGE SYSTEMS ppt by mayank oza
Mayank Oza
 
Design of sewerage system
Design of sewerage systemDesign of sewerage system
Design of sewerage system
Manoj Mota
 
Quantity of Water
Quantity of WaterQuantity of Water
Quantity of Water
ChandanGupta201
 
Storm water drainage
Storm water drainageStorm water drainage
Storm water drainage
Avneet Dhillon
 
Hydraulic design of sewer
Hydraulic design of sewerHydraulic design of sewer
Hydraulic design of sewer
Bibhabasu Mohanty
 
Water demand
Water demandWater demand
Water demand
Mood Naik
 
Intake structures-Introduction
Intake structures-IntroductionIntake structures-Introduction
Intake structures-Introduction
Deepak Paithankar
 
Design of sewers
Design of sewersDesign of sewers
Design of sewers
AnkitTurambekar
 
Storage and distribution reservoirs
Storage and distribution reservoirsStorage and distribution reservoirs
Storage and distribution reservoirs
farooq husain
 
Water Requirements
Water RequirementsWater Requirements
Water Requirements
GAURAV. H .TANDON
 
Sewerage System
Sewerage SystemSewerage System
Sewerage System
Akepati S. Reddy
 

What's hot (20)

L 3 and l-4 water demand
L 3  and l-4 water demandL 3  and l-4 water demand
L 3 and l-4 water demand
 
Water demand and factor affecting water demand
Water demand and factor affecting water demandWater demand and factor affecting water demand
Water demand and factor affecting water demand
 
Quality &amp; quantity of water
Quality &amp; quantity of waterQuality &amp; quantity of water
Quality &amp; quantity of water
 
Introduction to water supply engg. by Prof. D S.Shah
Introduction to water supply engg. by Prof. D S.ShahIntroduction to water supply engg. by Prof. D S.Shah
Introduction to water supply engg. by Prof. D S.Shah
 
Planning and management of water
Planning and management of waterPlanning and management of water
Planning and management of water
 
P.P.T on water distribution system by Manish Pandey
P.P.T on water distribution system by Manish PandeyP.P.T on water distribution system by Manish Pandey
P.P.T on water distribution system by Manish Pandey
 
Water supply system
Water supply systemWater supply system
Water supply system
 
Environmental Engineering-I
Environmental Engineering-IEnvironmental Engineering-I
Environmental Engineering-I
 
Sources of water
Sources of waterSources of water
Sources of water
 
SEWERAGE SYSTEMS ppt by mayank oza
SEWERAGE SYSTEMS ppt by mayank ozaSEWERAGE SYSTEMS ppt by mayank oza
SEWERAGE SYSTEMS ppt by mayank oza
 
Design of sewerage system
Design of sewerage systemDesign of sewerage system
Design of sewerage system
 
Quantity of Water
Quantity of WaterQuantity of Water
Quantity of Water
 
Storm water drainage
Storm water drainageStorm water drainage
Storm water drainage
 
Hydraulic design of sewer
Hydraulic design of sewerHydraulic design of sewer
Hydraulic design of sewer
 
Water demand
Water demandWater demand
Water demand
 
Intake structures-Introduction
Intake structures-IntroductionIntake structures-Introduction
Intake structures-Introduction
 
Design of sewers
Design of sewersDesign of sewers
Design of sewers
 
Storage and distribution reservoirs
Storage and distribution reservoirsStorage and distribution reservoirs
Storage and distribution reservoirs
 
Water Requirements
Water RequirementsWater Requirements
Water Requirements
 
Sewerage System
Sewerage SystemSewerage System
Sewerage System
 

Similar to 02 water demand

Lec 2.pptx
Lec 2.pptxLec 2.pptx
Lec 2.pptx
mrunmayee20
 
03 Water Demand
03 Water Demand03 Water Demand
03 Water Demand
akashpadole
 
Water Supply & Urban Drainage.pptx
Water Supply & Urban Drainage.pptxWater Supply & Urban Drainage.pptx
Water Supply & Urban Drainage.pptx
Yalelet Abera
 
EE Module 1 (2).pptx
EE Module 1 (2).pptxEE Module 1 (2).pptx
EE Module 1 (2).pptx
HarshKumarEname
 
water quality, water demands
water quality, water demandswater quality, water demands
water quality, water demands
Mir Zafarullah
 
Quality and quantity of water m1
Quality and quantity of water m1Quality and quantity of water m1
Quality and quantity of water m1
Bibhabasu Mohanty
 
Sources, intake structures and water demand in Water Supply Schemes
  Sources, intake structures and water demand in Water Supply Schemes   Sources, intake structures and water demand in Water Supply Schemes
Sources, intake structures and water demand in Water Supply Schemes
Vaibhav Kambale
 
UNIT -I Introduction to water supply scheme.ppt
UNIT -I Introduction to water supply scheme.pptUNIT -I Introduction to water supply scheme.ppt
UNIT -I Introduction to water supply scheme.ppt
madhukarjadhav10
 
Water requirements
Water requirementsWater requirements
Water requirements
Namrata Ghosh
 
L 4 wastewater flow rates
L 4 wastewater flow ratesL 4 wastewater flow rates
L 4 wastewater flow rates
Dr. shrikant jahagirdar
 
water supply and treatment introductions
water supply and treatment introductionswater supply and treatment introductions
water supply and treatment introductions
mentwabeasiratu21
 
L1 - Introduction.ppt
L1 - Introduction.pptL1 - Introduction.ppt
L1 - Introduction.ppt
PRACHI DESSAI
 
Udpfistandards
UdpfistandardsUdpfistandards
Udpfistandards
chaitali shroff
 
Quantity of water-1.pdf
Quantity of water-1.pdfQuantity of water-1.pdf
Quantity of water-1.pdf
SunilJangra29
 
Quantity of Water.pptx
Quantity of Water.pptxQuantity of Water.pptx
Quantity of Water.pptx
PriyaTalwar8
 
Water resource treatment
Water resource treatmentWater resource treatment
Water resource treatment
Aishwaryap32
 
Water Supply and Treatment Engineering- Module 1
Water Supply and Treatment Engineering- Module 1Water Supply and Treatment Engineering- Module 1
Water Supply and Treatment Engineering- Module 1
Mujeeb Muji
 
unit 1 EEppc
unit 1 EEppc unit 1 EEppc
unit 1 EEppc
GokulKannan194051
 
Che 2 quantity &amp; quality of water
Che 2 quantity &amp; quality of waterChe 2 quantity &amp; quality of water
Che 2 quantity &amp; quality of water
Shree Swami atmanand saraswati inst. of technology, surat
 
Enzotech presentation May 2013
Enzotech presentation May 2013Enzotech presentation May 2013
Enzotech presentation May 2013enzotechslides
 

Similar to 02 water demand (20)

Lec 2.pptx
Lec 2.pptxLec 2.pptx
Lec 2.pptx
 
03 Water Demand
03 Water Demand03 Water Demand
03 Water Demand
 
Water Supply & Urban Drainage.pptx
Water Supply & Urban Drainage.pptxWater Supply & Urban Drainage.pptx
Water Supply & Urban Drainage.pptx
 
EE Module 1 (2).pptx
EE Module 1 (2).pptxEE Module 1 (2).pptx
EE Module 1 (2).pptx
 
water quality, water demands
water quality, water demandswater quality, water demands
water quality, water demands
 
Quality and quantity of water m1
Quality and quantity of water m1Quality and quantity of water m1
Quality and quantity of water m1
 
Sources, intake structures and water demand in Water Supply Schemes
  Sources, intake structures and water demand in Water Supply Schemes   Sources, intake structures and water demand in Water Supply Schemes
Sources, intake structures and water demand in Water Supply Schemes
 
UNIT -I Introduction to water supply scheme.ppt
UNIT -I Introduction to water supply scheme.pptUNIT -I Introduction to water supply scheme.ppt
UNIT -I Introduction to water supply scheme.ppt
 
Water requirements
Water requirementsWater requirements
Water requirements
 
L 4 wastewater flow rates
L 4 wastewater flow ratesL 4 wastewater flow rates
L 4 wastewater flow rates
 
water supply and treatment introductions
water supply and treatment introductionswater supply and treatment introductions
water supply and treatment introductions
 
L1 - Introduction.ppt
L1 - Introduction.pptL1 - Introduction.ppt
L1 - Introduction.ppt
 
Udpfistandards
UdpfistandardsUdpfistandards
Udpfistandards
 
Quantity of water-1.pdf
Quantity of water-1.pdfQuantity of water-1.pdf
Quantity of water-1.pdf
 
Quantity of Water.pptx
Quantity of Water.pptxQuantity of Water.pptx
Quantity of Water.pptx
 
Water resource treatment
Water resource treatmentWater resource treatment
Water resource treatment
 
Water Supply and Treatment Engineering- Module 1
Water Supply and Treatment Engineering- Module 1Water Supply and Treatment Engineering- Module 1
Water Supply and Treatment Engineering- Module 1
 
unit 1 EEppc
unit 1 EEppc unit 1 EEppc
unit 1 EEppc
 
Che 2 quantity &amp; quality of water
Che 2 quantity &amp; quality of waterChe 2 quantity &amp; quality of water
Che 2 quantity &amp; quality of water
 
Enzotech presentation May 2013
Enzotech presentation May 2013Enzotech presentation May 2013
Enzotech presentation May 2013
 

More from Akepati S. Reddy

PH,acidity and alkanity
PH,acidity and alkanityPH,acidity and alkanity
PH,acidity and alkanity
Akepati S. Reddy
 
Td sand tss
Td sand tssTd sand tss
Td sand tss
Akepati S. Reddy
 
Asr wastewater characteristics
Asr wastewater characteristicsAsr wastewater characteristics
Asr wastewater characteristics
Akepati S. Reddy
 
Asr flow measurement
Asr  flow measurementAsr  flow measurement
Asr flow measurement
Akepati S. Reddy
 
Asr= nutrients
Asr= nutrientsAsr= nutrients
Asr= nutrients
Akepati S. Reddy
 
Asr mp ntest
Asr mp ntestAsr mp ntest
Asr mp ntest
Akepati S. Reddy
 
02b priliminary treatment
02b priliminary treatment02b priliminary treatment
02b priliminary treatment
Akepati S. Reddy
 
02d secondary treatment
02d secondary treatment02d secondary treatment
02d secondary treatment
Akepati S. Reddy
 
Wastewater characteristics
Wastewater characteristicsWastewater characteristics
Wastewater characteristics
Akepati S. Reddy
 
Chapter2activestudge process
Chapter2activestudge processChapter2activestudge process
Chapter2activestudge process
Akepati S. Reddy
 
acticated sluge process
acticated sluge processacticated sluge process
acticated sluge process
Akepati S. Reddy
 
Regulatory Requirements of Solid Waste Management, Indian Context
Regulatory Requirements of Solid Waste Management, Indian ContextRegulatory Requirements of Solid Waste Management, Indian Context
Regulatory Requirements of Solid Waste Management, Indian Context
Akepati S. Reddy
 
Solid waste biomethanation plants
Solid waste biomethanation plantsSolid waste biomethanation plants
Solid waste biomethanation plants
Akepati S. Reddy
 
Atmospheric Pressure and Winds
Atmospheric Pressure and WindsAtmospheric Pressure and Winds
Atmospheric Pressure and Winds
Akepati S. Reddy
 
Atmospheric Water
Atmospheric WaterAtmospheric Water
Atmospheric Water
Akepati S. Reddy
 
Atmosphere: Composition and Strucutre
Atmosphere: Composition and StrucutreAtmosphere: Composition and Strucutre
Atmosphere: Composition and Strucutre
Akepati S. Reddy
 
Radiation and atmospheric temperature
Radiation and atmospheric temperatureRadiation and atmospheric temperature
Radiation and atmospheric temperature
Akepati S. Reddy
 
Biological n and p removal
Biological n and p removalBiological n and p removal
Biological n and p removal
Akepati S. Reddy
 
Aerobic attached growth systems
Aerobic attached growth systemsAerobic attached growth systems
Aerobic attached growth systems
Akepati S. Reddy
 
Biological sludge digestion
Biological sludge digestionBiological sludge digestion
Biological sludge digestion
Akepati S. Reddy
 

More from Akepati S. Reddy (20)

PH,acidity and alkanity
PH,acidity and alkanityPH,acidity and alkanity
PH,acidity and alkanity
 
Td sand tss
Td sand tssTd sand tss
Td sand tss
 
Asr wastewater characteristics
Asr wastewater characteristicsAsr wastewater characteristics
Asr wastewater characteristics
 
Asr flow measurement
Asr  flow measurementAsr  flow measurement
Asr flow measurement
 
Asr= nutrients
Asr= nutrientsAsr= nutrients
Asr= nutrients
 
Asr mp ntest
Asr mp ntestAsr mp ntest
Asr mp ntest
 
02b priliminary treatment
02b priliminary treatment02b priliminary treatment
02b priliminary treatment
 
02d secondary treatment
02d secondary treatment02d secondary treatment
02d secondary treatment
 
Wastewater characteristics
Wastewater characteristicsWastewater characteristics
Wastewater characteristics
 
Chapter2activestudge process
Chapter2activestudge processChapter2activestudge process
Chapter2activestudge process
 
acticated sluge process
acticated sluge processacticated sluge process
acticated sluge process
 
Regulatory Requirements of Solid Waste Management, Indian Context
Regulatory Requirements of Solid Waste Management, Indian ContextRegulatory Requirements of Solid Waste Management, Indian Context
Regulatory Requirements of Solid Waste Management, Indian Context
 
Solid waste biomethanation plants
Solid waste biomethanation plantsSolid waste biomethanation plants
Solid waste biomethanation plants
 
Atmospheric Pressure and Winds
Atmospheric Pressure and WindsAtmospheric Pressure and Winds
Atmospheric Pressure and Winds
 
Atmospheric Water
Atmospheric WaterAtmospheric Water
Atmospheric Water
 
Atmosphere: Composition and Strucutre
Atmosphere: Composition and StrucutreAtmosphere: Composition and Strucutre
Atmosphere: Composition and Strucutre
 
Radiation and atmospheric temperature
Radiation and atmospheric temperatureRadiation and atmospheric temperature
Radiation and atmospheric temperature
 
Biological n and p removal
Biological n and p removalBiological n and p removal
Biological n and p removal
 
Aerobic attached growth systems
Aerobic attached growth systemsAerobic attached growth systems
Aerobic attached growth systems
 
Biological sludge digestion
Biological sludge digestionBiological sludge digestion
Biological sludge digestion
 

Recently uploaded

Sustainable farming practices in India .pptx
Sustainable farming  practices in India .pptxSustainable farming  practices in India .pptx
Sustainable farming practices in India .pptx
chaitaliambole
 
Summary of the Climate and Energy Policy of Australia
Summary of the Climate and Energy Policy of AustraliaSummary of the Climate and Energy Policy of Australia
Summary of the Climate and Energy Policy of Australia
yasmindemoraes1
 
Characterization and the Kinetics of drying at the drying oven and with micro...
Characterization and the Kinetics of drying at the drying oven and with micro...Characterization and the Kinetics of drying at the drying oven and with micro...
Characterization and the Kinetics of drying at the drying oven and with micro...
Open Access Research Paper
 
Celebrating World-environment-day-2024.pdf
Celebrating  World-environment-day-2024.pdfCelebrating  World-environment-day-2024.pdf
Celebrating World-environment-day-2024.pdf
rohankumarsinghrore1
 
Navigating the complex landscape of AI governance
Navigating the complex landscape of AI governanceNavigating the complex landscape of AI governance
Navigating the complex landscape of AI governance
Piermenotti Mauro
 
Natural farming @ Dr. Siddhartha S. Jena.pptx
Natural farming @ Dr. Siddhartha S. Jena.pptxNatural farming @ Dr. Siddhartha S. Jena.pptx
Natural farming @ Dr. Siddhartha S. Jena.pptx
sidjena70
 
DRAFT NRW Recreation Strategy - People and Nature thriving together
DRAFT NRW Recreation Strategy - People and Nature thriving togetherDRAFT NRW Recreation Strategy - People and Nature thriving together
DRAFT NRW Recreation Strategy - People and Nature thriving together
Robin Grant
 
growbilliontrees.com-Trees for Granddaughter (1).pdf
growbilliontrees.com-Trees for Granddaughter (1).pdfgrowbilliontrees.com-Trees for Granddaughter (1).pdf
growbilliontrees.com-Trees for Granddaughter (1).pdf
yadavakashagra
 
"Understanding the Carbon Cycle: Processes, Human Impacts, and Strategies for...
"Understanding the Carbon Cycle: Processes, Human Impacts, and Strategies for..."Understanding the Carbon Cycle: Processes, Human Impacts, and Strategies for...
"Understanding the Carbon Cycle: Processes, Human Impacts, and Strategies for...
MMariSelvam4
 
Daan Park Hydrangea flower season I like it
Daan Park Hydrangea flower season I like itDaan Park Hydrangea flower season I like it
Daan Park Hydrangea flower season I like it
a0966109726
 
Artificial Reefs by Kuddle Life Foundation - May 2024
Artificial Reefs by Kuddle Life Foundation - May 2024Artificial Reefs by Kuddle Life Foundation - May 2024
Artificial Reefs by Kuddle Life Foundation - May 2024
punit537210
 
Environmental Science Book By Dr. Y.K. Singh
Environmental Science Book By Dr. Y.K. SinghEnvironmental Science Book By Dr. Y.K. Singh
Environmental Science Book By Dr. Y.K. Singh
AhmadKhan917612
 
Bhopal Gas Leak Tragedy - A Night of death
Bhopal Gas Leak Tragedy - A Night of deathBhopal Gas Leak Tragedy - A Night of death
Bhopal Gas Leak Tragedy - A Night of death
upasana742003
 
International+e-Commerce+Platform-www.cfye-commerce.shop
International+e-Commerce+Platform-www.cfye-commerce.shopInternational+e-Commerce+Platform-www.cfye-commerce.shop
International+e-Commerce+Platform-www.cfye-commerce.shop
laozhuseo02
 
NRW Board Paper - DRAFT NRW Recreation Strategy
NRW Board Paper - DRAFT NRW Recreation StrategyNRW Board Paper - DRAFT NRW Recreation Strategy
NRW Board Paper - DRAFT NRW Recreation Strategy
Robin Grant
 
IPCC Vice Chair Ladislaus Change Central Asia Climate Change Conference 27 Ma...
IPCC Vice Chair Ladislaus Change Central Asia Climate Change Conference 27 Ma...IPCC Vice Chair Ladislaus Change Central Asia Climate Change Conference 27 Ma...
IPCC Vice Chair Ladislaus Change Central Asia Climate Change Conference 27 Ma...
ipcc-media
 
Q&A with the Experts: The Food Service Playbook
Q&A with the Experts: The Food Service PlaybookQ&A with the Experts: The Food Service Playbook
Q&A with the Experts: The Food Service Playbook
World Resources Institute (WRI)
 
Presentación Giulio Quaggiotto-Diálogo improbable .pptx.pdf
Presentación Giulio Quaggiotto-Diálogo improbable .pptx.pdfPresentación Giulio Quaggiotto-Diálogo improbable .pptx.pdf
Presentación Giulio Quaggiotto-Diálogo improbable .pptx.pdf
Innovation and Technology for Development Centre
 
Prevalence, biochemical and hematological study of diabetic patients
Prevalence, biochemical and hematological study of diabetic patientsPrevalence, biochemical and hematological study of diabetic patients
Prevalence, biochemical and hematological study of diabetic patients
Open Access Research Paper
 
Willie Nelson Net Worth: A Journey Through Music, Movies, and Business Ventures
Willie Nelson Net Worth: A Journey Through Music, Movies, and Business VenturesWillie Nelson Net Worth: A Journey Through Music, Movies, and Business Ventures
Willie Nelson Net Worth: A Journey Through Music, Movies, and Business Ventures
greendigital
 

Recently uploaded (20)

Sustainable farming practices in India .pptx
Sustainable farming  practices in India .pptxSustainable farming  practices in India .pptx
Sustainable farming practices in India .pptx
 
Summary of the Climate and Energy Policy of Australia
Summary of the Climate and Energy Policy of AustraliaSummary of the Climate and Energy Policy of Australia
Summary of the Climate and Energy Policy of Australia
 
Characterization and the Kinetics of drying at the drying oven and with micro...
Characterization and the Kinetics of drying at the drying oven and with micro...Characterization and the Kinetics of drying at the drying oven and with micro...
Characterization and the Kinetics of drying at the drying oven and with micro...
 
Celebrating World-environment-day-2024.pdf
Celebrating  World-environment-day-2024.pdfCelebrating  World-environment-day-2024.pdf
Celebrating World-environment-day-2024.pdf
 
Navigating the complex landscape of AI governance
Navigating the complex landscape of AI governanceNavigating the complex landscape of AI governance
Navigating the complex landscape of AI governance
 
Natural farming @ Dr. Siddhartha S. Jena.pptx
Natural farming @ Dr. Siddhartha S. Jena.pptxNatural farming @ Dr. Siddhartha S. Jena.pptx
Natural farming @ Dr. Siddhartha S. Jena.pptx
 
DRAFT NRW Recreation Strategy - People and Nature thriving together
DRAFT NRW Recreation Strategy - People and Nature thriving togetherDRAFT NRW Recreation Strategy - People and Nature thriving together
DRAFT NRW Recreation Strategy - People and Nature thriving together
 
growbilliontrees.com-Trees for Granddaughter (1).pdf
growbilliontrees.com-Trees for Granddaughter (1).pdfgrowbilliontrees.com-Trees for Granddaughter (1).pdf
growbilliontrees.com-Trees for Granddaughter (1).pdf
 
"Understanding the Carbon Cycle: Processes, Human Impacts, and Strategies for...
"Understanding the Carbon Cycle: Processes, Human Impacts, and Strategies for..."Understanding the Carbon Cycle: Processes, Human Impacts, and Strategies for...
"Understanding the Carbon Cycle: Processes, Human Impacts, and Strategies for...
 
Daan Park Hydrangea flower season I like it
Daan Park Hydrangea flower season I like itDaan Park Hydrangea flower season I like it
Daan Park Hydrangea flower season I like it
 
Artificial Reefs by Kuddle Life Foundation - May 2024
Artificial Reefs by Kuddle Life Foundation - May 2024Artificial Reefs by Kuddle Life Foundation - May 2024
Artificial Reefs by Kuddle Life Foundation - May 2024
 
Environmental Science Book By Dr. Y.K. Singh
Environmental Science Book By Dr. Y.K. SinghEnvironmental Science Book By Dr. Y.K. Singh
Environmental Science Book By Dr. Y.K. Singh
 
Bhopal Gas Leak Tragedy - A Night of death
Bhopal Gas Leak Tragedy - A Night of deathBhopal Gas Leak Tragedy - A Night of death
Bhopal Gas Leak Tragedy - A Night of death
 
International+e-Commerce+Platform-www.cfye-commerce.shop
International+e-Commerce+Platform-www.cfye-commerce.shopInternational+e-Commerce+Platform-www.cfye-commerce.shop
International+e-Commerce+Platform-www.cfye-commerce.shop
 
NRW Board Paper - DRAFT NRW Recreation Strategy
NRW Board Paper - DRAFT NRW Recreation StrategyNRW Board Paper - DRAFT NRW Recreation Strategy
NRW Board Paper - DRAFT NRW Recreation Strategy
 
IPCC Vice Chair Ladislaus Change Central Asia Climate Change Conference 27 Ma...
IPCC Vice Chair Ladislaus Change Central Asia Climate Change Conference 27 Ma...IPCC Vice Chair Ladislaus Change Central Asia Climate Change Conference 27 Ma...
IPCC Vice Chair Ladislaus Change Central Asia Climate Change Conference 27 Ma...
 
Q&A with the Experts: The Food Service Playbook
Q&A with the Experts: The Food Service PlaybookQ&A with the Experts: The Food Service Playbook
Q&A with the Experts: The Food Service Playbook
 
Presentación Giulio Quaggiotto-Diálogo improbable .pptx.pdf
Presentación Giulio Quaggiotto-Diálogo improbable .pptx.pdfPresentación Giulio Quaggiotto-Diálogo improbable .pptx.pdf
Presentación Giulio Quaggiotto-Diálogo improbable .pptx.pdf
 
Prevalence, biochemical and hematological study of diabetic patients
Prevalence, biochemical and hematological study of diabetic patientsPrevalence, biochemical and hematological study of diabetic patients
Prevalence, biochemical and hematological study of diabetic patients
 
Willie Nelson Net Worth: A Journey Through Music, Movies, and Business Ventures
Willie Nelson Net Worth: A Journey Through Music, Movies, and Business VenturesWillie Nelson Net Worth: A Journey Through Music, Movies, and Business Ventures
Willie Nelson Net Worth: A Journey Through Music, Movies, and Business Ventures
 

02 water demand

  • 2. Water Demand • Designed capacity of the water supply system (WSS) – Meeting water demands at the end of the design period – Design period: service life of different components of a water supply system (varies from 15 years to 100 years) • Water demands at the end of the design periods are basis for the water supply systems design – Water demands at each of the supply nodes may be needed • Average Day Demand (ADD); Maximum Day Demand (MDD); and Peak Hour Demand (PHD) are actually required – ADD is annual water consumption divided by 365 days – MDD is taken as 1.8 times the ADD – PHD is taken as (1.5/24) MDD (distribution pumps, reservoirs and system are designed for the PHD) • Water demand = (Per capita demand)EDP x (Population)EDP • Using urban population history, (Population)EDP is forecasted
  • 3. Design Period • Usually taken as 30 years after completion of the project – 50 years for certain components and 15 years for certain other components – Time lag between design and completion of project can be 2 to 5 years • Future expansion and duplication provisions can be incorporated into the project • Water supply should match with water demand at the end of design period – Water requirements at the end of the design period should be known – Requires population and its spatial distribution at the end of the design period. • Commercial, institutional and industrial development patterns of the city should be known • Life styles and Improvements in living standards affect the water demands • Water conservation measures (source minimization and recycling and reuse of treated effluents) minimize water demands
  • 4.
  • 5.
  • 6. Per capita water demand • Diverse urban water demands need expression as per capita water demands – Residential, commercial, institutional, industrial, public & ecological, and fire water (and unaccounted for water!) • Assorting the water demands between the duel water supply systems may also be needed – Virgin water supply systems – Reclaimed and local water supply systems • Per capita water demand is dynamic and changing – Currently increasing but may show a decreasing trend in future • Per capita demand varies widely among the urban population, and average per capita demand must be considered • Water demands are also influenced by – Water availability and supplies – Water costs and water charging – Water conservation measures
  • 7. Water demands of urban population • Residential water demands – Indoor uses: Toilet flushing, Bathing, Washing clothes, Kitchens (cooking and drinking), Wash basins (miscellaneous washing), Desert coolers and Miscellaneous (house cleaning!) uses. – Outdoor uses: Kitchen gardening and irrigation of lawns and hedges; Car wash and vehicle cleaning; Yard/road wetting, etc. • Commercial and institutional water demands – Shops, molls and markets – Food joints, restaurants and hotels – Clinics, nursing homes, health centers and hospitals – Cinema houses, concert halls and theaters – Temples and other religious places – Schools, colleges, institutions and universities – Offices and administrative buildings – Railway stations, bus stations, air ports and sea ports
  • 8. Water demands of urban population • Industrial water demands (including animal keeping) – Number, type and size of industries and their water intensities • Public and ecological water demands – Public taps – Public urinals and community toilets – Swimming pools and community baths – Street washing/wetting – Sewer flushing – Irrigation of public parks and gardens – Public fountains • Fire water • Unaccounted for water – Leaks – Wastage of water – Unauthorized and illegal connections
  • 9. Factors affecting per capita water demands • Size of the city: – Demand increases with size – Fluctuations in demand are larger with lower population size • Climate conditions (temperature, precipitation, wind) and season – Water demands peak during summer months – Fire demands are higher in summers (hourly demands increase) • Commercial, institutional and industrial development and activities • Population density and urban landscaping: Public and ecological uses of water are influenced. • Housing: Slums, independent houses and multistoried buildings; Ground floor dwellings or dwellings in the other floors; Per capita floor area and plot area. • Income groups (low, middle and high income groups, and EWS) and Standard of living – High income households consume 250-400 LPCD – For EWS (economically weaker sections) 135 LPCD requirement – Some households consume as low as 40 LPCD water
  • 10. Factors affecting per capita water demands • Social and cultural conditions and life styles: Habits, social status, and customs of people • Time of the day and day of the week – Normal days, weekend days, and festive days or special days – Most of the day’s water is consumed between 6 – 10 AM and between 4 – 8 PM (demand for the rest 16 hrs is negligible) • Quality, quantity and availability of water – Reliability of water supply – Water supply patterns (continuous and intermittent supplies) – Water pressure in the water distribution system (Increasing pressure increases wastage and leaks) – Water metering and charging • Water conservation measures – Use of water efficient taps, showers, washing machines, toilet flushes, garden hoses, etc.
  • 11. 1. For communities of <20,000 population Water supply through stand posts 40 LPCD Water supply though house service connections 70 LPCD 2. For communities with 20,000 to 1,00,000 population (with full flushing system) 100 to 150 LPCD 3. For communities with >1,00,000 population (with full flushing system) 150 to 200 LPCD Of the 150-200 LPCD 45 LPCD is meant for toilet flushing For LIG (low income group) and EWS (economically weaker section) housing water requirements are reduced to 135 LPCD IS 1172 (1993, Reaffirmed 2007): Code of basic requirements for water supply, drainage and sanitation (4th revision). Typical domestic water demand in India: 135 LPCD Bathing: 55 LPCD (20) Toilet flushing: 30 LPCD (40) Cloths washing: 20 LPCD (25) Utensil washing: 10 LPCD (20) Cooking and Drinking:10 LPCD (7) House washing/cleaning: 10 LPCD Urban water requirements (Outdoor uses, and uses like desert coolers not considered; Too much water for bathing and relatively less water for toilet flushing and utensil cleaning)
  • 12. 1. Factories with bath room facilities 45 LPCD Factories with no bathroom facilities 30 LPCD 2. Hospitals with <100 beds (including laundry facilities) 340 LPCD Hospitals with >100 beds (including laundry facilities) 450 LPCD Nurses’ homes and medical quarters 135 LPCD 3. Hostels 135 LPCD Hotels 180 LPCD Restaurants 70/seat 4. Offices 45 LPCD 5. Cinema houses, concert halls and theaters 15/seat 6. Day schools 45 LPCD 7. Boarding schools 135 LPCD 8. Railway (no express/mail stops), bus stations and sea ports* 45/25# LPCD Junction railway stations & stations with express/mail stops* 70/45# LPCD Terminal stations* 45/45# LPCD 9. Air ports (international and domestic)* 70/70# LPCD * Average number of passengers handled and staff and vendors are considered # Requirement for without bathing facilities Commercial and institutional water requirements (IS 1172)
  • 13. Fire Water Requirements For cities/towns with population <1,00,000 3600 L/min/50,000 population for 2 hr duration For cities with population 1,00,000 to 3,00,000 1800 L/min./50,000 population for 2 hr duration For cities with population >3,00,000 1800 L/min./1,00,000 population for 2 hr duration Sufficient fire water should be available within 1 Km2 area. For civil defense towns/cities the fire water requirements are doubled. High rise buildings areas should have at least one fire water tank of 220 m3 capacity in every 1 km2 area. IS 9668 (1990, Reaffirmed 2010): Provision and maintenance of water supplies for fire fighting – code of practice (1st revision). High risk areas (bazars, commercial centers, high rise buildings, warehouses, industrial complexes, etc. Extra high risk areas (petrochemical complexes) Kuiching’s formula for fire water demand estimation in Indian cities populationisP minisQHere P Q .min/, 1000 128.3 3 
  • 14. Public use demand: 5% of the total consumption Public parks: 1.4L/m2./day Street washing/wetting): 1.0 to 1.5 L/m2/day Sewer cleaning: 4.5 LPCD Industrial water demand: 20-25% of the total city water demand Allowances for leaks, wastes and thefts: 15% Average Indian town water demands Domestic: 135 LPCD – 50% (65-300: 160 – 35%) Commercial, institutional and industrial: 40 LPCD – 15% (45-450: 135 – 30%) Public use: 25 LPCD – 9% (20-90: 45 – 10%) Fire demand: 15 LPCD – 6% (fire + public use) Losses, Wastage and thefts: 55 LPCD – 20% (45-150: 62 – 25%) Total: 270 LPCD (402 LPCD) Other water requirements (IS 1172?)
  • 15. Population Forecasting • Population projections are needed at the end of the design period and for the intermediary period (+15, +30 & +50 years) • Area wise population projections may be needed • Trends in population growth in the recent past become basis for future population projections • Population to be served depends on population influx and outflux; birth and death rates; annexation of new areas • Many methods can be used – Graphical methods – Sigmoid growth (logistic growth model) – Arithmetical increase method – Incremental increase method – Geometrical increase method – Decreasing rate of growth method – Method of density • Selection of the method of forecasting is very important
  • 16. Sigmoid growth (logistic growth model) • Gives complete trend of growth of the city right from the beginning to saturation limit of population Population forecasting
  • 17. Geometrical increase method / uniform rate of increase method – Applicable for growing towns with vast scope for expansion – Assumes uniform rate of increase – Find decadal rate of increase and obtain geometric mean – Uniform rate of increase: take average decadal rate of increase Population forecasting
  • 18. Decreasing rate of growth method – Find saturation population size, find population growth rate constant and forecast population – Alternatively find average decrease of the rate of the population growth is calculated and used Population Forecasting
  • 19. Population Forecasting Arithmetical increase method – Applicable to large old cities that achieved saturation conditions and showing constant population growth rate – Valid if approximately equal incremental increases have occurred between recent censuses. – Average increase of population per decade is calculated from the past population records
  • 20. Population Forecasting Incremental increase method • Increment in the arithmetical increase is determined and used • Average of increase in population is taken as per the arithmetic method and to this, average of the net incremental increase (one for every future decade) is added • a progressive decrease in the average increase can also be adopted   2 1 030 Ynn nXPP   ‘n’ is number of decades ‘X’ average arithmetic increase ‘Y’ is average incremental increase
  • 21. Graphical method The city in question considered The cities similar are taken into consideration Population Forecasting
  • 22. Water Demand Assessment Area/sector/zone wise demand assessments needed Average Day Demand (ADD), Maximum Day Demand MDD) and Peak Hour Demand (PHD) needed Can be done from the forecasted population, per capita water consumption and service factor values Wdn = (Pn x C x F ) + Dn Wdn = water demand at the end of year “n” Pn = projected population at the end of year “n” C = per capita consumption at the end of year “n” F = service factor at the end of year “n” (population fraction served) Dn = additional demand at the end of year “n” – Knowing per capita water demand is a problem – Only domestic demands (commercial and institutional demands!) assessed – assessment of Dn is a problem Demographic data, stock data and end use data all influence the water demand – technology influences
  • 23. Water Demand Assessment Clearly delineate the service area – Current service area and proposed expansion of the service area are shown on a map Make population projections – Subtract the population that will not be served (other on-site sources of water – rainwater, borewell water may be used) Find current per capita water use – Historical data may be used ( preferably of last 5 years) Find per capita water use to be used in the assessment – Make conservation corrections to per capita water use – Make adjustments to the unaccounted for water (UFW) Consider large independent users (industrial, institutional and commercial users) separately – Population equivalents or equivalent residential units Make water demand assessments
  • 24. Water Demands The demand assessment should include • Residential, Commercial, Institutional and industrial demands • Public water, ecological water and other special water demands • Fire fighting demand • Unaccounted for water (wastage, leakage, illegal taping, damaged meters)

Editor's Notes

  1. In a conventional water treatment plant, which of the following water quality parameters is not taken care off? Total dissolved solids; Hardness; fluoride; all the above