Downloaded 1,780 times
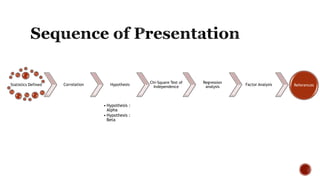
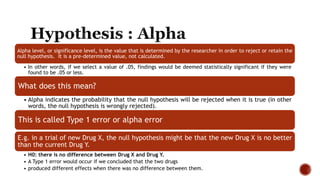
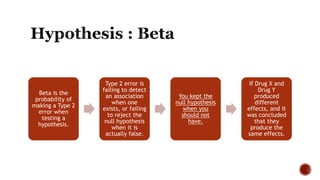
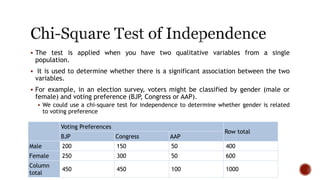
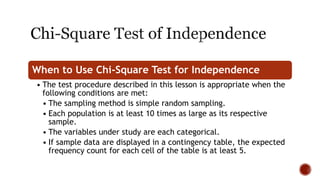
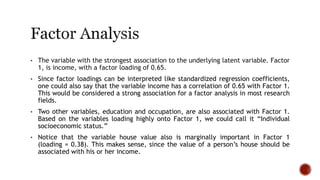

The document discusses various statistical tools utilized in research, focusing on key concepts such as correlation, hypothesis testing, chi-square tests, regression analysis, and factor analysis. It details the definitions and applications of these statistical methods, including examples and the importance of distinguishing between correlation and causation. Additionally, it addresses the concepts of null and alternative hypotheses along with the significance levels (alpha and beta errors) in hypothesis testing.